
[vc_row][vc_column][vc_separator border_width=”5″][/vc_column][/vc_row]
[vc_row][vc_column][vc_column_text]
Good evening folks,
I hope the day treated you well.
I will post the video tomorrow as I just did not get a moment to record it today!
We have just wrapped up a pretty important week in stock market history I think.
So lets see how it went down.
[/vc_column_text][/vc_column][/vc_row]
[vc_row][vc_column][vc_separator border_width=”5″][/vc_column][/vc_row]
[vc_row][vc_column][vc_column_text]
EURUSD
[/vc_column_text][/vc_column][/vc_row]
[vc_row][vc_column][vc_separator border_width=”5″][/vc_column][/vc_row][vc_row][vc_column width=”2/3″][vc_custom_heading text=”1 hr” use_theme_fonts=”yes”][vc_column_text]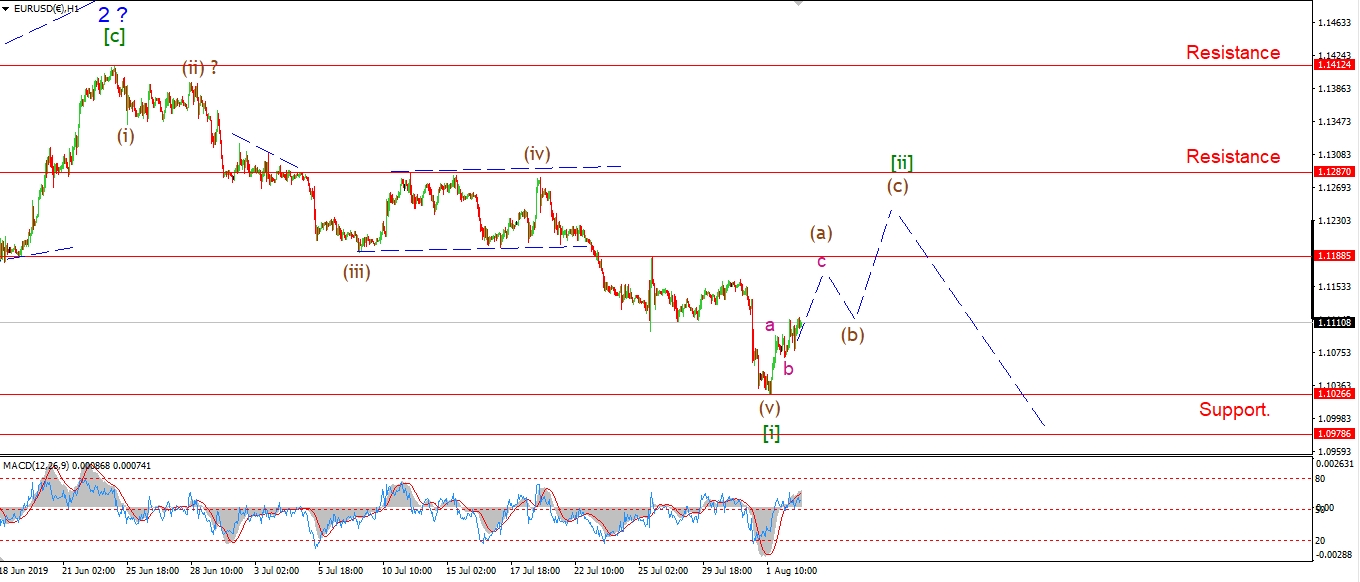 [/vc_column_text][/vc_column][vc_column width=”1/3″][vc_custom_heading text=”4 Hours” use_theme_fonts=”yes”][vc_column_text]
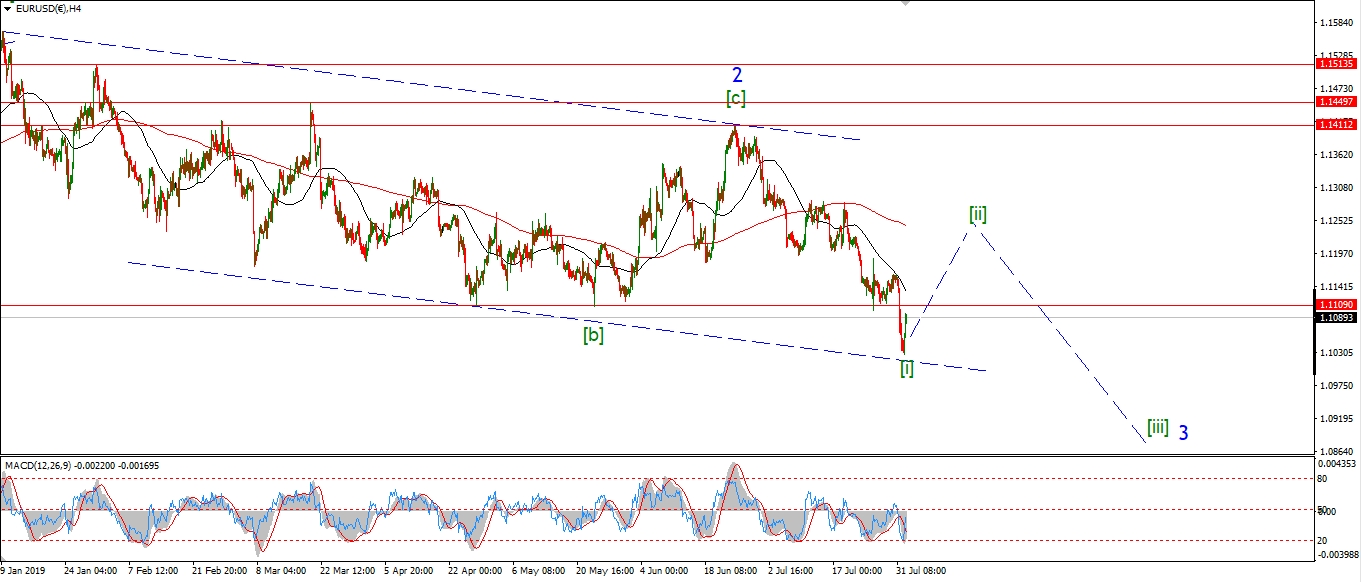 [/vc_column_text][vc_custom_heading text=”Daily” use_theme_fonts=”yes”][vc_column_text]
 [/vc_column_text][/vc_column][/vc_row]
[vc_row][vc_column][vc_column_text]
EURUSD is up off the lows at 1.1026 posted yesterday.
The rise so far counts best as a three wave move yet to complete.
I am expecting a three wave rise overall in wave [ii] over the coming week.
But I will just have to wait and see on that front.
One thing is assured,
any rally from here on will be corrective in nature.
And the price is sure to resume the downtrend once the correction completes.
Monday;
I expect wave (a) of [ii] to continue higher on Monday and hit that initial resistance level at 1.1188.
[/vc_column_text][/vc_column][/vc_row]
[vc_row][vc_column][vc_separator border_width=”5″][/vc_column][/vc_row][vc_row][vc_column][vc_column_text]
GBPUSD
[/vc_column_text][/vc_column][/vc_row][vc_row][vc_column][vc_separator border_width=”5″][/vc_column][/vc_row][vc_row][vc_column width=”2/3″][vc_custom_heading text=”1 hr” use_theme_fonts=”yes”][vc_column_text]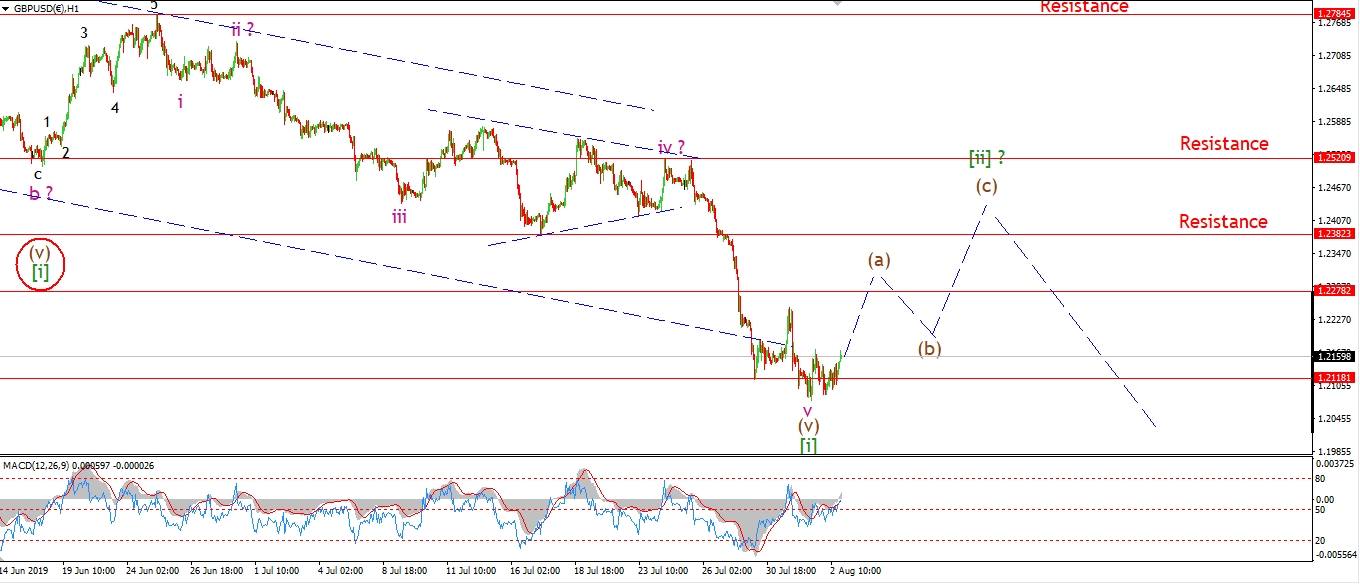 [/vc_column_text][/vc_column][vc_column width=”1/3″][vc_custom_heading text=”4 Hours” use_theme_fonts=”yes”][vc_column_text]
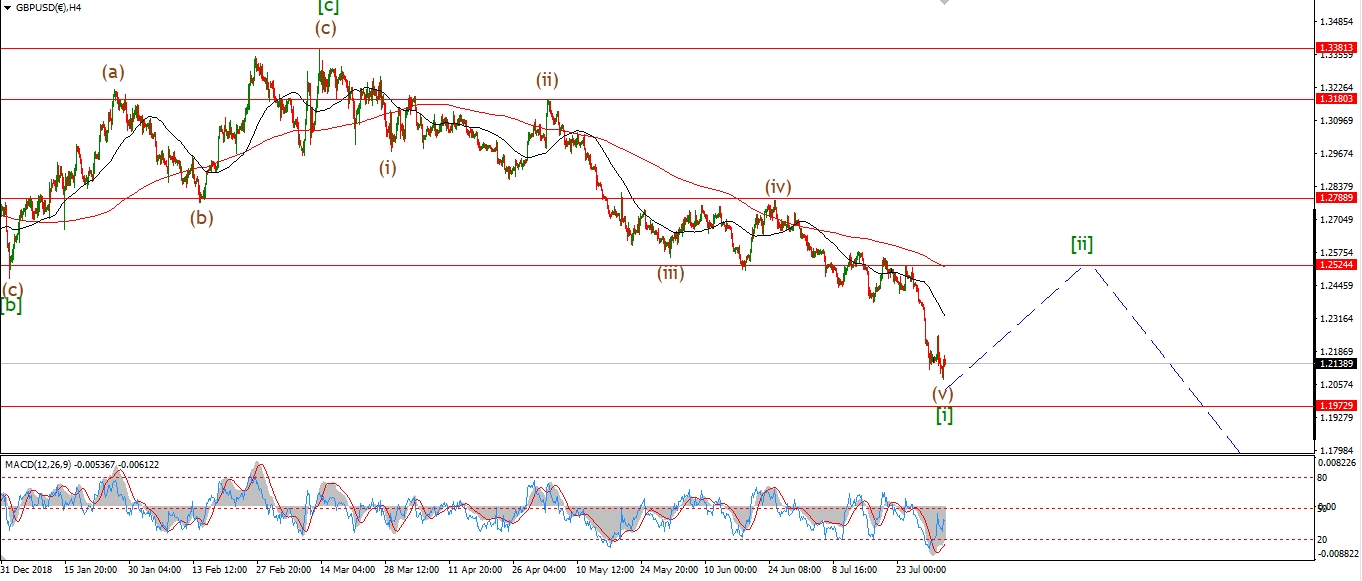 [/vc_column_text][vc_custom_heading text=”Daily” use_theme_fonts=”yes”][vc_column_text]
 [/vc_column_text][/vc_column][/vc_row]
[vc_row][vc_column][vc_column_text]
The sheer hysterical level of bearishness towards the GBP at the moment,
strikes me as a reasonable contrarian indicator.
Suddenly everyone is worried about the value of the GBP,
even though the decline has been in-force since February!
With this backdrop of doom,
you would at least expect a corrective rally to occur as shown on the short term chart.
Monday;
This is exactly what I am expecting for next week at least.
A corrective rally in wave [ii],
which is now overdue!
So, we should watch for an initial higher low in waves (a) and (b) to form next week.
Wave (c) will do most of the heavy lifting to complete wave [ii].
[/vc_column_text][/vc_column][/vc_row]
[vc_row][vc_column][vc_separator border_width=”5″][/vc_column][/vc_row][vc_row][vc_column][vc_column_text]
USDJPY
[/vc_column_text][/vc_column][/vc_row][vc_row][vc_column][vc_separator border_width=”5″][/vc_column][/vc_row][vc_row][vc_column width=”2/3″][vc_custom_heading text=”1 hr” use_theme_fonts=”yes”][vc_column_text]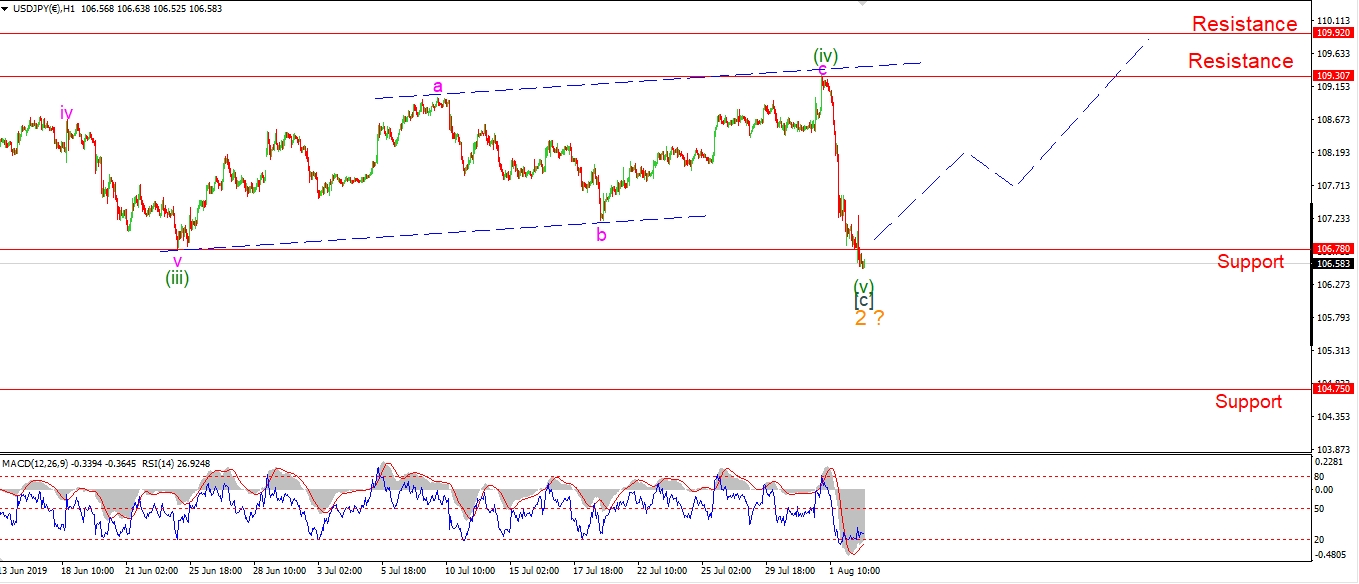 [/vc_column_text][/vc_column][vc_column width=”1/3″][vc_custom_heading text=”4 Hours” use_theme_fonts=”yes”][vc_column_text]
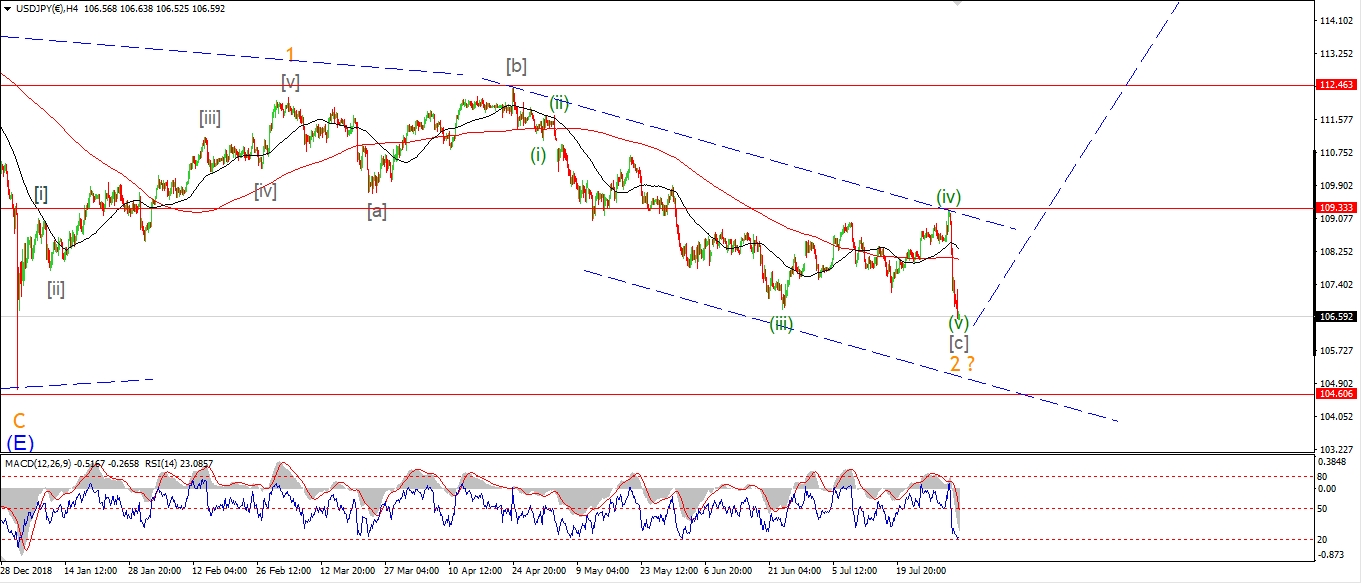 [/vc_column_text][vc_custom_heading text=”Daily” use_theme_fonts=”yes”][vc_column_text]
 [/vc_column_text][/vc_column][/vc_row]
[vc_row][vc_column][vc_column_text]
I want to focus on the 4hr chart tonight.
Yesterdays sharp decline continued overnight and took out the initial support.
This has invalidated the recent bullish count.
And now I have to rethink the action completely.
I am still long term bullish on USDJPY,
so that has not changed.
But the recent sideways move has taken the wave (iv) label,
within a five wave decline in wave [c] to complete wave ‘2’.
We will see a reaction to this decline early next week.
What I need to see from here is a five wave rally off the lows to form the turn higher.
Monday;
Watch for a bullish higher low to from next week to begin wave [i] of ‘3’.
[/vc_column_text][/vc_column][/vc_row]
[vc_row][vc_column][vc_separator border_width=”5″][/vc_column][/vc_row][vc_row][vc_column][vc_column_text]
DOW JONES INDUSTRIALS
[/vc_column_text][/vc_column][/vc_row][vc_row][vc_column][vc_separator border_width=”5″][/vc_column][/vc_row][vc_row][vc_column width=”2/3″][vc_custom_heading text=”1 hr” use_theme_fonts=”yes”][vc_column_text]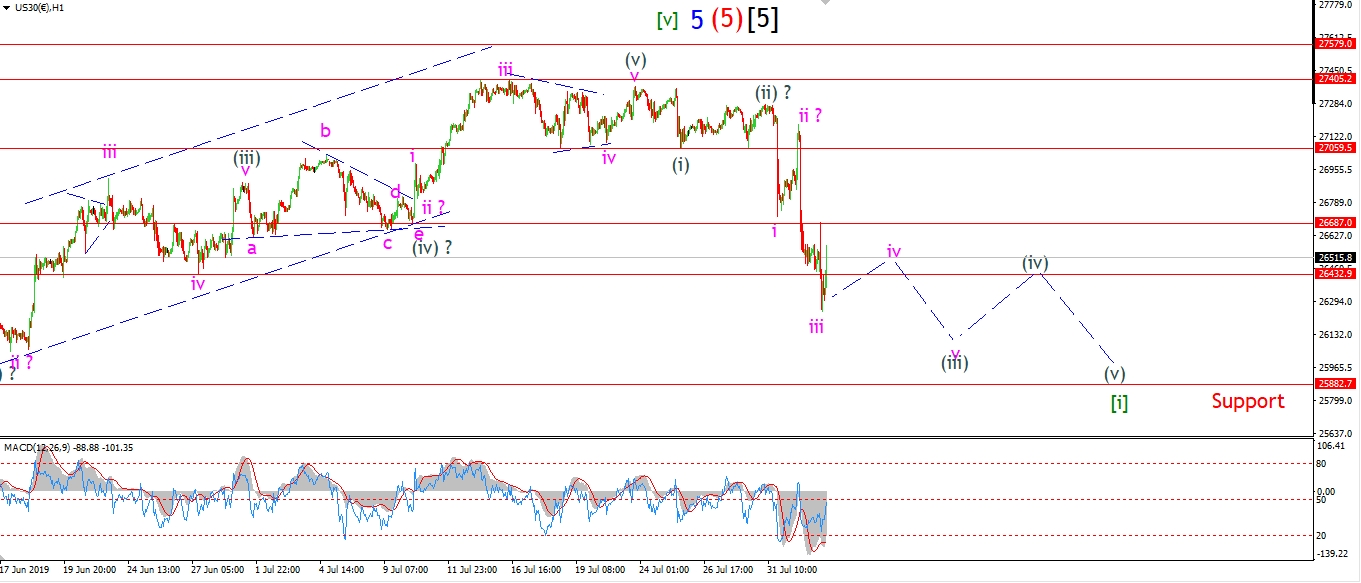 [/vc_column_text][/vc_column][vc_column width=”1/3″][vc_custom_heading text=”4 Hours” use_theme_fonts=”yes”][vc_column_text]
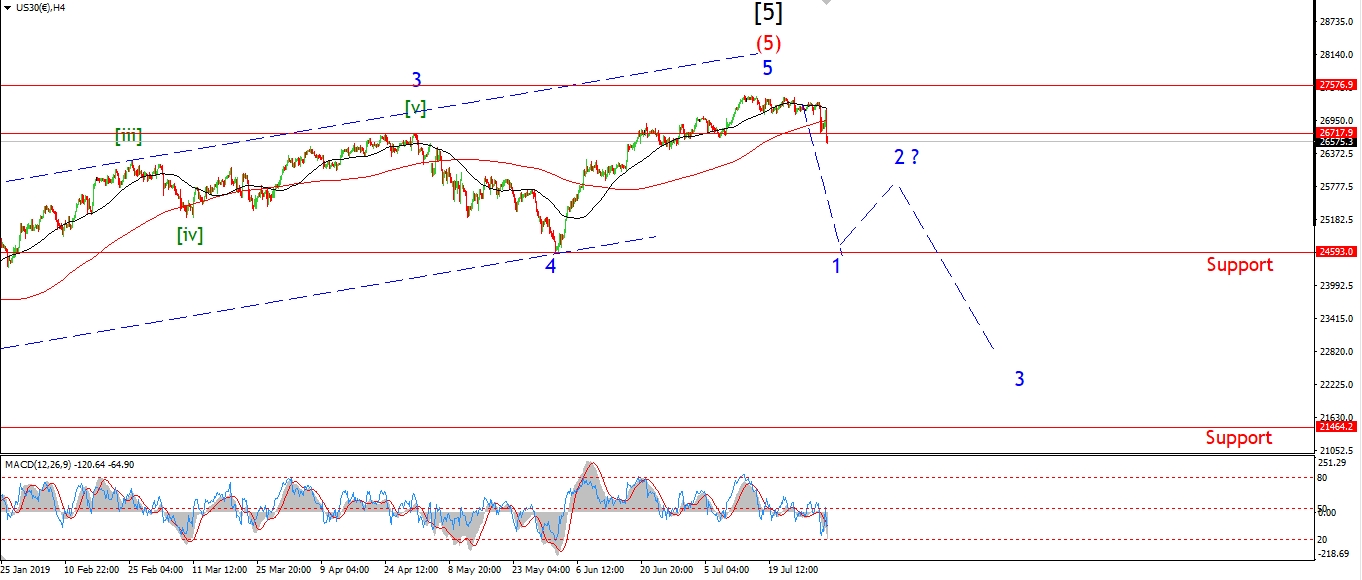 [/vc_column_text][vc_custom_heading text=”Daily” use_theme_fonts=”yes”][vc_column_text]
 [/vc_column_text][/vc_column][/vc_row]
[vc_row][vc_column][vc_column_text]
The DOW is up slightly off the lows this evening after another rough days trade.
The price has broken below two previous fourth wave lows this week,
this is shown on the short term chart.
These levels were acting as support to the recent rally,
now they should act as resistance to any correction higher to come next week.
The declines this week have sure come as a surprise to most,
we are down about a 1000 points off the all time high now,
but I think we are only just beginning.
This weeks selloff is only a snapshot of whats to come in the bearmarket.
So its time to buckle up now!
Next week;
The focus remains on tracking a complete five wave move off the highs in wave [i] as shown.
We have a good start made,
but the rest of the structure should build next week.
wave [i] should be complete by the end of the week.
And then we can focus on a corrective lower high to come.
[/vc_column_text][/vc_column][/vc_row]
[vc_row][vc_column][vc_separator border_width=”5″][/vc_column][/vc_row][vc_row][vc_column][vc_column_text]
GOLD
[/vc_column_text][/vc_column][/vc_row][vc_row][vc_column][vc_separator border_width=”5″][/vc_column][/vc_row][vc_row][vc_column width=”2/3″][vc_custom_heading text=”1 hr” use_theme_fonts=”yes”][vc_column_text]
 [/vc_column_text][/vc_column][vc_column width=”1/3″][vc_custom_heading text=”4 Hours” use_theme_fonts=”yes”][vc_column_text]
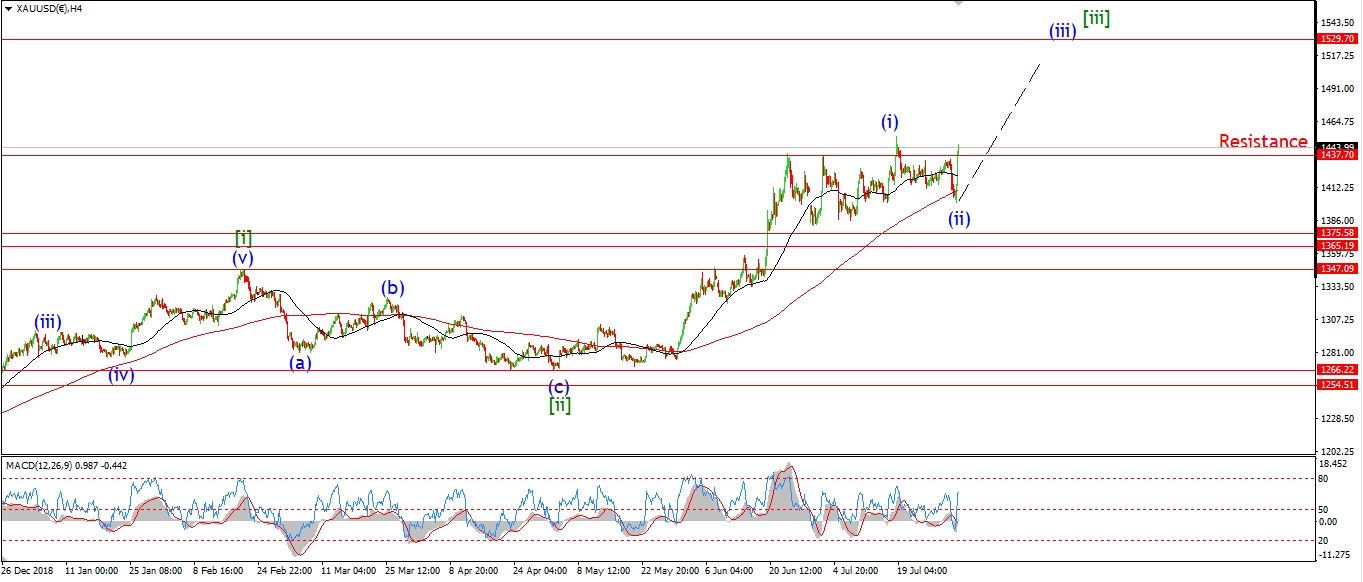 [/vc_column_text][vc_custom_heading text=”Daily” use_theme_fonts=”yes”][vc_column_text]
 [/vc_column_text][/vc_column][/vc_row]
[vc_row][vc_column][vc_column_text]
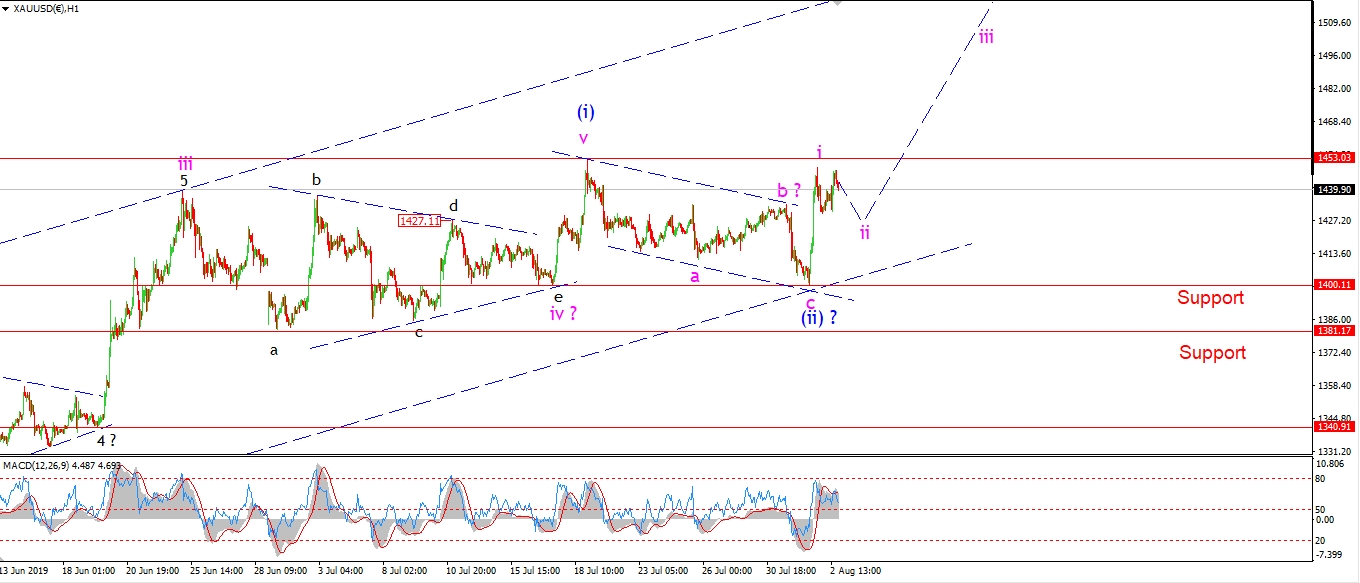
Gold has moved sideways today and has held below the initial resistance level at 1453 so far.
This corrective action is viewed as wave ‘ii’ of (iii).
Wave ‘ii’ should create a bullish higher low above 1400,
and then we can expect another rally to begin in wave ‘iii’ of (iii) before the end of ext week.
this next leg up should push above 1500 at a minimum.
Monday;
Watch for a three wave correction to complete in wave ‘ii’ pink.
This action will be a bullish signal for wave (iii) to rally strongly.
[/vc_column_text][/vc_column][/vc_row]
[vc_row][vc_column][vc_separator border_width=”5″][/vc_column][/vc_row][vc_row][vc_column][vc_column_text]
U.S CRUDE OIL
[/vc_column_text][/vc_column][/vc_row][vc_row][vc_column][vc_separator border_width=”5″][/vc_column][/vc_row][vc_row][vc_column width=”2/3″][vc_custom_heading text=”1 hr” use_theme_fonts=”yes”][vc_column_text]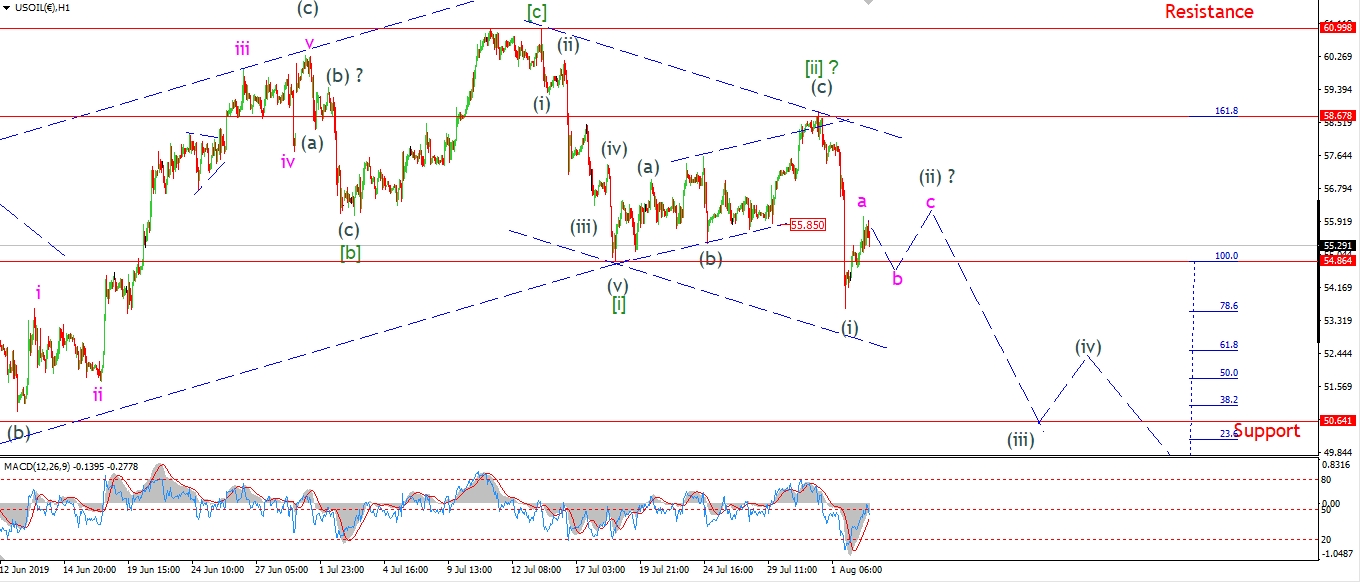 [/vc_column_text][/vc_column][vc_column width=”1/3″][vc_custom_heading text=”4 Hours” use_theme_fonts=”yes”][vc_column_text]
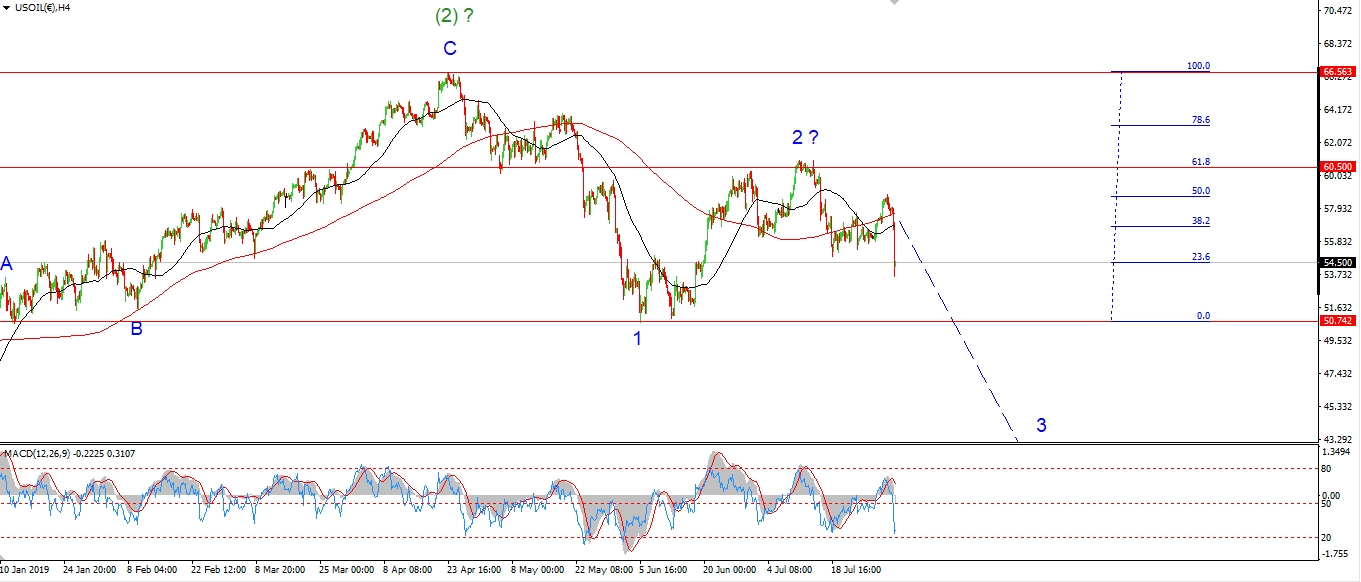 [/vc_column_text][vc_custom_heading text=”Daily” use_theme_fonts=”yes”][vc_column_text]
 [/vc_column_text][/vc_column][/vc_row]
[vc_row][vc_column][vc_column_text]
Crude corrected higher today to begin wave (ii).
I have labelled todays rise as wave ‘a’ of (ii),
with waves ‘b’ and ‘c’ expected early next week.
Wave (ii) should trace out a bearish lower high by Wednesday.
And then I expect wave (iii) of [iii] down to get underway.
It is possible that todays rise completed all of wave (ii),
but this is less likely than the wave count I have shown.
Monday;
Watch for wave ‘b’ of (ii) to drop to about 54.50 again.
Wave ‘c’ might even begin by Monday evening.
[/vc_column_text][/vc_column][/vc_row]
[vc_row][vc_column][vc_separator border_width=”5″][/vc_column][/vc_row][vc_row][vc_column][vc_column_text]
US 10 yr Treasuries.
[/vc_column_text][/vc_column][/vc_row][vc_row][vc_column][vc_separator border_width=”5″][/vc_column][/vc_row][vc_row][vc_column width=”2/3″][vc_custom_heading text=”1 hr” use_theme_fonts=”yes”][vc_column_text]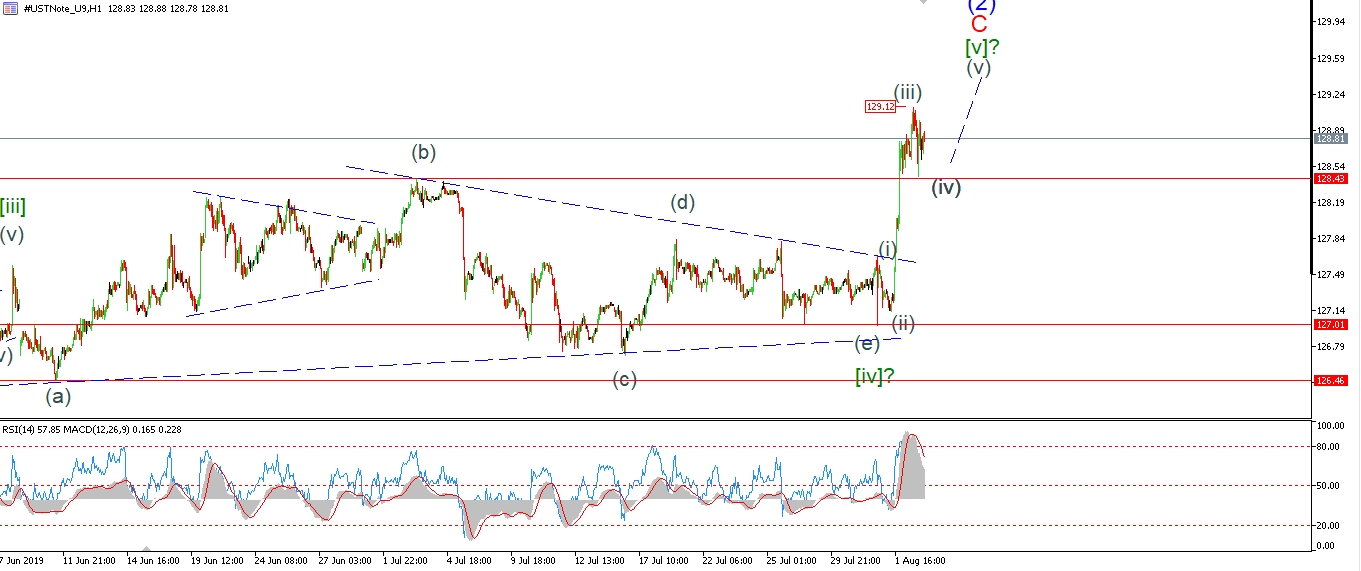 [/vc_column_text][/vc_column][vc_column width=”1/3″][vc_custom_heading text=”4 Hours” use_theme_fonts=”yes”][vc_column_text]
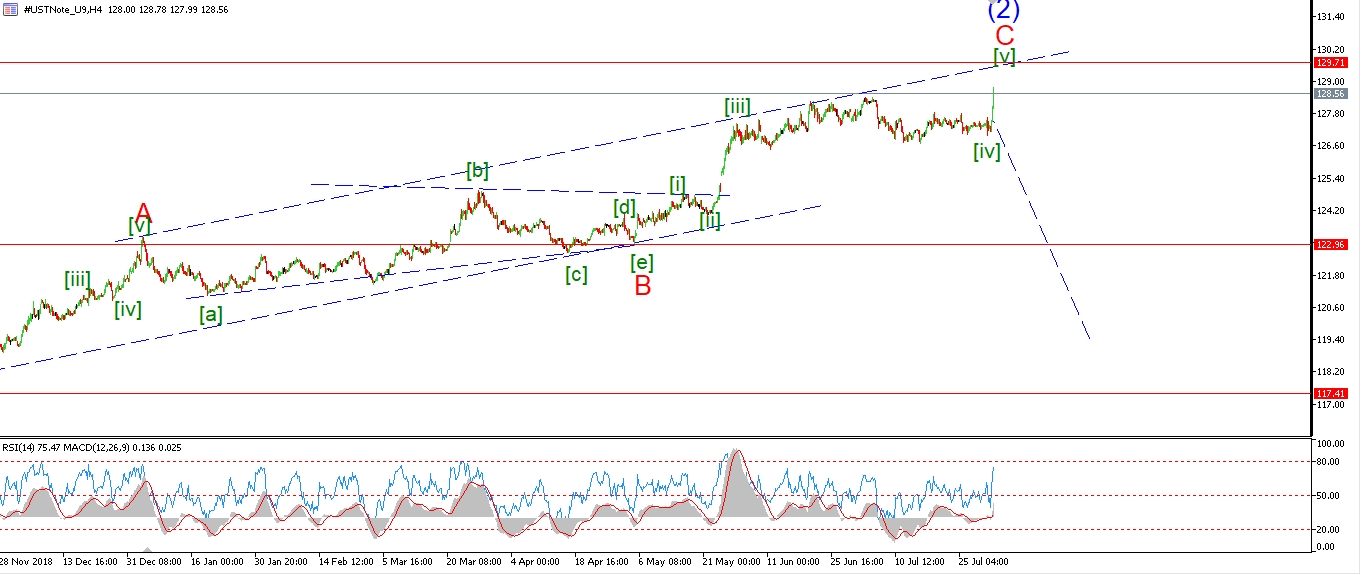 [/vc_column_text][vc_custom_heading text=”Daily” use_theme_fonts=”yes”][vc_column_text]
 [/vc_column_text][/vc_column][/vc_row]
[vc_row][vc_column][vc_column_text]
The 10YR is stuck in a tight ranging pattern today after that powerful rally this week.
This could be a triangle forming for wave (iv),
but it is impossible to tell at the moment.
Once wave (iv) completes early next week,
I expect the rally to continue and reach above 129.50 in wave (v) of [v].
Monday;
Watch for wave (iv) to complete on Monday,
A break of 129.12 again will signal wave (v) has begun.
[/vc_column_text][/vc_column][/vc_row]
[vc_row][vc_column][vc_separator border_width=”5″][/vc_column][/vc_row][vc_row][vc_column][vc_column_text]
SILVER
[/vc_column_text][/vc_column][/vc_row][vc_row][vc_column][vc_separator border_width=”5″][/vc_column][/vc_row][vc_row][vc_column width=”2/3″][vc_custom_heading text=”1 hr” use_theme_fonts=”yes”][vc_column_text]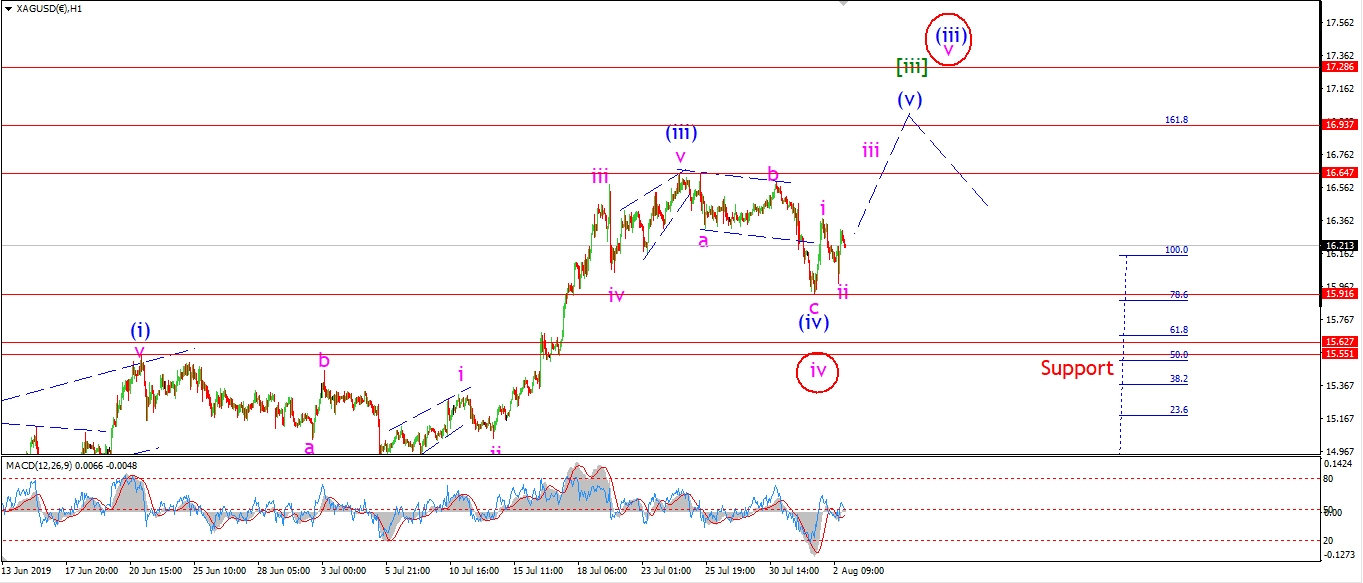 [/vc_column_text][/vc_column][vc_column width=”1/3″][vc_custom_heading text=”4 Hours” use_theme_fonts=”yes”][vc_column_text]
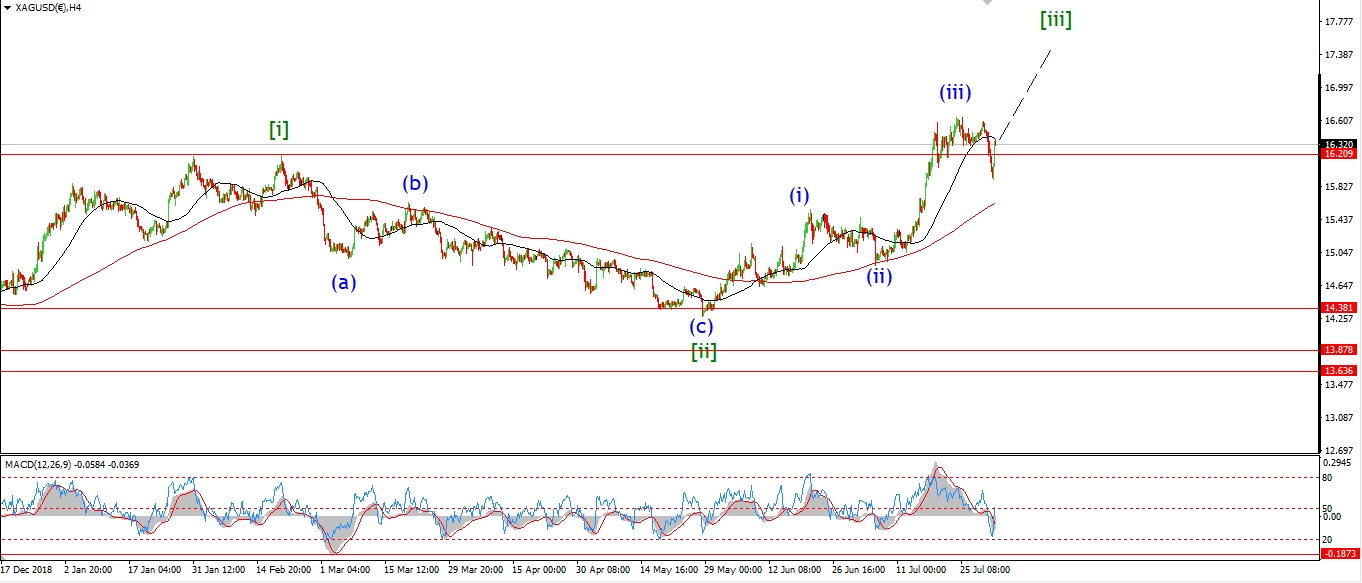 [/vc_column_text][vc_custom_heading text=”Daily” use_theme_fonts=”yes”][vc_column_text]
 [/vc_column_text][/vc_column][/vc_row]
[vc_row][vc_column][vc_column_text]
Silver did drop today to form a higher low above 15.91.
This is viewed as wave ‘ii’ pink in place now.
And this should be a bullish signal for next weeks trade.
As we setup for a rally in wave (v) blue as shown.
Wave ‘iii’ of (v) is expected to push higher again on Monday
with a minimum target at the recent high of 16.64.
Wave (v)in full, has the potential to push up to the 17.50 area.
But if the alternate proves correct,
then wave (v) could go significantly higher.
We will have to be patient to see what plays out over the coming week.
Monday;
watch for wave (iv) to hold at 15.91.
wave ‘iii’ of (v) should continue higher.
[/vc_column_text][/vc_column][/vc_row]
[vc_row][vc_column][vc_separator border_width=”5″][/vc_column][/vc_row][vc_row][vc_column][vc_column_text]
S&P 500.
[/vc_column_text][/vc_column][/vc_row][vc_row][vc_column][vc_separator border_width=”5″][/vc_column][/vc_row][vc_row][vc_column width=”2/3″][vc_custom_heading text=”1 hr” use_theme_fonts=”yes”][vc_column_text]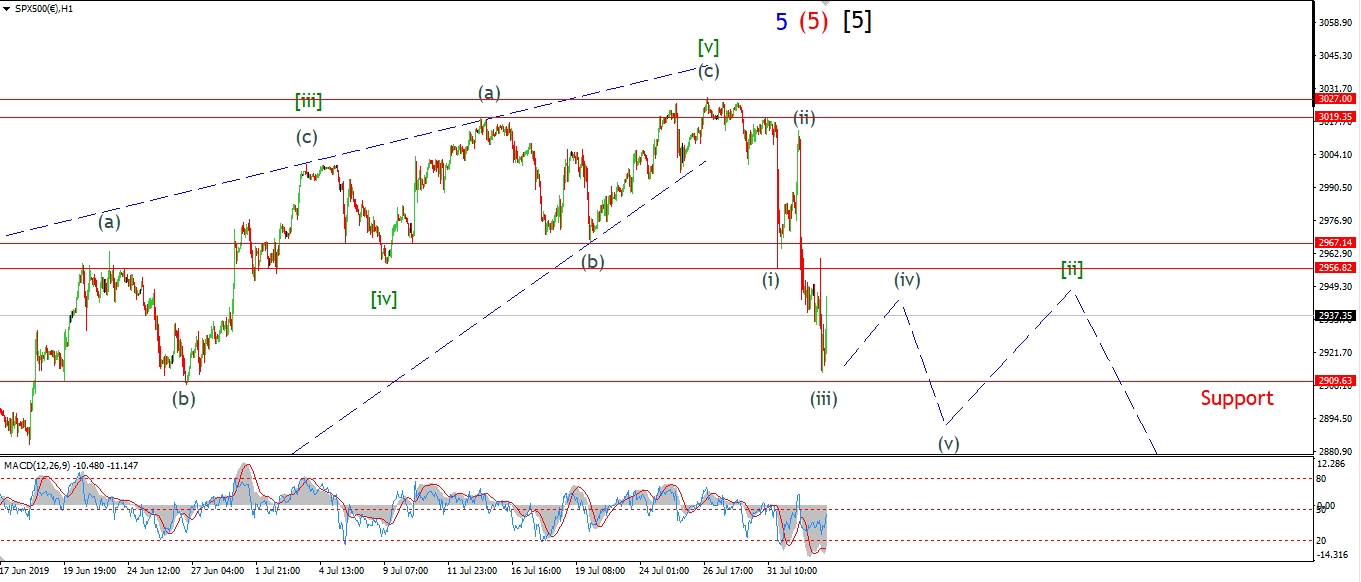 [/vc_column_text][/vc_column][vc_column width=”1/3″][vc_custom_heading text=”4 Hours” use_theme_fonts=”yes”][vc_column_text]
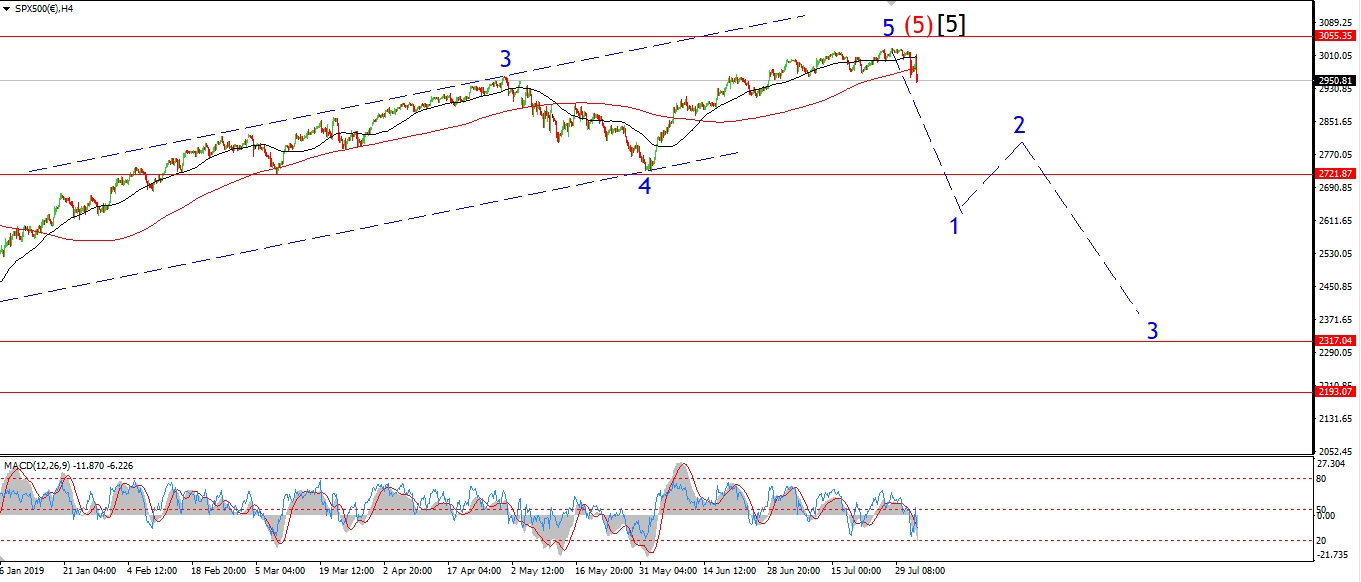 [/vc_column_text][vc_custom_heading text=”Daily” use_theme_fonts=”yes”][vc_column_text]
 [/vc_column_text][/vc_column][/vc_row]
[vc_row][vc_column][vc_column_text]
The S&P is holding above 2900 so far.
But the action looks corrective off the lows of the session today,
so I have labelled today’s sideways move as the beginning of wave (iv) of [i].
It looks likely that wave (iv) will continue sideways on Monday,
If this short term count is correct,
wave (iv) should hold below the wave (i) low at 2955,
then the declines should return Tuesday,
and wave (v) should punch below 2900 again to complete a five wave decline off the high.
Monday;
Watch for the correction in wave (iv) to continue and hold below 2955.
[/vc_column_text][/vc_column][/vc_row]
[vc_row][vc_column][vc_separator border_width=”5″][/vc_column][/vc_row]