
[vc_row][vc_column][vc_separator border_width=”5″][/vc_column][/vc_row]
[vc_row][vc_column][vc_column_text]
Hi there everyone.
[/vc_column_text][/vc_column][/vc_row]
[vc_row][vc_column][vc_separator border_width=”5″][/vc_column][/vc_row]
[vc_row][vc_column][vc_column_text]
EURUSD
[/vc_column_text][/vc_column][/vc_row]
[vc_row][vc_column][vc_separator border_width=”5″][/vc_column][/vc_row][vc_row][vc_column width=”2/3″][vc_custom_heading text=”1 hr” use_theme_fonts=”yes”][vc_column_text]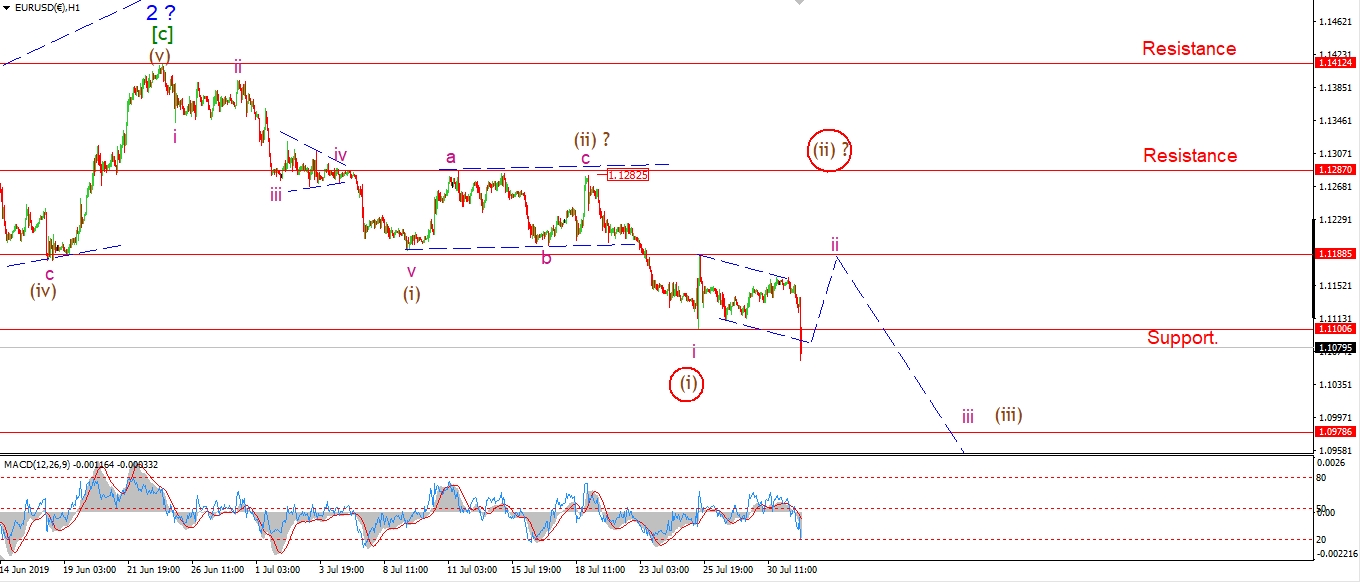 [/vc_column_text][/vc_column][vc_column width=”1/3″][vc_custom_heading text=”4 Hours” use_theme_fonts=”yes”][vc_column_text]
 [/vc_column_text][vc_custom_heading text=”Daily” use_theme_fonts=”yes”][vc_column_text]
 [/vc_column_text][/vc_column][/vc_row]
[vc_row][vc_column][vc_column_text]
The whipsaw effect of the FED rate cut has hit a few short term counts today.
EURUSD was moving sideways in a regular flat correction until this evening.
The sharp drop broke 1.1106 and ruled out last nights count.
I suspect wave ‘ii’ is still in force though,
the drop off 1.1188 is still in three waves.
So we may be dealing with an expanded flat wave ‘ii’ pink.
In that case,
the price should rise back above 1.1188 again to complete the three wave correction.
And then we will look for a drop into wave ‘iii’ of (iii) again.
Tomorrow;
Watch for wave ‘ii’ to complete an expanded flat correction with a break of 1.1188 again.
[/vc_column_text][/vc_column][/vc_row]
[vc_row][vc_column][vc_separator border_width=”5″][/vc_column][/vc_row][vc_row][vc_column][vc_column_text]
GBPUSD
[/vc_column_text][/vc_column][/vc_row][vc_row][vc_column][vc_separator border_width=”5″][/vc_column][/vc_row][vc_row][vc_column width=”2/3″][vc_custom_heading text=”1 hr” use_theme_fonts=”yes”][vc_column_text]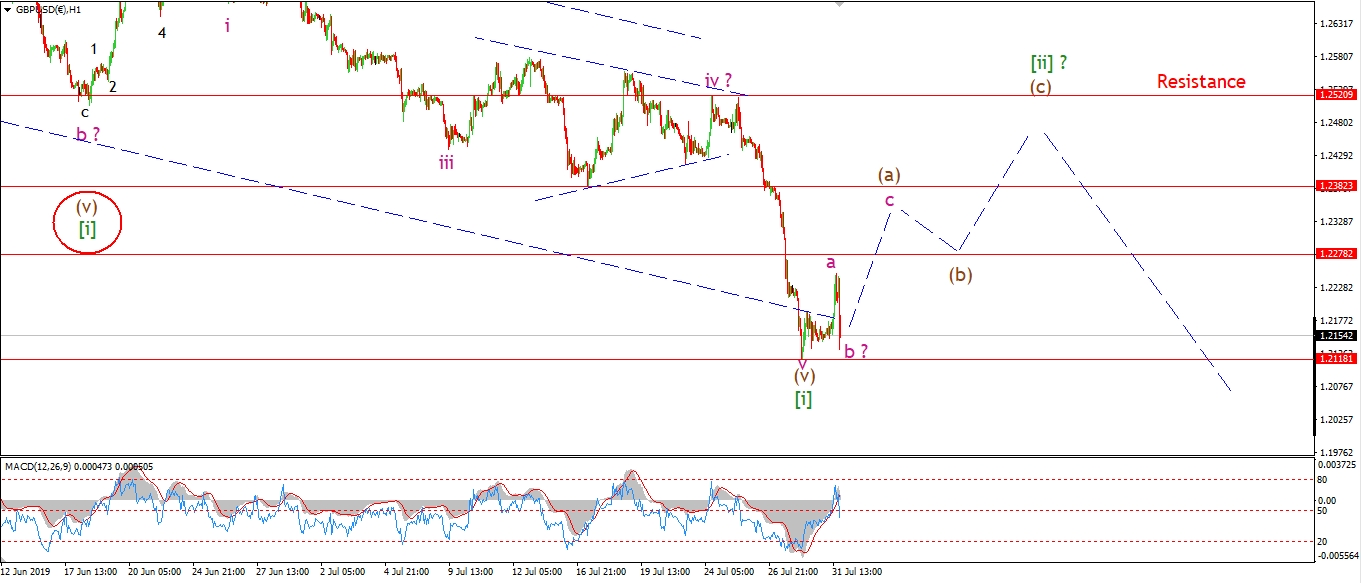 [/vc_column_text][/vc_column][vc_column width=”1/3″][vc_custom_heading text=”4 Hours” use_theme_fonts=”yes”][vc_column_text]
 [/vc_column_text][vc_custom_heading text=”Daily” use_theme_fonts=”yes”][vc_column_text]
 [/vc_column_text][/vc_column][/vc_row]
[vc_row][vc_column][vc_column_text]
Cable has traced out a three wave rally so far today,
off the recent extreme low at 1.2118.
This action is viewed as wave ‘a’ of (a)
as part of a larger three wave correction in wave [ii] green.
Going on this action,
I think wave [ii] is beginning a flat correction higher.
This should trace out a 3,3,5 internal wave structure,
with choppy and overlapping action.
And this correction should continue for a week or so from here.
I expect wave (a) to hit 1.2300 before completing.
The bearish headlines are all over the front pages of Bloomberg and the like today,
which suggests a bearish extreme in the short term price action has been reached.
And this fact alone should allow for a short term correction higher to begin.
Tomorrow;
Price should hold above 1.2118 for now.
wave ‘c’ of (a) should continue higher tomorrow.
[/vc_column_text][/vc_column][/vc_row]
[vc_row][vc_column][vc_separator border_width=”5″][/vc_column][/vc_row][vc_row][vc_column][vc_column_text]
USDJPY
[/vc_column_text][/vc_column][/vc_row][vc_row][vc_column][vc_separator border_width=”5″][/vc_column][/vc_row][vc_row][vc_column width=”2/3″][vc_custom_heading text=”1 hr” use_theme_fonts=”yes”][vc_column_text]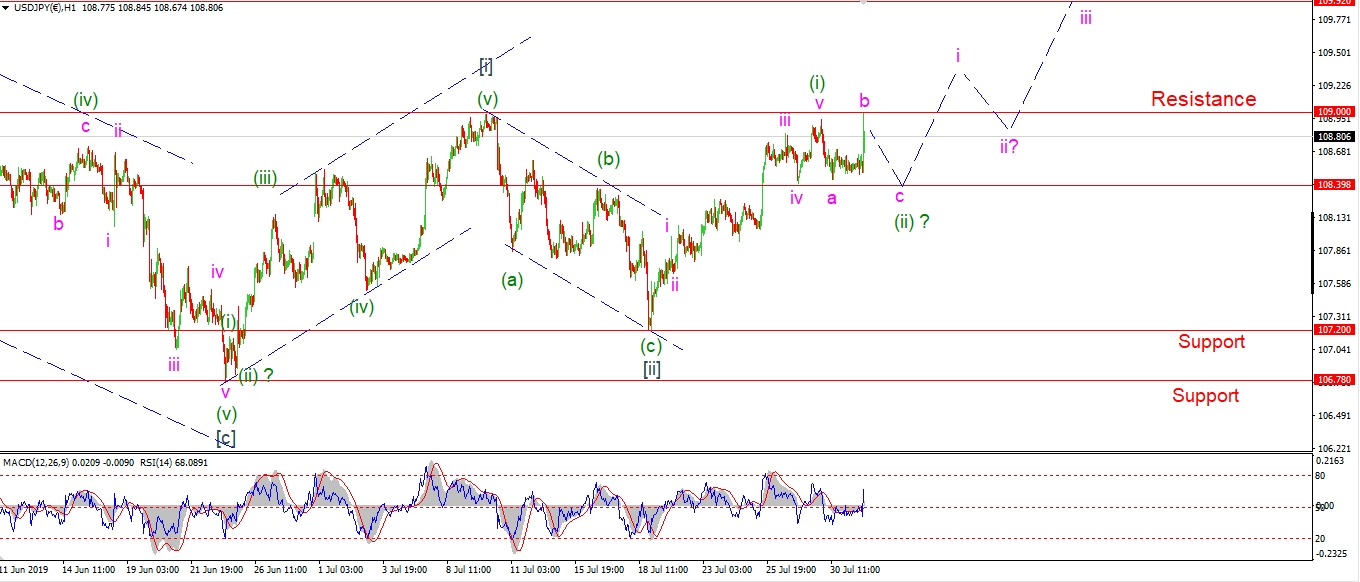 [/vc_column_text][/vc_column][vc_column width=”1/3″][vc_custom_heading text=”4 Hours” use_theme_fonts=”yes”][vc_column_text]
 [/vc_column_text][vc_custom_heading text=”Daily” use_theme_fonts=”yes”][vc_column_text]
 [/vc_column_text][/vc_column][/vc_row]
[vc_row][vc_column][vc_column_text]
Todays action has forced a slight change to the short term count for USDJPY also.
The recent high is now viewed as the top of wave (i) green.
Wave (ii) should be underway now.
With the current high viewed as wave ‘b’ of (ii).
Wave ‘c’ of (ii) should fall back to 108.40 again
to complete a three wave pattern.
This should set us up for a rally in wave (iii) to begin.
Tomorrow;
Watch for wave ‘c’ to begin soon and fall back to short term support.
[/vc_column_text][/vc_column][/vc_row]
[vc_row][vc_column][vc_separator border_width=”5″][/vc_column][/vc_row][vc_row][vc_column][vc_column_text]
DOW JONES INDUSTRIALS
[/vc_column_text][/vc_column][/vc_row][vc_row][vc_column][vc_separator border_width=”5″][/vc_column][/vc_row][vc_row][vc_column width=”2/3″][vc_custom_heading text=”1 hr” use_theme_fonts=”yes”][vc_column_text]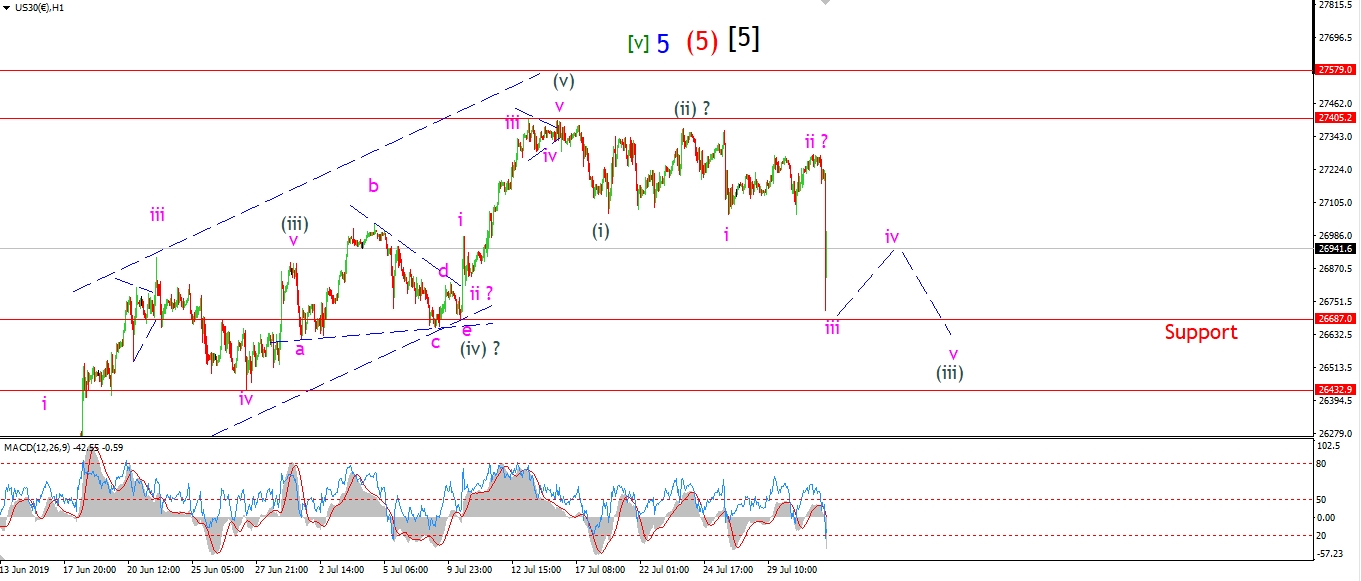 [/vc_column_text][/vc_column][vc_column width=”1/3″][vc_custom_heading text=”4 Hours” use_theme_fonts=”yes”][vc_column_text]
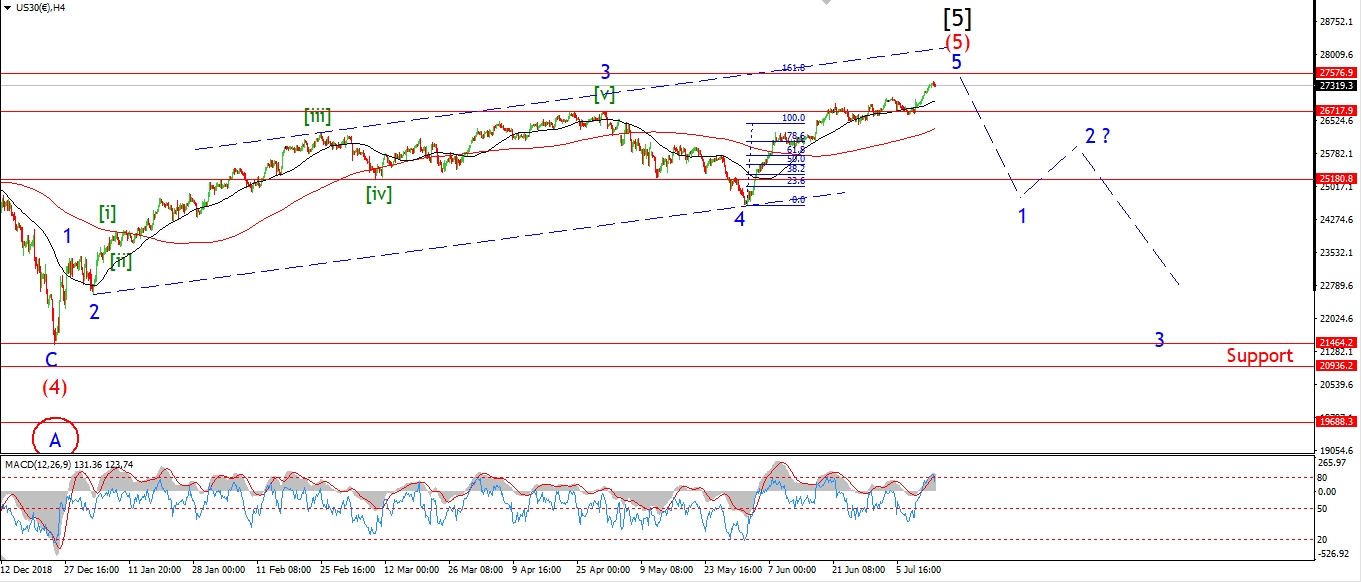 [/vc_column_text][vc_custom_heading text=”Daily” use_theme_fonts=”yes”][vc_column_text]
 [/vc_column_text][/vc_column][/vc_row]
[vc_row][vc_column][vc_column_text]
The initial reaction to the rate cut is of course a sell off!
I am viewing todays decline as the beginning of wave ‘iii’ of (i) to the downside.
So this decline should continue for the rest of the week in wave (i).
And we must see a clear five wave pattern lower develop,
with a break of 26600 at a minimum.
If this action happens over the next week,
then I think we are on for a very large decline to develop over the coming months.
The decline I expect from here,
should take out the December low at a minimum.
But the main focus now is for wave (i) to trace out a five wave decline to get the ball rolling.
Tomorrow;
Watch for wave ‘iii’ of (i) to continue lower towards 26700.
Wave ‘iv’ should bring a consolidation below 27000 rather than a new rally.
[/vc_column_text][/vc_column][/vc_row]
[vc_row][vc_column][vc_separator border_width=”5″][/vc_column][/vc_row][vc_row][vc_column][vc_column_text]
GOLD
[/vc_column_text][/vc_column][/vc_row][vc_row][vc_column][vc_separator border_width=”5″][/vc_column][/vc_row][vc_row][vc_column width=”2/3″][vc_custom_heading text=”1 hr” use_theme_fonts=”yes”][vc_column_text]
 [/vc_column_text][/vc_column][vc_column width=”1/3″][vc_custom_heading text=”4 Hours” use_theme_fonts=”yes”][vc_column_text]
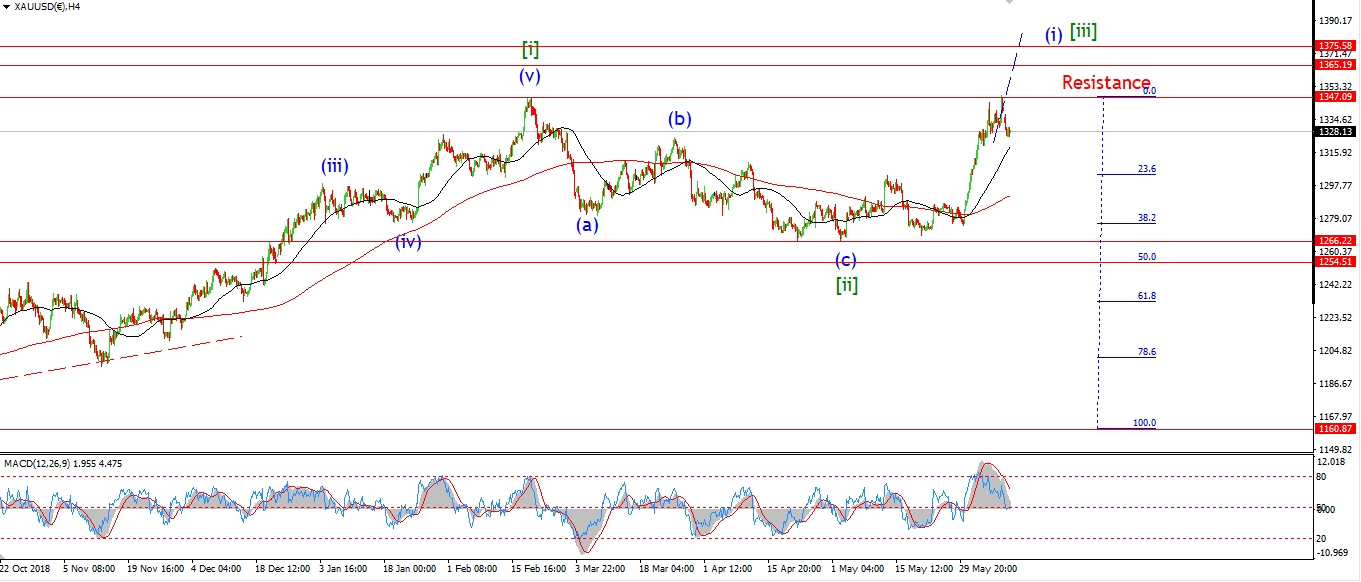 [/vc_column_text][vc_custom_heading text=”Daily” use_theme_fonts=”yes”][vc_column_text]
 [/vc_column_text][/vc_column][/vc_row]
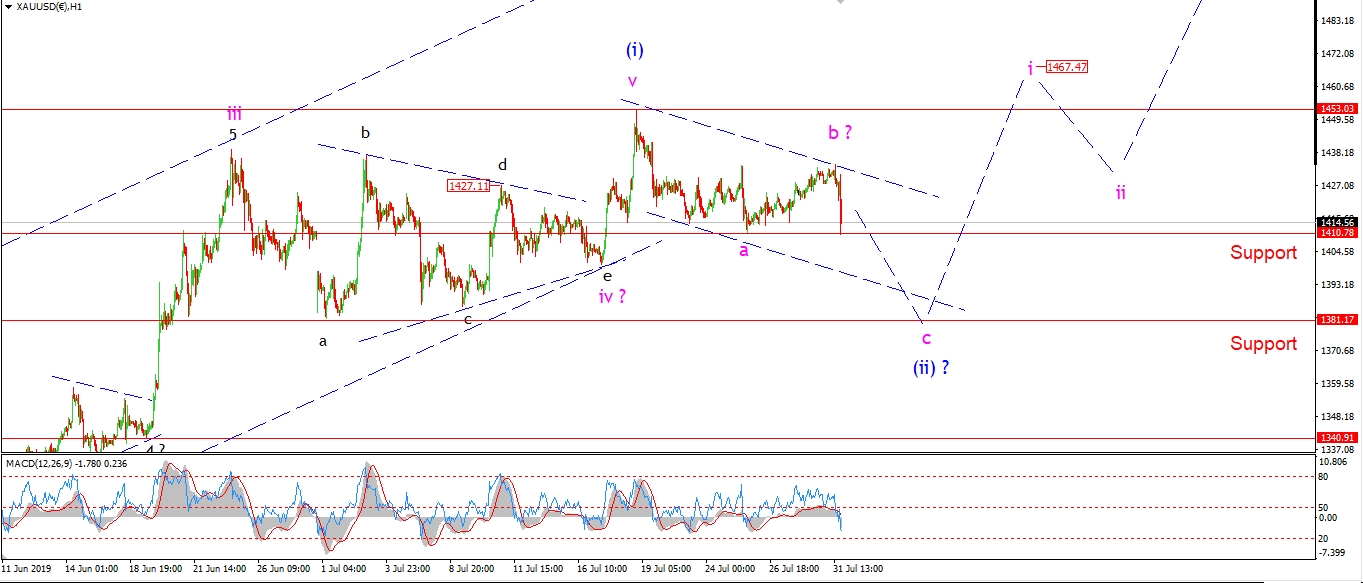
[vc_row][vc_column][vc_column_text]
Gold has sold off today to herald in wave (ii) blue.
Todays decline rules out the short term bullish count for wave ‘v’ of (i) that I was working with.
The price has not broken below 1400 to confirm the alternate count just yet.
but I think it is worth switching to that alternate count anyway,
given the decline today.
So;
The recent corrective action to the upside is now viewed as wave ‘b’ of (ii).
With the sharp decline today now beginning wave ‘c’ of (ii).
This new decline should prove corrective in wave (ii).
And the gold will resume a rally in wave (iii) once a three wave correction is complete.
Wave ‘c’ should find support at the lower end of the previous fourth wave at about 1380.
Tomorrow;
Watch for wave ‘c’ of (ii) to continue lower in five waves to 1380 over the coming days.
It looks like wave (ii) will complete next week.
[/vc_column_text][/vc_column][/vc_row]
[vc_row][vc_column][vc_separator border_width=”5″][/vc_column][/vc_row][vc_row][vc_column][vc_column_text]
U.S CRUDE OIL
[/vc_column_text][/vc_column][/vc_row][vc_row][vc_column][vc_separator border_width=”5″][/vc_column][/vc_row][vc_row][vc_column width=”2/3″][vc_custom_heading text=”1 hr” use_theme_fonts=”yes”][vc_column_text]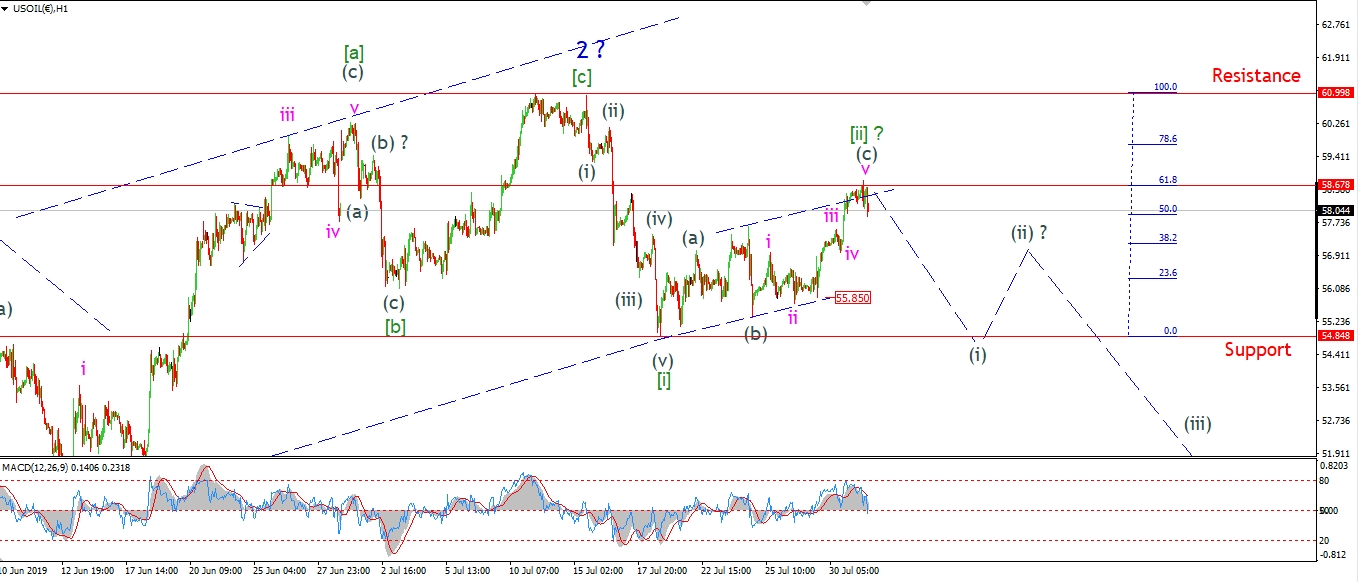 [/vc_column_text][/vc_column][vc_column width=”1/3″][vc_custom_heading text=”4 Hours” use_theme_fonts=”yes”][vc_column_text]
 [/vc_column_text][vc_custom_heading text=”Daily” use_theme_fonts=”yes”][vc_column_text]
 [/vc_column_text][/vc_column][/vc_row]
[vc_row][vc_column][vc_column_text]
Crude hit a high today of 58.80 today.
This high is viewed as wave (c) of [ii].
The price broke above the upper trend channel line to meet the 62% retracement level
and then sold off again this evening.
The wave count now calls for a renewed selloff to begin wave [iii].
This should come in the form of a bearish lower high at wave (ii) as shown.
If wave (i) falls below 54.84 that will be a clear signal that wave [iii] down is underway.
Tomorrow;
Watch for 58.82 to hold now,
and wave (i) of [iii] to continue lower for the next few sessions.
Initial support lies in the area of 55.80.
[/vc_column_text][/vc_column][/vc_row]
[vc_row][vc_column][vc_separator border_width=”5″][/vc_column][/vc_row][vc_row][vc_column][vc_column_text]
US 10 yr Treasuries.
[/vc_column_text][/vc_column][/vc_row][vc_row][vc_column][vc_separator border_width=”5″][/vc_column][/vc_row][vc_row][vc_column width=”2/3″][vc_custom_heading text=”1 hr” use_theme_fonts=”yes”][vc_column_text]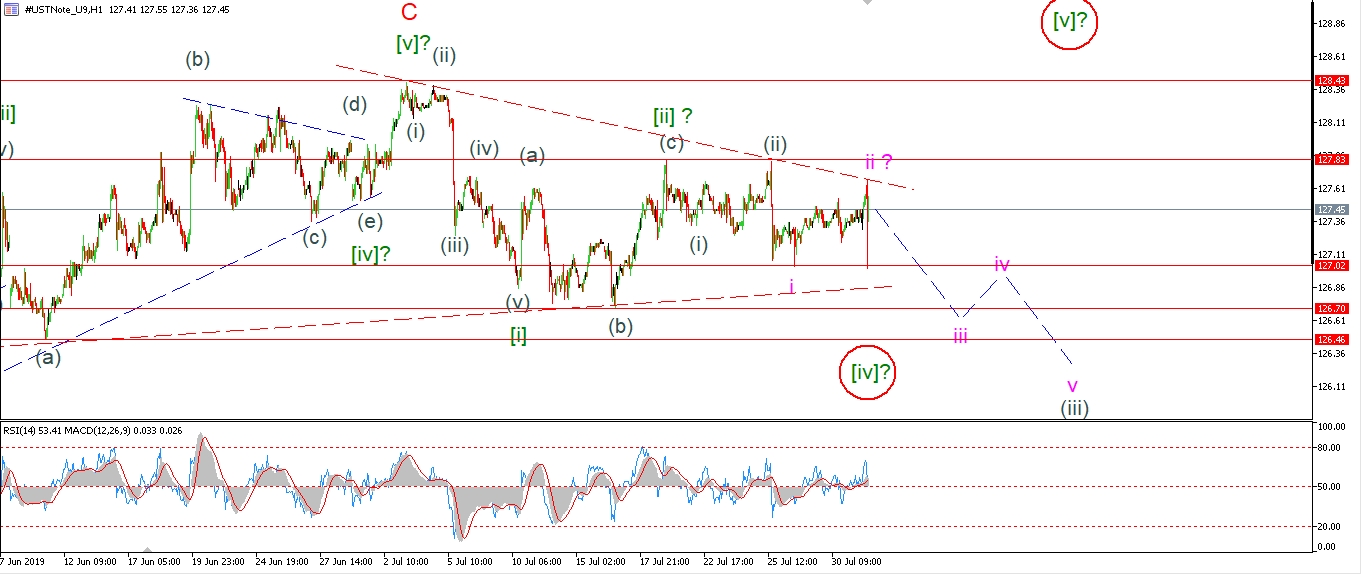 [/vc_column_text][/vc_column][vc_column width=”1/3″][vc_custom_heading text=”4 Hours” use_theme_fonts=”yes”][vc_column_text]
 [/vc_column_text][vc_custom_heading text=”Daily” use_theme_fonts=”yes”][vc_column_text]
 [/vc_column_text][/vc_column][/vc_row]
[vc_row][vc_column][vc_column_text]
Even though the price did spike lower this evening,
that action has not ruled out the alternate count as I thought it would.
The price rebounded sharply off that low again leaving the triangle intact.
So this leaves the door open for the alternate count to take over.
If the price breaks above 127.83 tomorrow,
that will trigger the alternate count and we can focus on wave [v] as shown.
Tomorrow;
The key level in the short term lies at 127.83.
Lets see if this breaks and triggers the alternate count.
[/vc_column_text][/vc_column][/vc_row]
[vc_row][vc_column][vc_separator border_width=”5″][/vc_column][/vc_row][vc_row][vc_column][vc_column_text]
SILVER
[/vc_column_text][/vc_column][/vc_row][vc_row][vc_column][vc_separator border_width=”5″][/vc_column][/vc_row][vc_row][vc_column width=”2/3″][vc_custom_heading text=”1 hr” use_theme_fonts=”yes”][vc_column_text]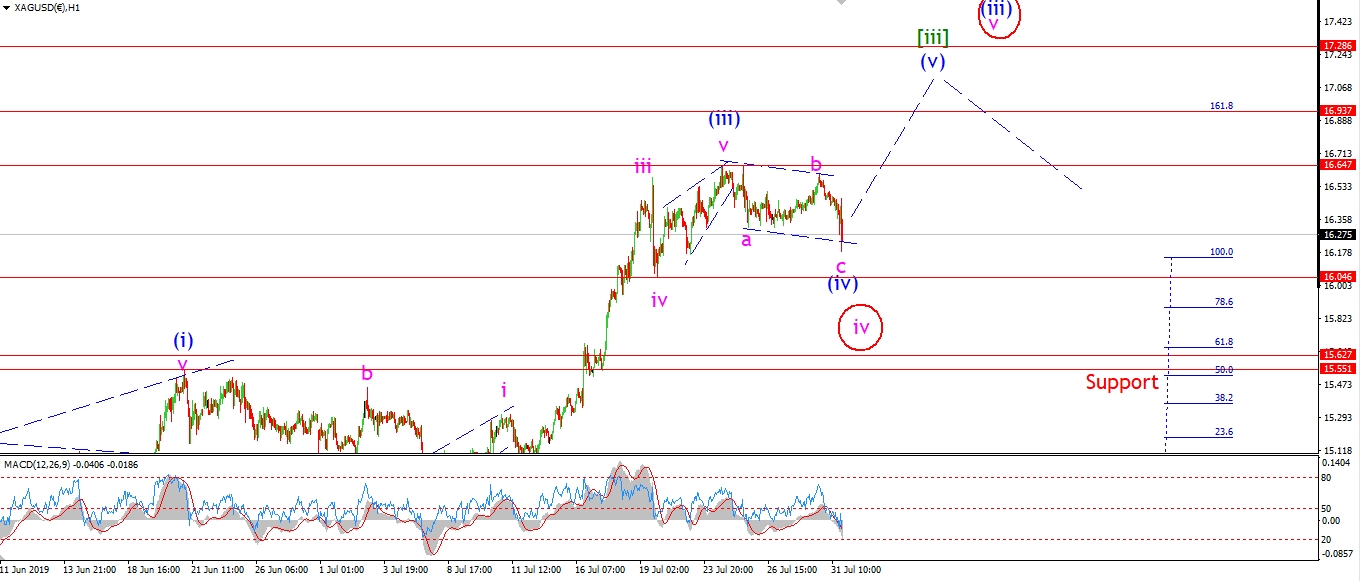 [/vc_column_text][/vc_column][vc_column width=”1/3″][vc_custom_heading text=”4 Hours” use_theme_fonts=”yes”][vc_column_text]
 [/vc_column_text][vc_custom_heading text=”Daily” use_theme_fonts=”yes”][vc_column_text]
 [/vc_column_text][/vc_column][/vc_row]
[vc_row][vc_column][vc_column_text]
Silver seems to have completed a three wave pattern off the high labelled wave (iii) at todays lows.
It is still hard to know if this is wave (iv) of [iii],
or the alternate wave ‘iv’ of (iii) as shown by the alternate count.
Both patterns are pointing higher in a fifth wave in the short term.
So we should see a break above 16.64 again by Friday.
Tomorrow;
watch for wave (iv) to complete soon.
A spike higher off todays low which creates a higher low,
will signal wave (v) has begun.
[/vc_column_text][/vc_column][/vc_row]
[vc_row][vc_column][vc_separator border_width=”5″][/vc_column][/vc_row][vc_row][vc_column][vc_column_text]
S&P 500.
[/vc_column_text][/vc_column][/vc_row][vc_row][vc_column][vc_separator border_width=”5″][/vc_column][/vc_row][vc_row][vc_column width=”2/3″][vc_custom_heading text=”1 hr” use_theme_fonts=”yes”][vc_column_text]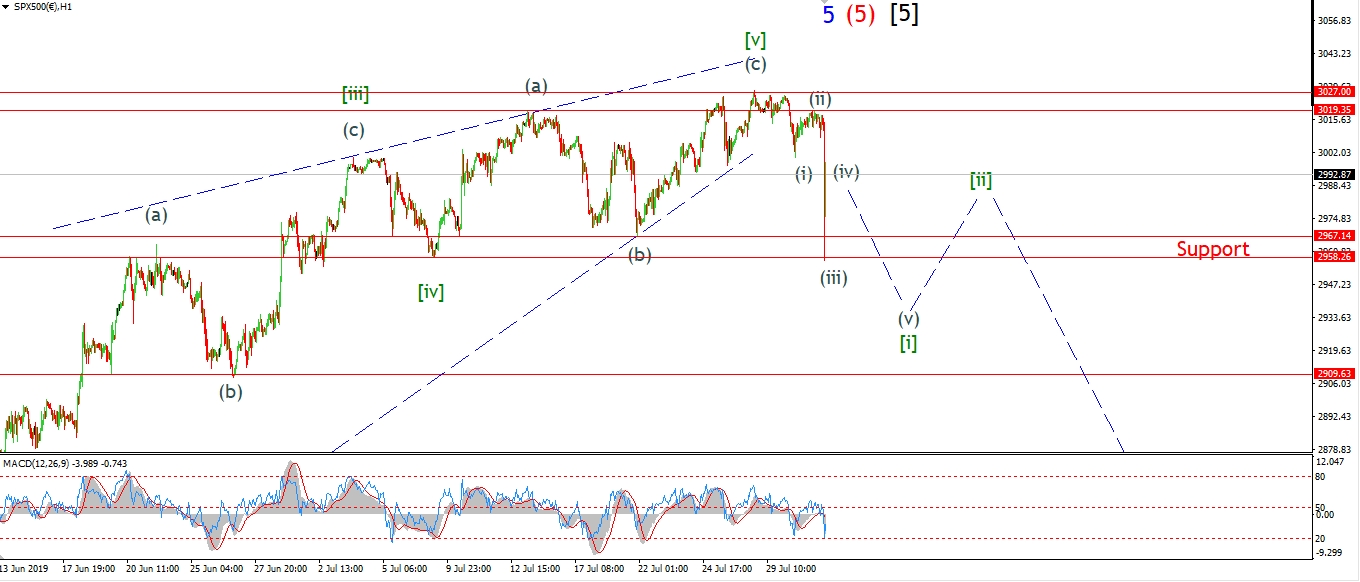 [/vc_column_text][/vc_column][vc_column width=”1/3″][vc_custom_heading text=”4 Hours” use_theme_fonts=”yes”][vc_column_text]
 [/vc_column_text][vc_custom_heading text=”Daily” use_theme_fonts=”yes”][vc_column_text]
 [/vc_column_text][/vc_column][/vc_row]
[vc_row][vc_column][vc_column_text]
Well well well!
The market sold off significantly as I prepared the charts this evening!
The sharp spike lower is viewed as wave (iii) down so far.
But this pattern may change as the bearish pattern builds over the coming days.
Price hit that band of support and has rebounded again off the lows.
This rebound is either wave (iv) of [i],
Which should be followed by another drop in wave (v) tomorrow.
Or,
we will see a series of impulse waves lower build from here.
And this will lead to a larger sell off later next month at a larger degree.
Each of there scenarios is very bearish in the medium term,
but we should be able to follow it fairly closely as it happens.
Tomorrow;
Watch for wave (iv) to hold below 3000 and wave (v) to return lower to break support again.
We are getting close to a clear bearish impulse pattern off the high now!
Next week is going to be very interesting indeed!
[/vc_column_text][/vc_column][/vc_row]
[vc_row][vc_column][vc_separator border_width=”5″][/vc_column][/vc_row]