
Good evening to you folks, and the Lord’s blessings to you all tonight. Heres a new update from John Hussman that is always worth a read.
Counting the Chickens Twice
EURUSD.
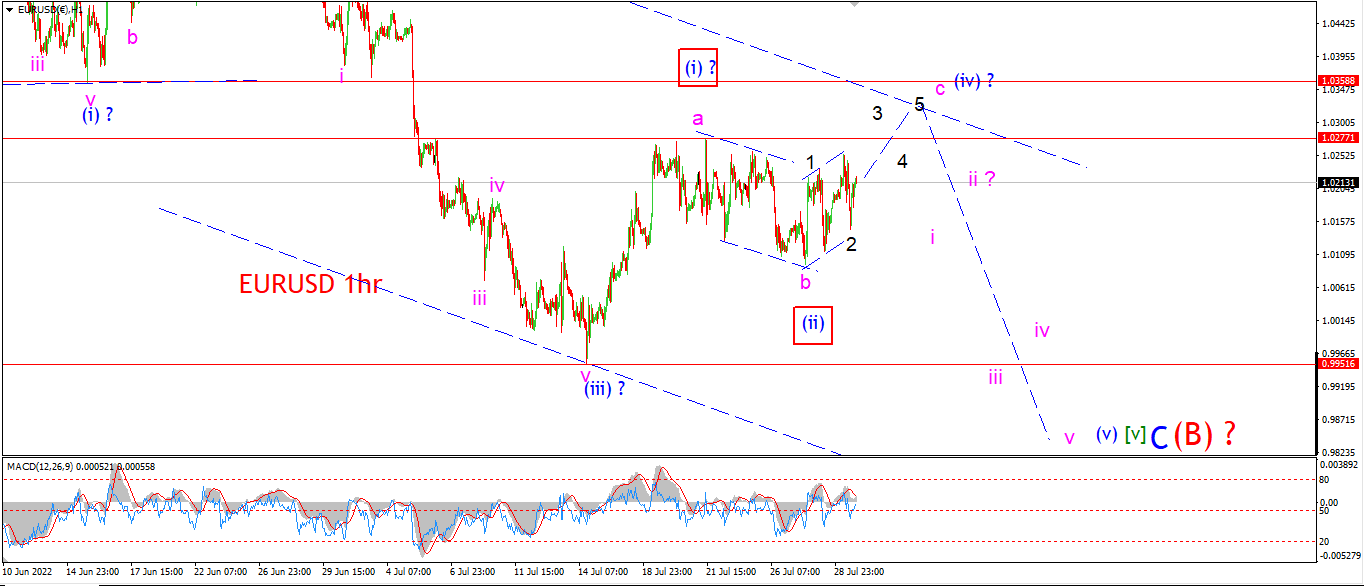
EURUSD 1hr.
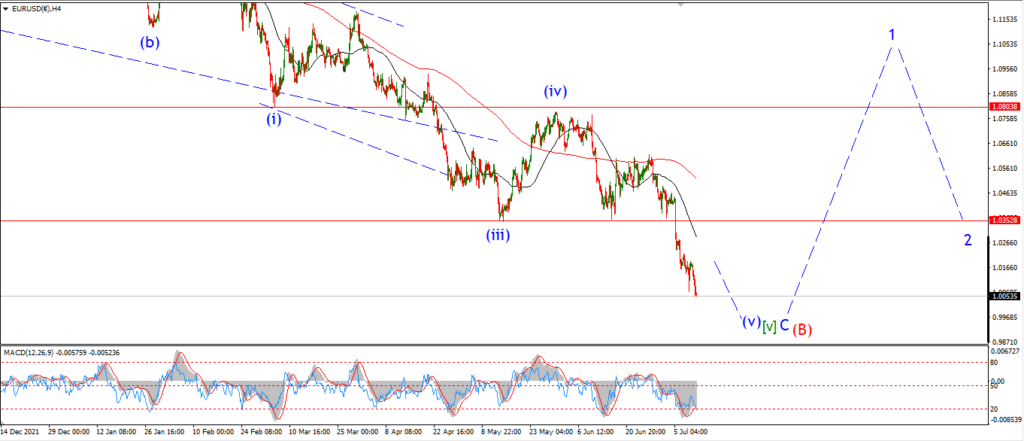
EURUSD 4hr.

EURUSD daily.
The pattern off the wave ‘b’ low is definitely a three wave affair so far.
This could develop further into a five wave pattern to complete wave ‘c’
and because of that I have not ruled out the main count just yet.
But there is a possibility that wave ‘b’ will extend lower in a more complex form over the next few days,
and that is now the main alternate count.
Monday;
Watch for wave ‘c’ of (iv) to complete a rally above 1.0277 but below 1.0358.
A break of the upper level will rule out his pattern for wave (iv).
GBPUSD
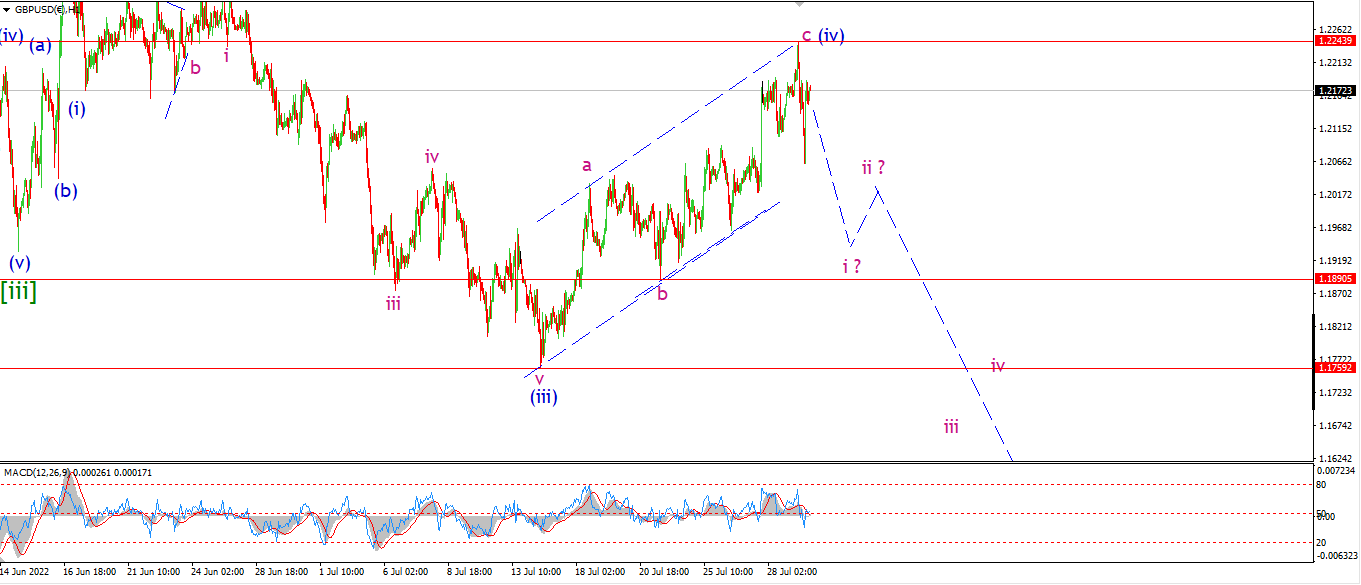
GBPUSD 1hr.
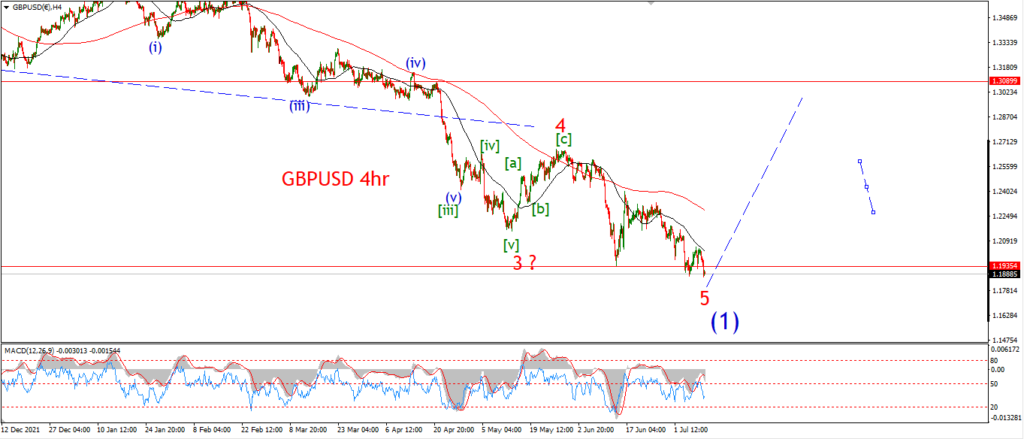
GBPUSD 4hr.

GBPUSD daily.
After tagging the upper trend channel line today cable reversed on a dime and fell quite sharply.
The price is holding at a lower high now below wave (iv).
And this pattern may be a small impulse wave to begin wave ‘i’ down now.
Monday;
Watch for wave ‘i’ of (v) to fall beck to the initial support at 1.1890 again to confirm this pattern.
USDJPY.
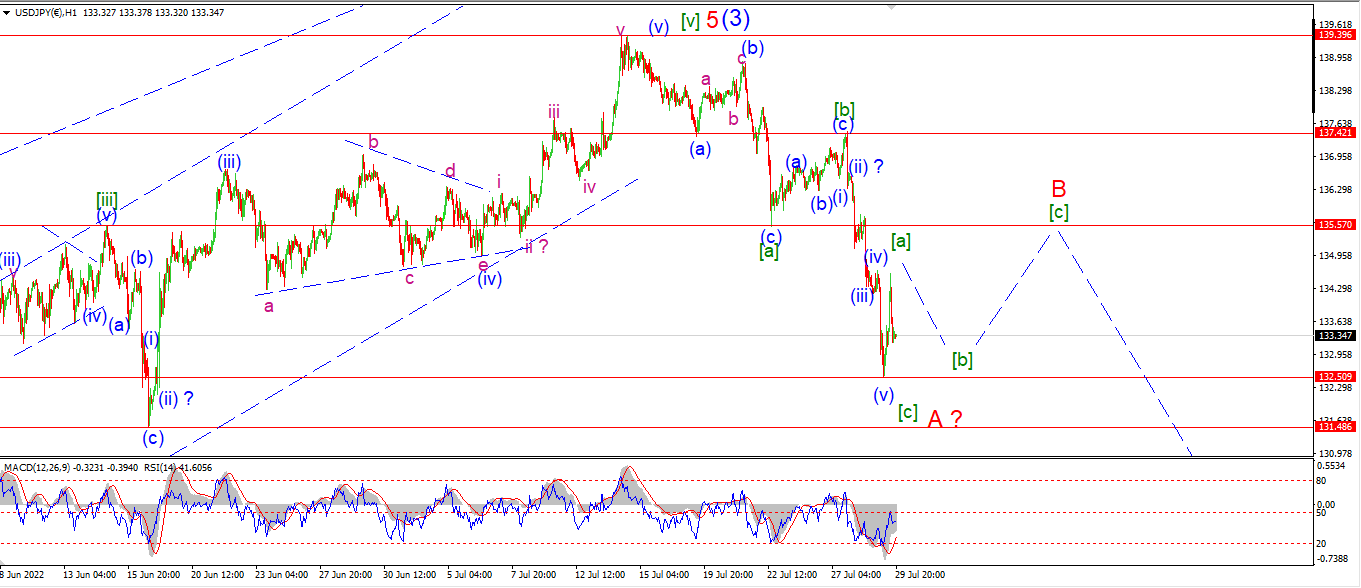
USDJPY 1hr.
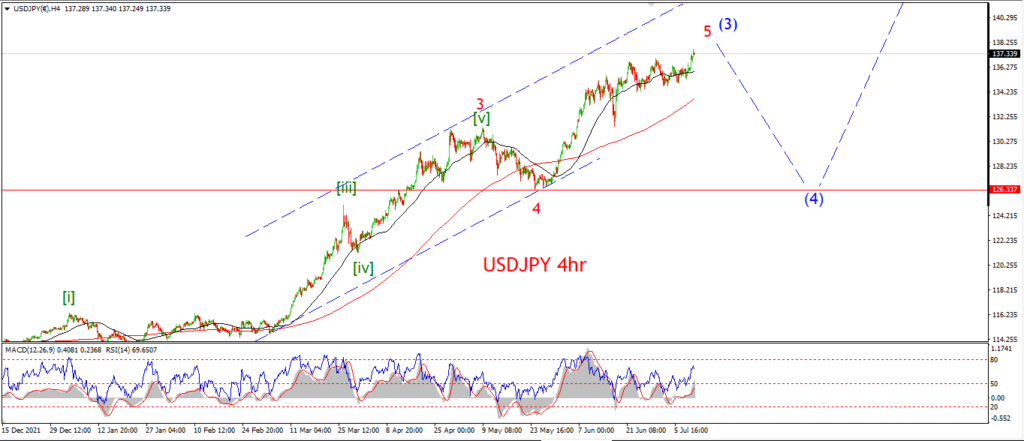
USDJPY 4hr.
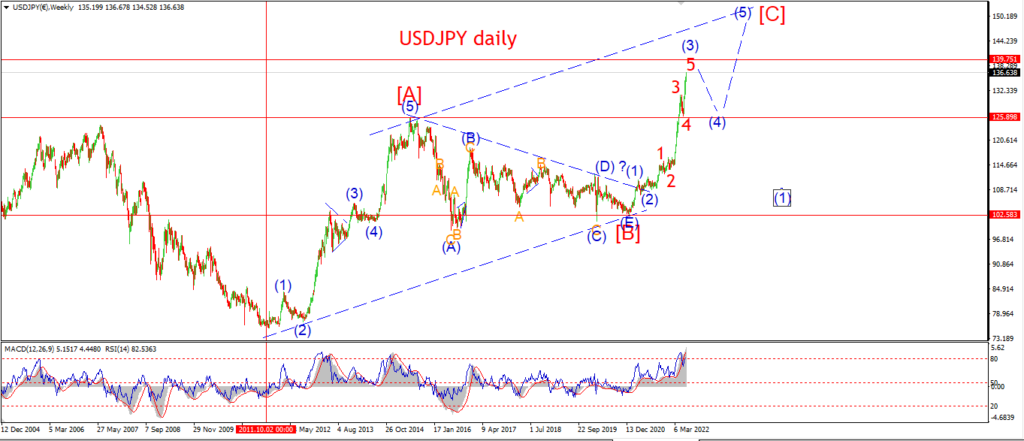
USDJPY daily.
USDJPY managed to reverse higher today and traced out a reasonable spike higher off the 132.50 lows.
I have labelled this initial rally as wave e[a] of ‘B’.
I am not entirely sure that wave ‘A’ if complete here,
but the rise today is enough to at least look for a correction higher in wave ‘B’.
Monday;
The low at 132.50 must hold as wave ‘B’ continues to track higher in three waves/
Watch for wave [b] of ‘B’ to hold above that level on Monday.
DOW JONES.
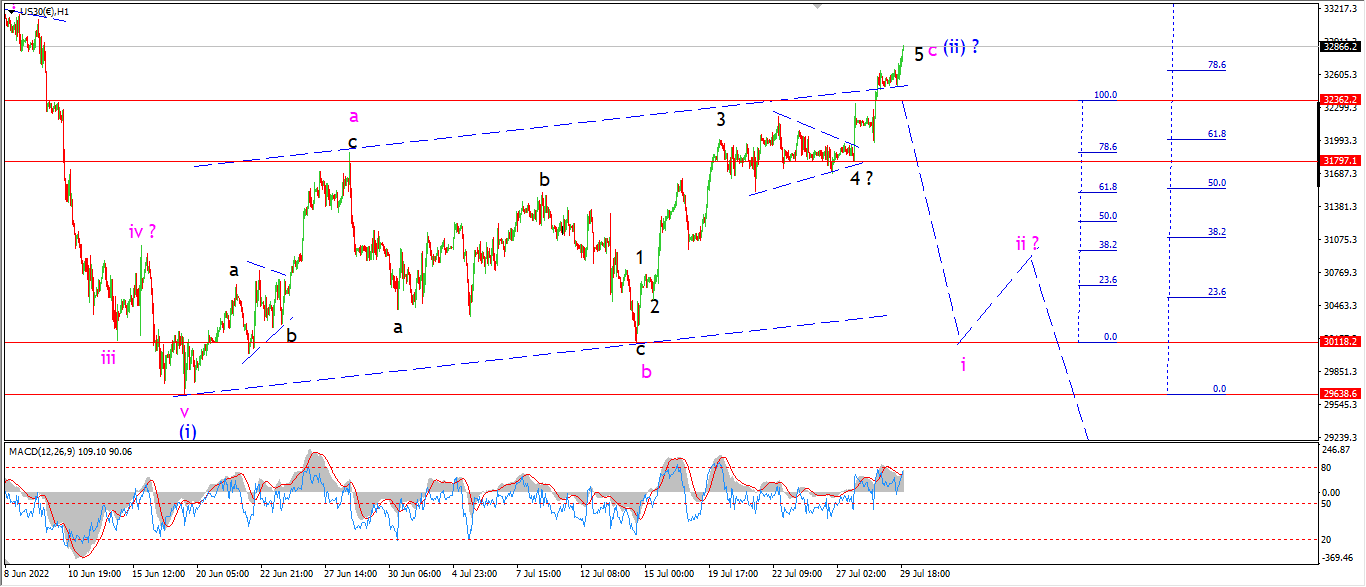
DOW 1hr.
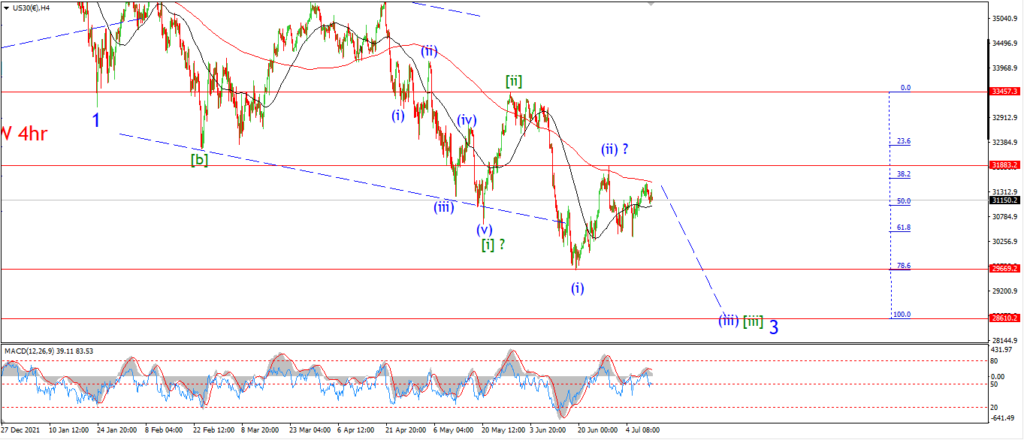
DOW 4hr
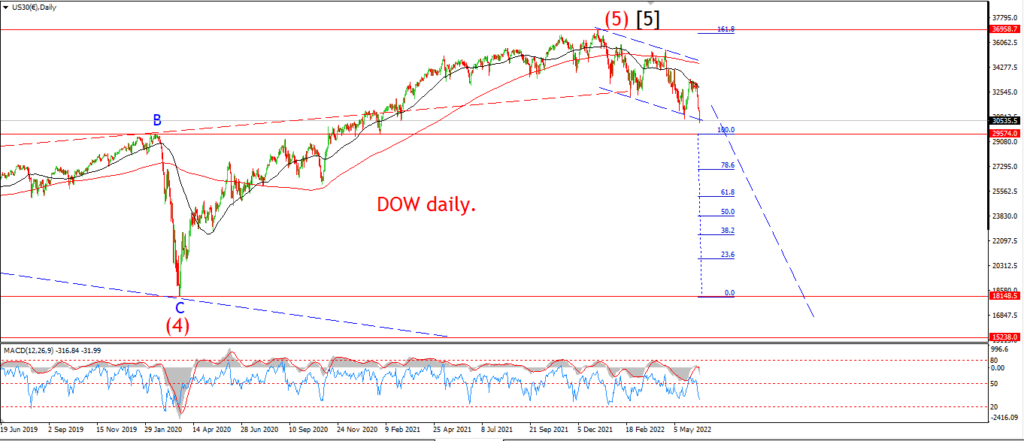
DOW daily.
No reversal today at least,
but the pattern is developing very slowly to the upside now,
which is highlighting the real momentum reversal underway on both the 4hr and the hourly chart.
The action today was less than convincing in terms of a progressing bullish pattern.
It seems very much in line with a correction that is closing out as I maintain.
I have reverted to the triangle wave ‘4’ of ‘c’ this evening.
The slight rise today allows for that shift.
and in fact this triangle is another indication that we are in a terminal phase of the rally.
As we know that triangles only form in either the wave ‘b’ position,
or the wave ‘4’ position.
That fact qualifies this rally as a fifth wave top out in wave ‘c’.
So I do fully expect the trend to change back into wave ‘i’ of (iii) next week.
Monday;
Watch for wave ‘c’ to top and reverse with a sharp spike to begin wave ‘i’ down.
The triangle low at 31800 gives us a signal level that wave ‘i’ has begun.
So watch for a break of that level to lead to a wave ‘i’ decline early next week.
GOLD
GOLD 1hr.
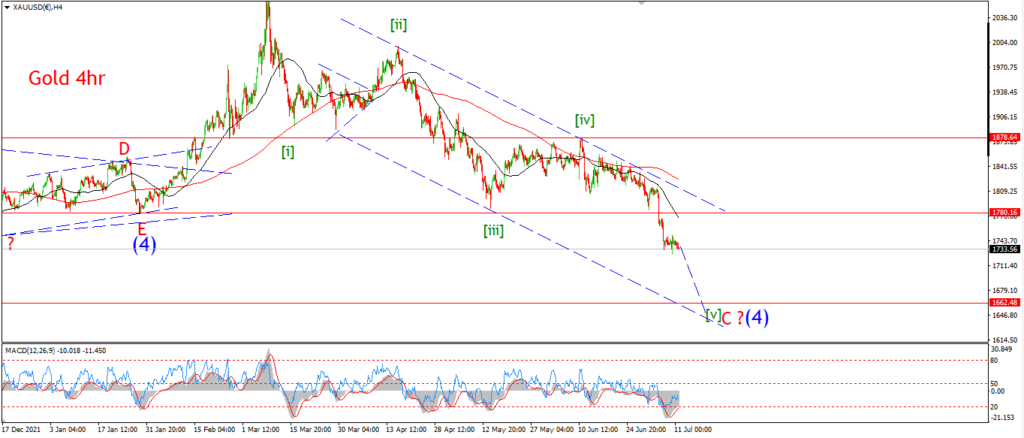
GOLD 4hr.
GOLD daily.
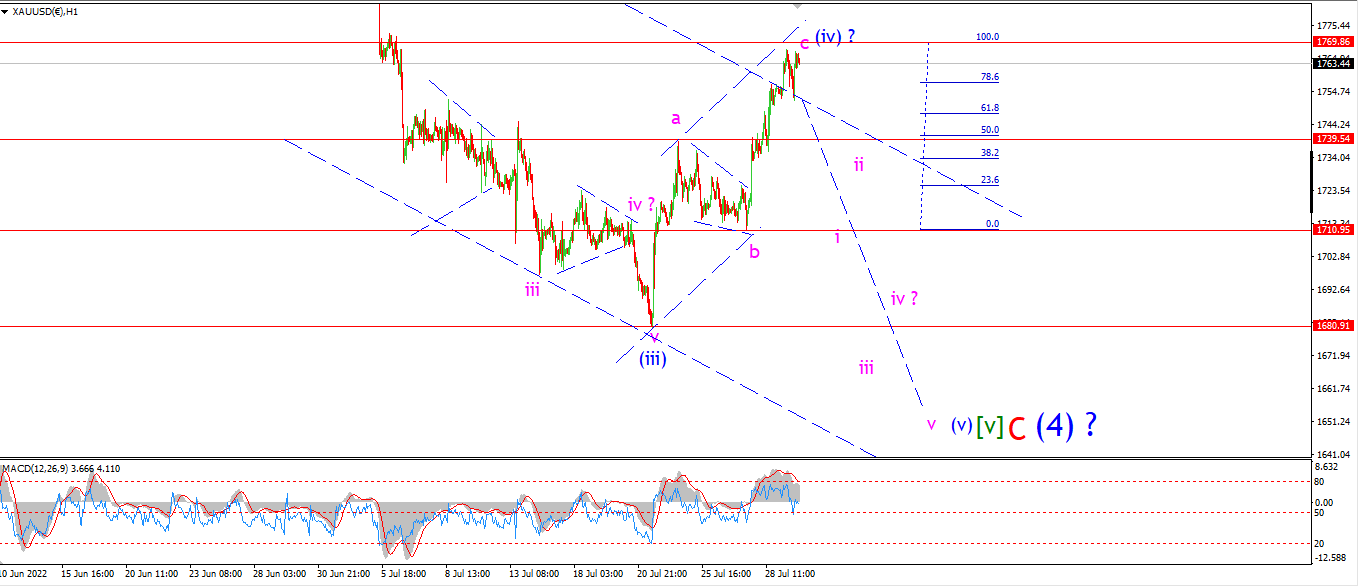
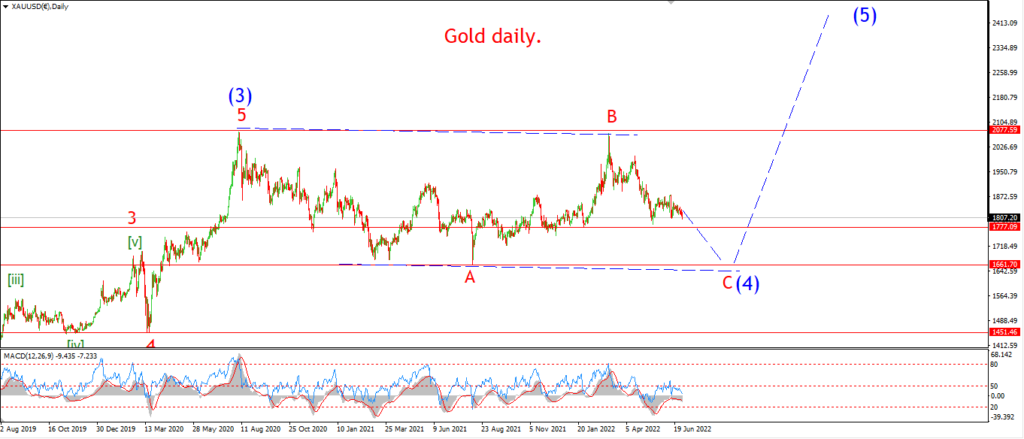
Gold is holding a very slight lower high this evening.
I am not convinced that wave (iv) has topped out after todays action though.
And It seems I will have to wait for next weeks trade to confirm wave (v) of [v] has begun.
I am looking at that wave ‘b’ low at 1710 to signal that wave ‘i’ is underway.
That is quite a drop from here I know,
but if the stock market turns lower next week,
I will suggest that the gold price will take a hit also.
I am not dogmatic about a new low in gold,
but a three wave rally off the low is a giveaway in my book.
And the larger pattern does require one last low to complete the picture perfectly.
Tomorrow;
Watch for wave ‘i’ of (v) to fall back into that 1710 area again.
CRUDE OIL.
CRUDE OIL 1hr.
CRUDE OIL 4hr.
CRUDE OIL daily.
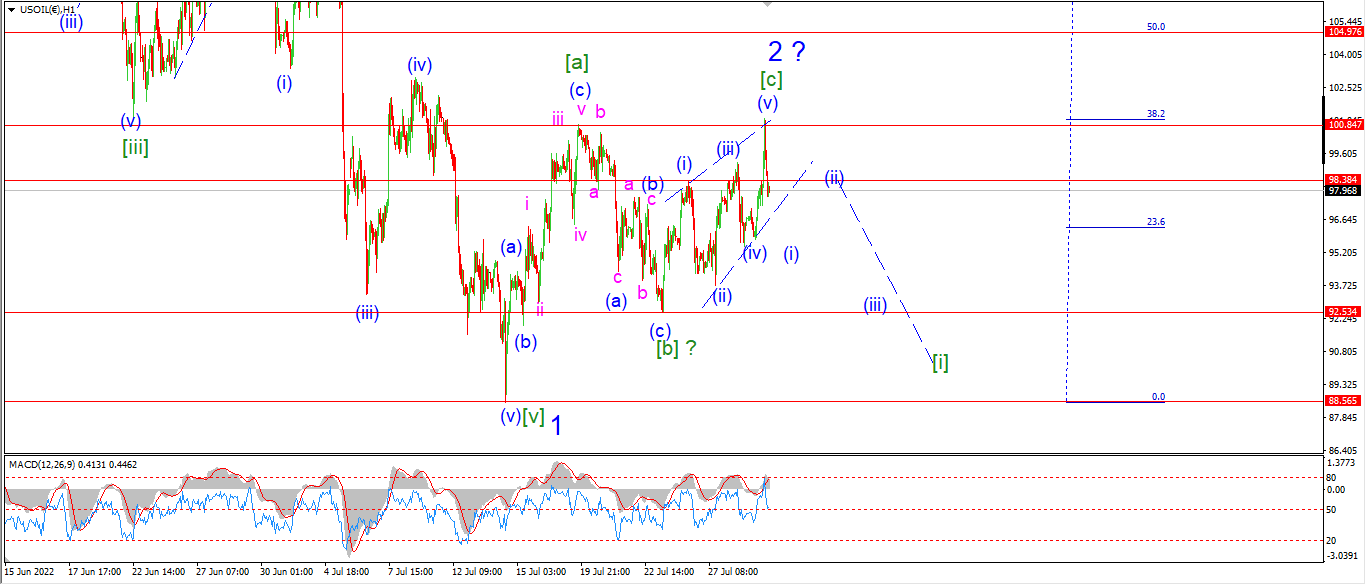
The action in crude today is more like a top in wave [c] than I expected.
And with that sharp decline,
the market ruled out most of the counts I had in mind in the short term.
Thats markets for ya!
The price did make a very slight new high above wave [a] this afternoon,
and with that we hit the minimum target for wave [c].
The fact that the price reversed quite quickly off that high is a signal that we have a possible top playing out here.
Monday;
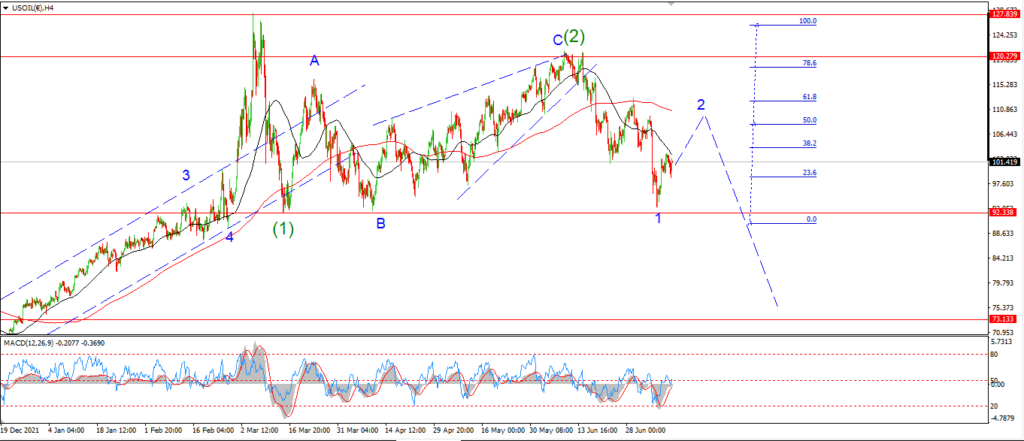
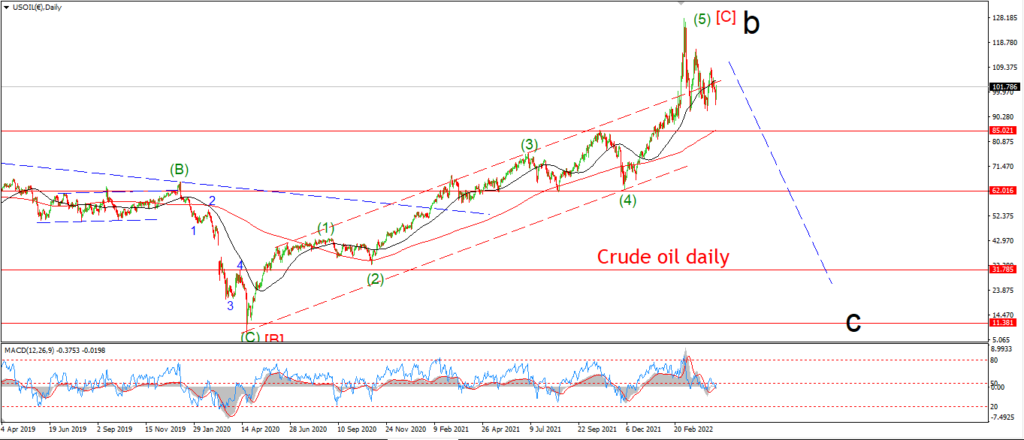
I have shown an ending diagonal pattern for wave [c] now as the main count.
So lets see if we get some follow through to the downside to complete wave [i] of ‘3’ as shown.
The high at wave ‘2’ today must hold for this pattern to remain valid.
S&P 500.
S&P 500 1hr
S&P 500 4hr
S&P 500 daily.
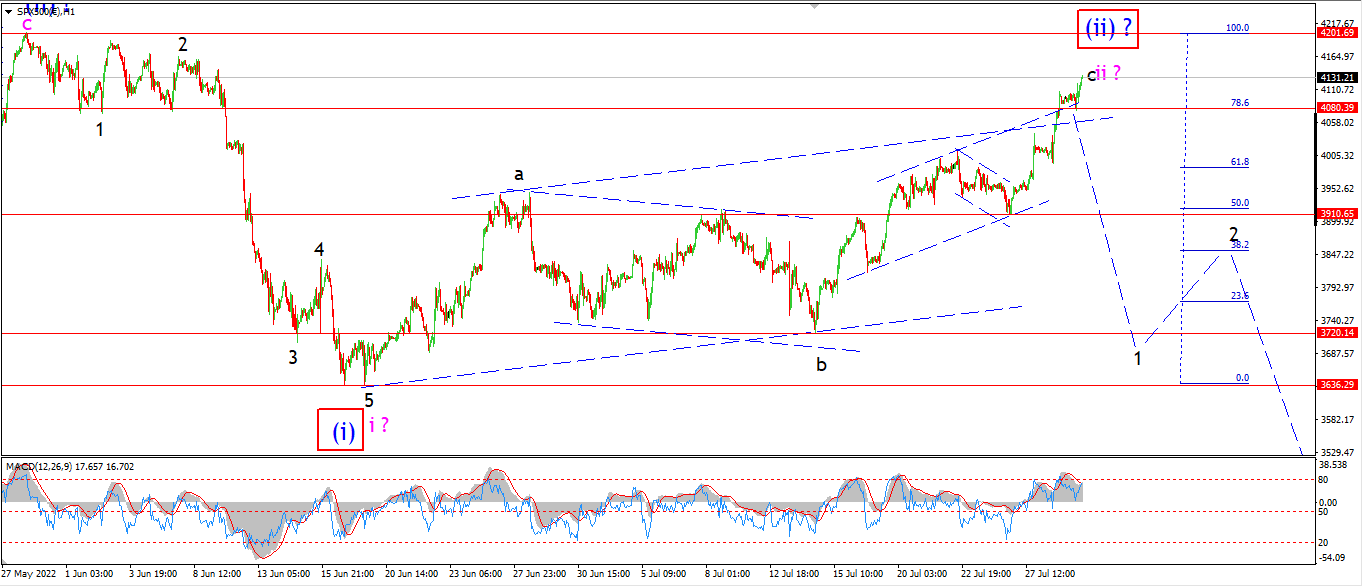
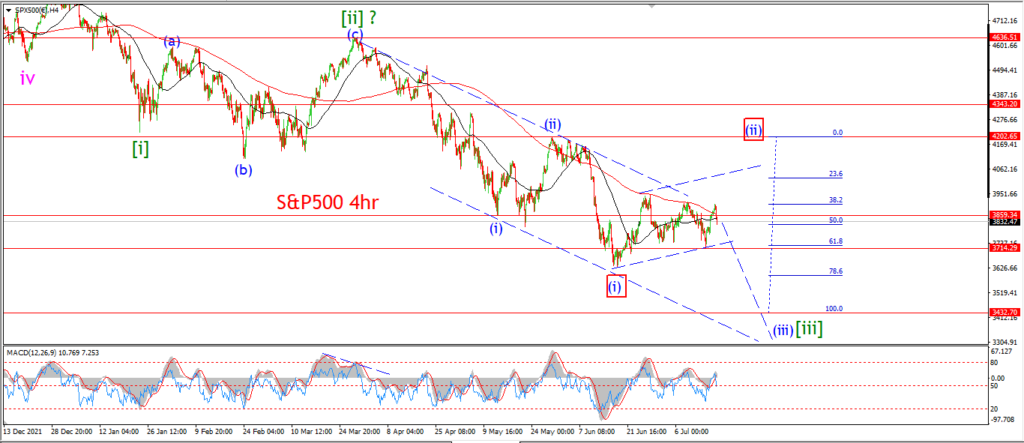
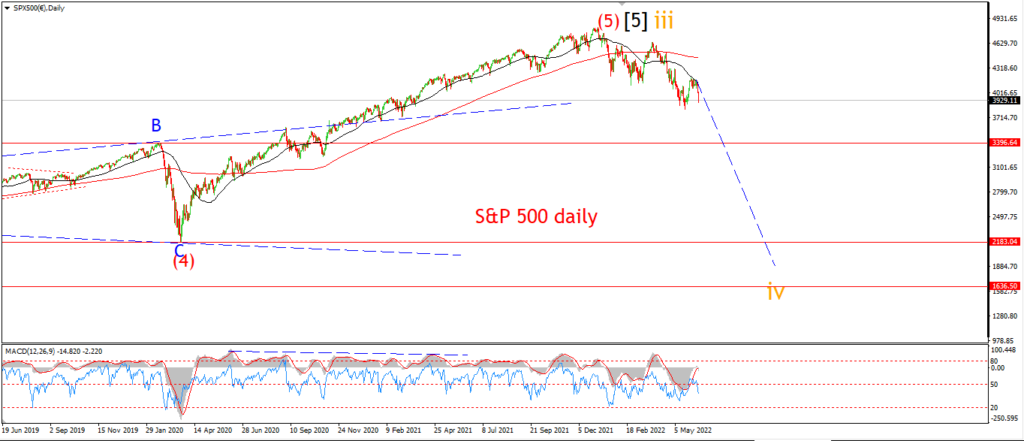
The S&P is creeping higher also today and as the price draws ever closer to that 4200 high again,
the alternate count for wave (ii) looks more viable as a result.
A break of 4200 again will trigger that alternate count.
But even that does not change my outlook here.
I am sticking with the idea that wave ‘ii’ will complete below 4200 as my main count here.
That level may well be enough to resist any further rise on Monday,
and cause this pattern to reverse again.
Monday;
In both wave counts I am looking for a reversal to begin next week.
Wave ‘1’ of ‘iii’ should fall back below 3720 at a minimum.
A break of 3910 again will be the initial signal that wave ‘1’ is underway.
SILVER.
SILVER 1hr
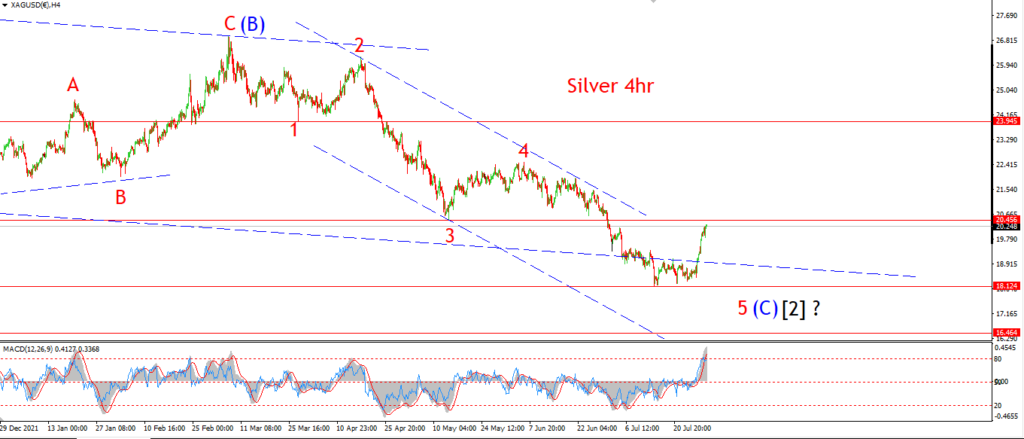
SILVER 4hr.
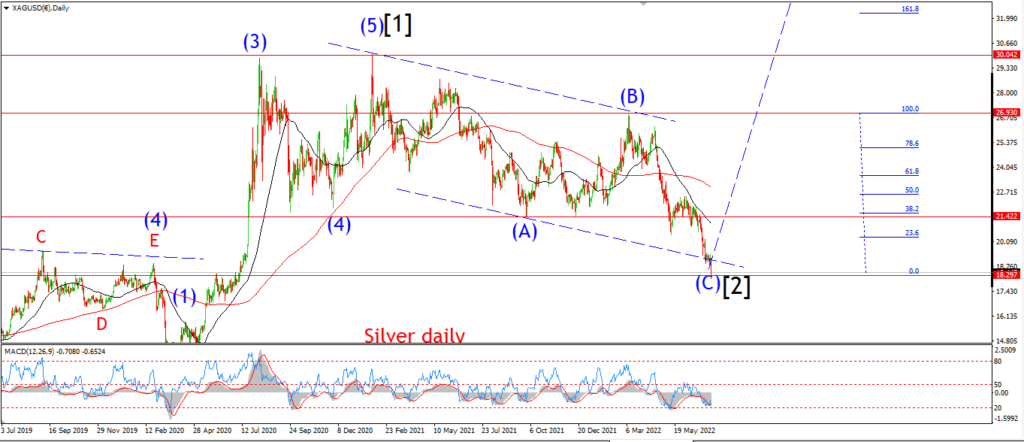
SILVER daily.
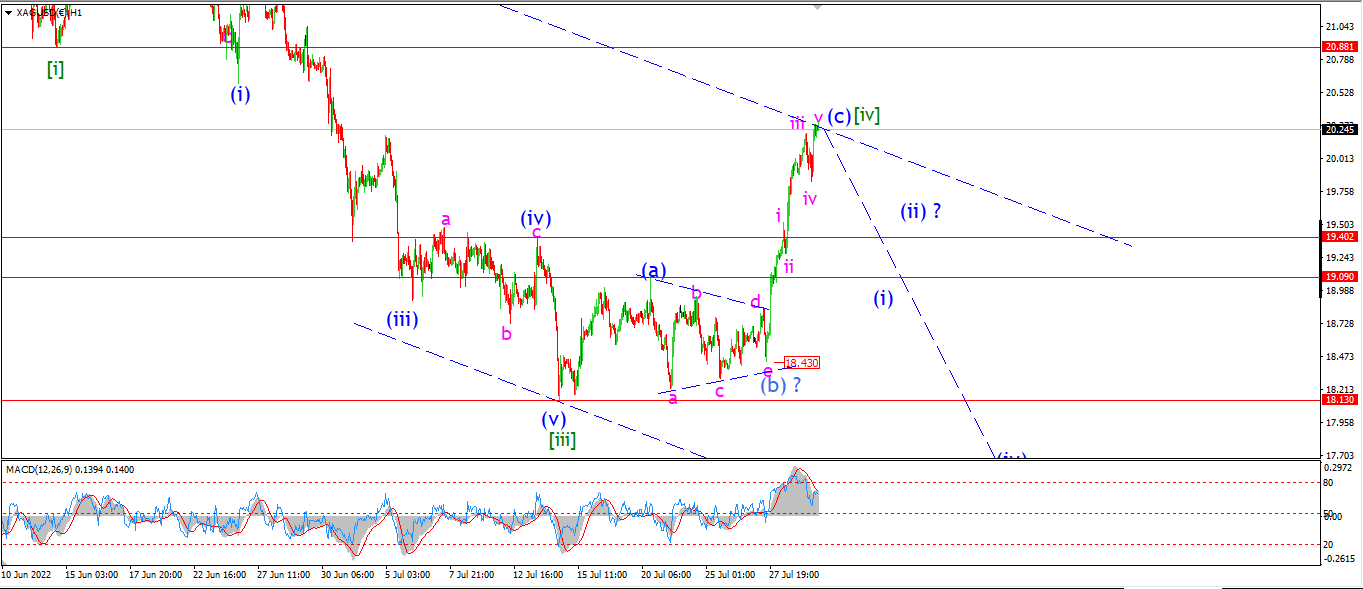
The extension higher in wave (c) may be convincing enough to many that we have seen the low for silver,
but I am looking at that 4hr chart and I do not think the pattern is satisfied just yet.
I may be convinced next week,
if we see a bullish higher low build above 18.13.
But right now,
I suspect wave [v] of ‘5’ has one more low to make before fulfilling the larger picture here.
Monday;
A five wave rally to complete above 20.88 again will confirm a low is in place for silver,
but at the moment I am looking for wave [v] down to turn lower and take out 18.13 again and fulfill the larger wave count.
BITCOIN
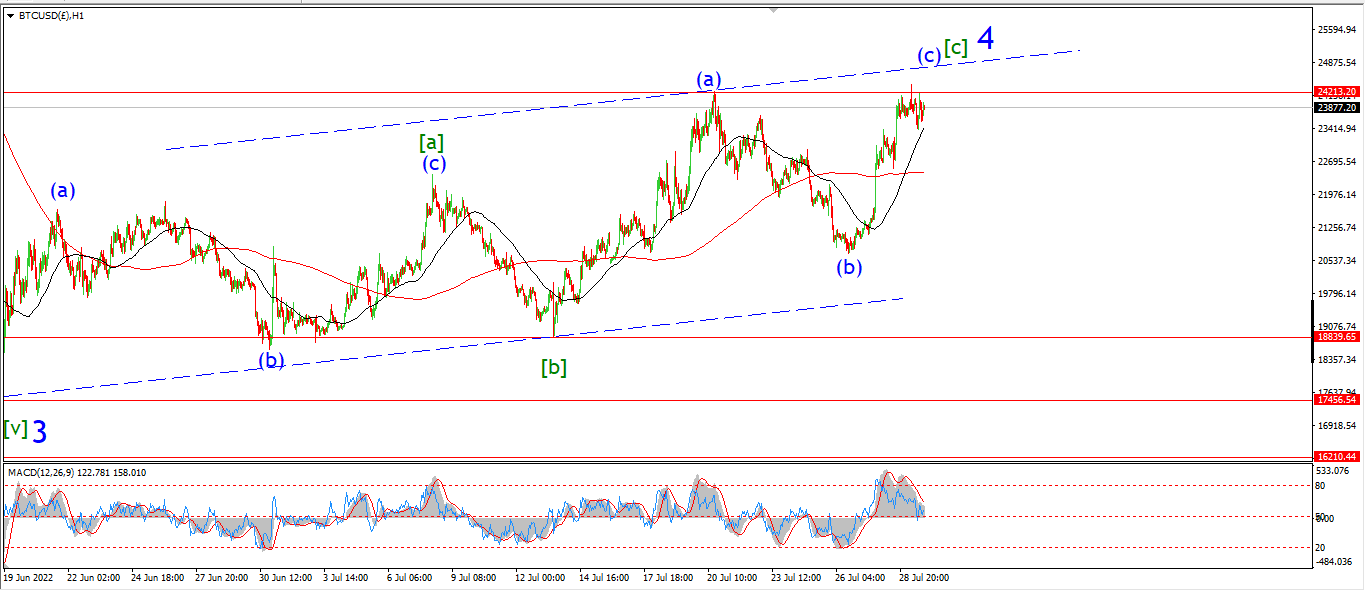
BITCOIN 1hr.
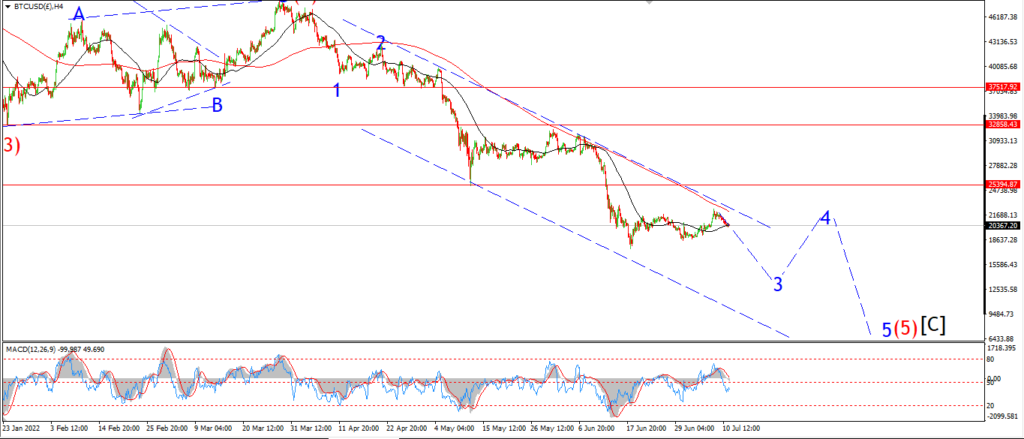
BITCOIN 4hr.

BITCOIN daily.
….
FTSE 100.
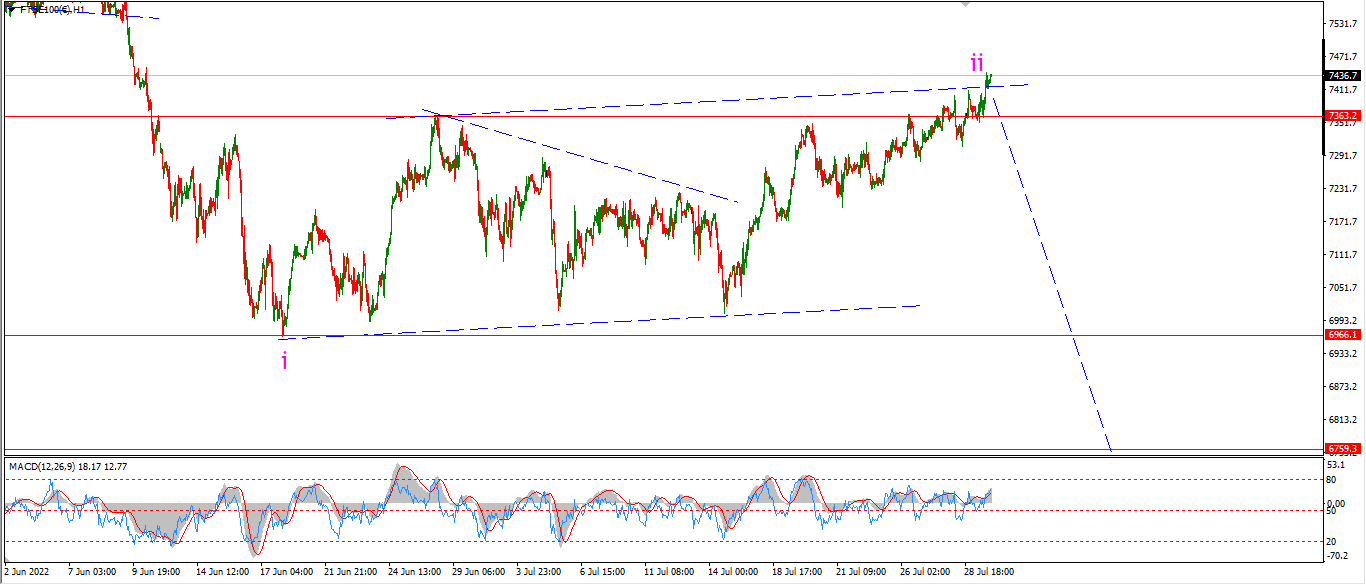
FTSE 100 1hr.
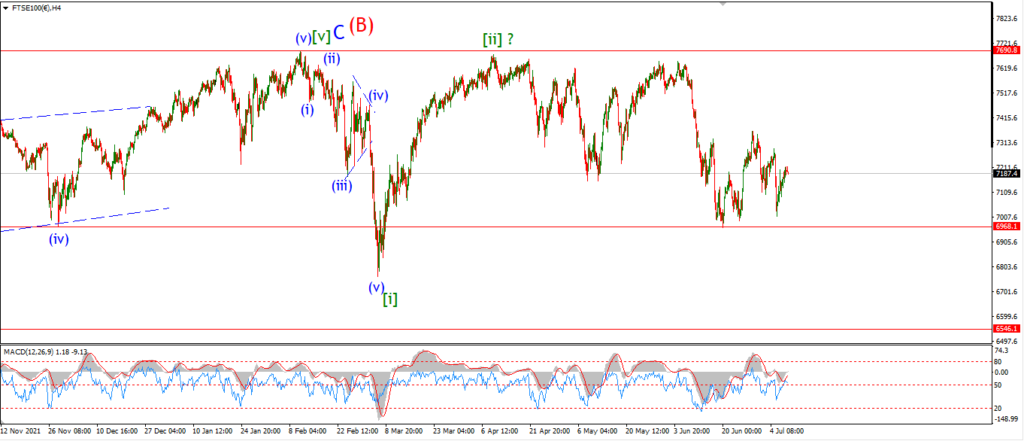
FTSE 100 4hr.

FTSE 100 daily.
….
DAX.
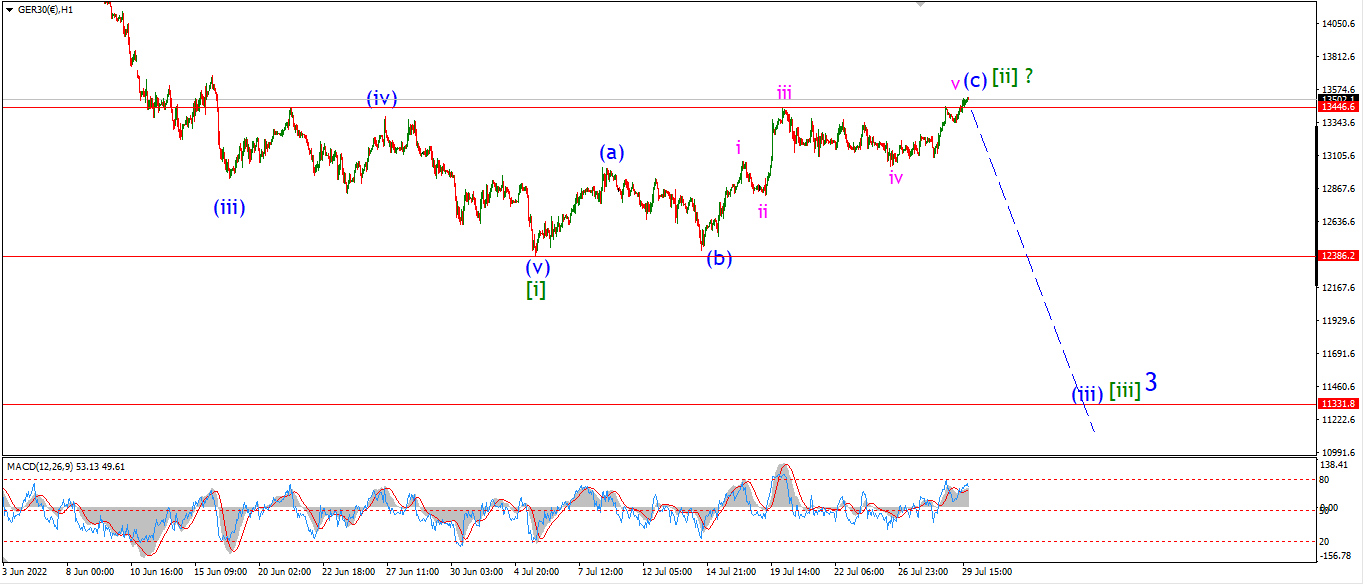
DAX 1hr
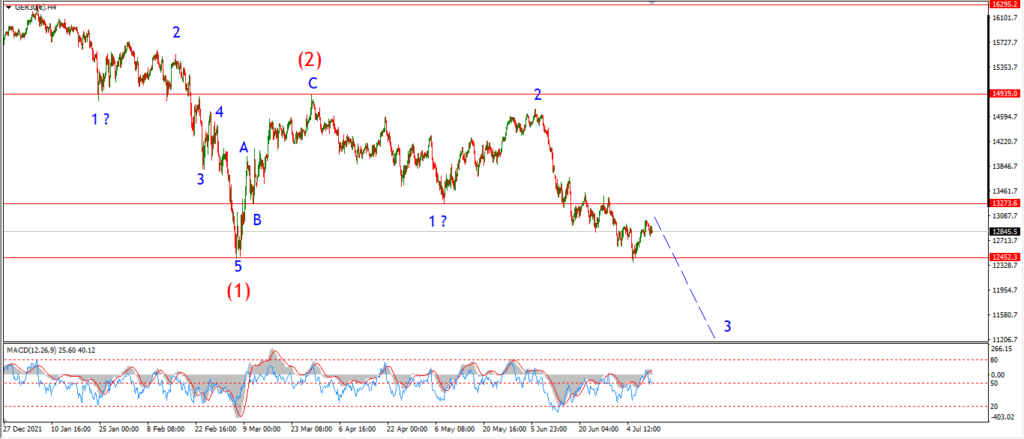
DAX 4hr

DAX daily.
….
NASDAQ 100.
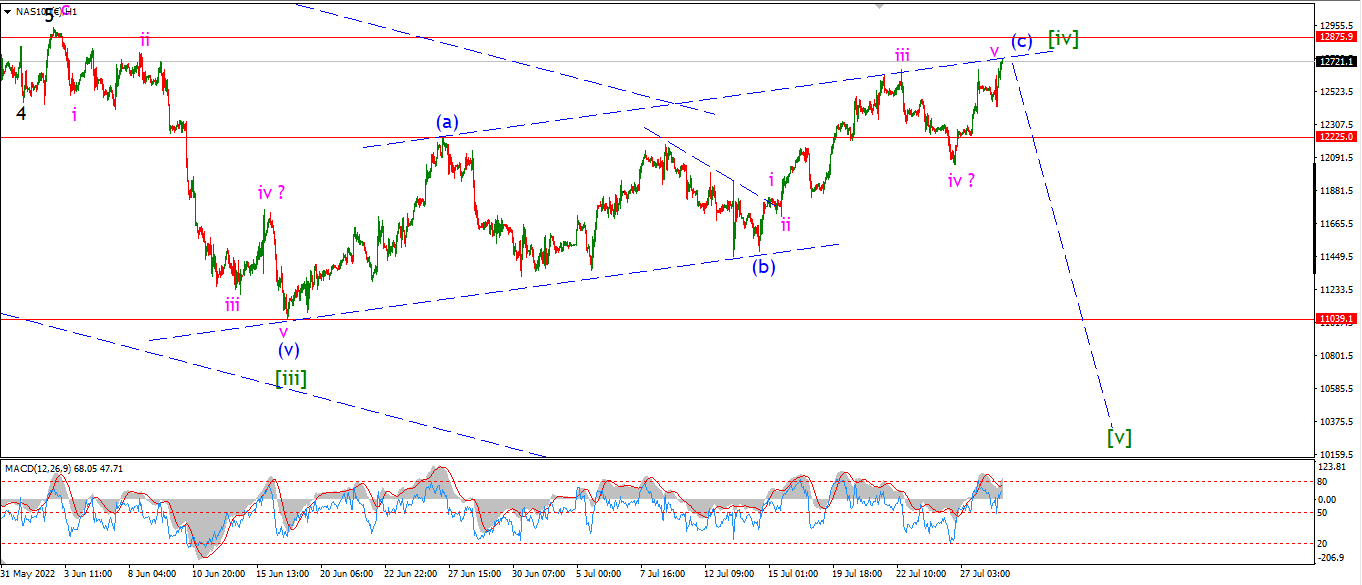
NASDAQ 1hr
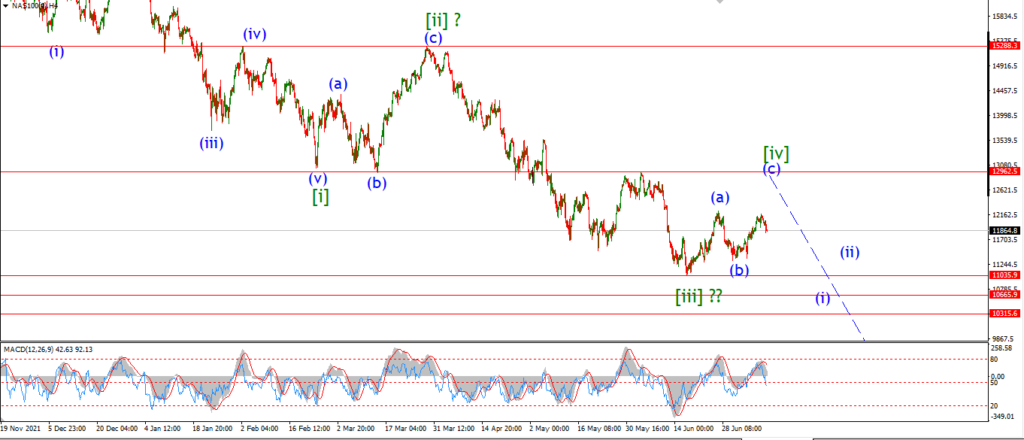
NASDAQ 4hr.
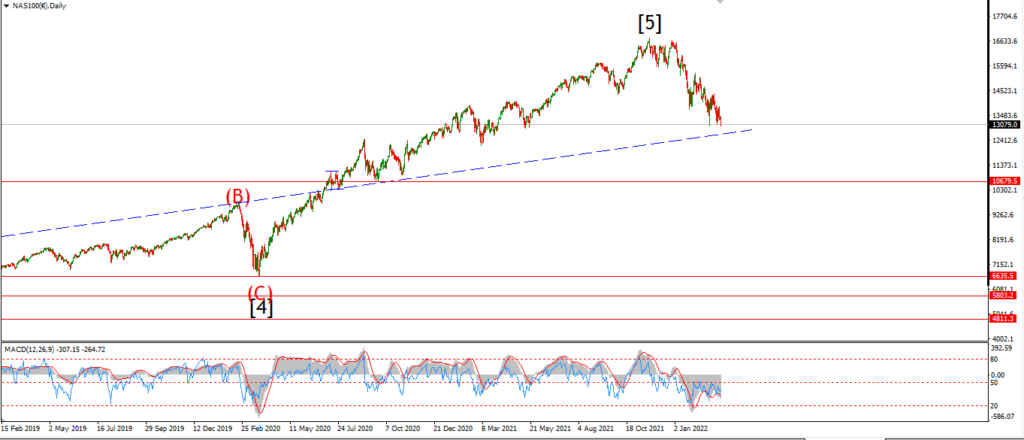
NASDAQ daily.
….