
[vc_row][vc_column][vc_separator border_width=”5″][/vc_column][/vc_row]
[vc_row][vc_column][vc_column_text]
Good evening all.
Here the latest in a line of charts that are ‘documenting the top of the bubble’ in real time!
[/vc_column_text][/vc_column][/vc_row]
[vc_row][vc_column][vc_separator border_width=”5″][/vc_column][/vc_row]
[vc_row][vc_column][vc_column_text]
EURUSD
[/vc_column_text][/vc_column][/vc_row]
[vc_row][vc_column][vc_separator border_width=”5″][/vc_column][/vc_row][vc_row][vc_column width=”2/3″][vc_custom_heading text=”1 hr” use_theme_fonts=”yes”][vc_column_text]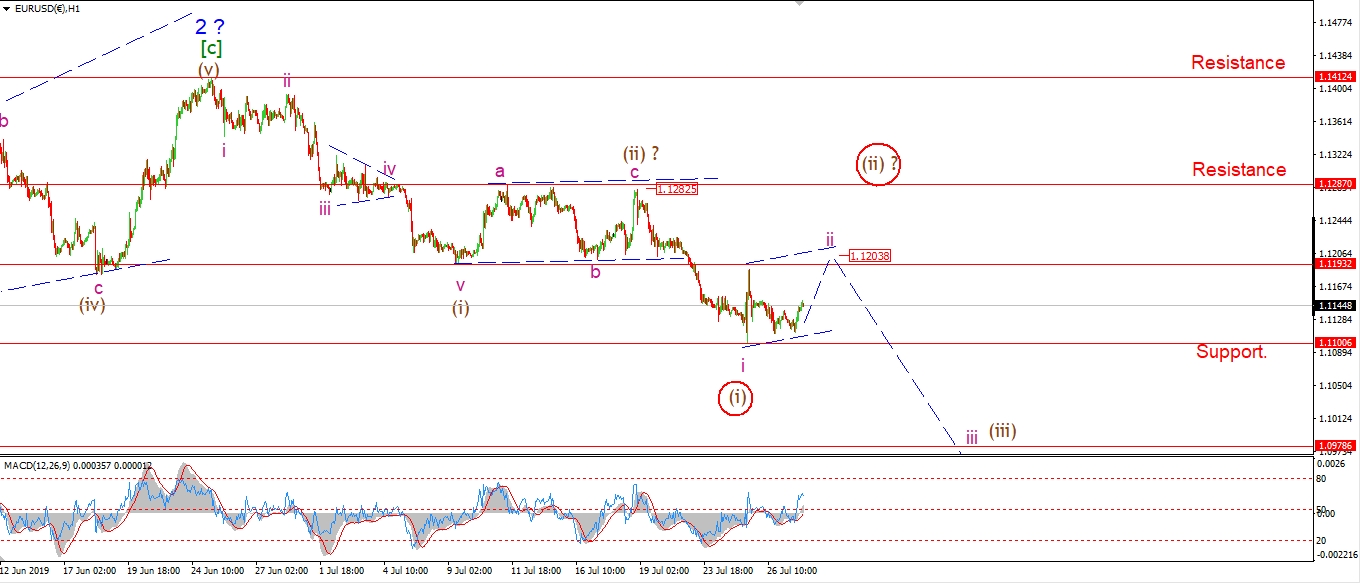 [/vc_column_text][/vc_column][vc_column width=”1/3″][vc_custom_heading text=”4 Hours” use_theme_fonts=”yes”][vc_column_text]
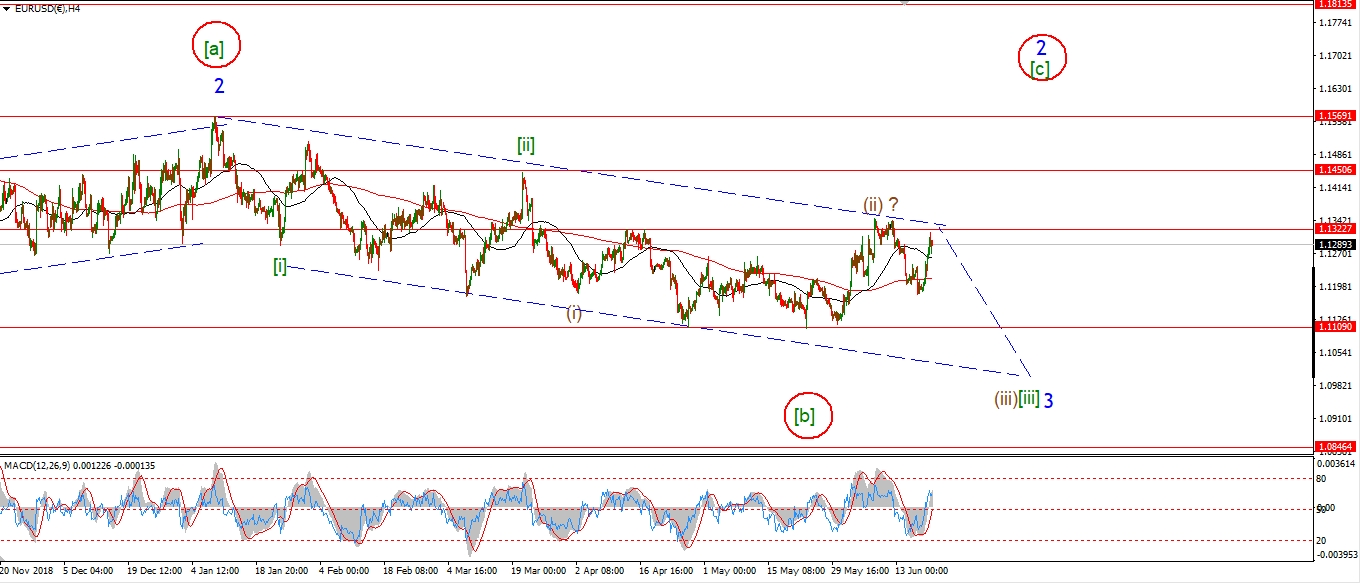 [/vc_column_text][vc_custom_heading text=”Daily” use_theme_fonts=”yes”][vc_column_text]
 [/vc_column_text][/vc_column][/vc_row]
[vc_row][vc_column][vc_column_text]
EURUSD is slowly moving higher off Fridays low.
This low came after a three wave fall and is viewed as a minor ‘b’ wave within wave ‘ii’.
Todays rise should prove to be wave ‘c’ of ‘ii’
and should continue higher to above 1.1200 to complete a three wave correction in wave ‘ii’.
After this correction is over,
we will be ready to fall again in wave ‘iii’ of (iii).
Tomorrow;
Watch for wave ‘ii’ to complete within the trend channel as shown.
A break of 1.1100 again will signal that wave ‘iii’ down has begun.
[/vc_column_text][/vc_column][/vc_row]
[vc_row][vc_column][vc_separator border_width=”5″][/vc_column][/vc_row][vc_row][vc_column][vc_column_text]
GBPUSD
[/vc_column_text][/vc_column][/vc_row][vc_row][vc_column][vc_separator border_width=”5″][/vc_column][/vc_row][vc_row][vc_column width=”2/3″][vc_custom_heading text=”1 hr” use_theme_fonts=”yes”][vc_column_text]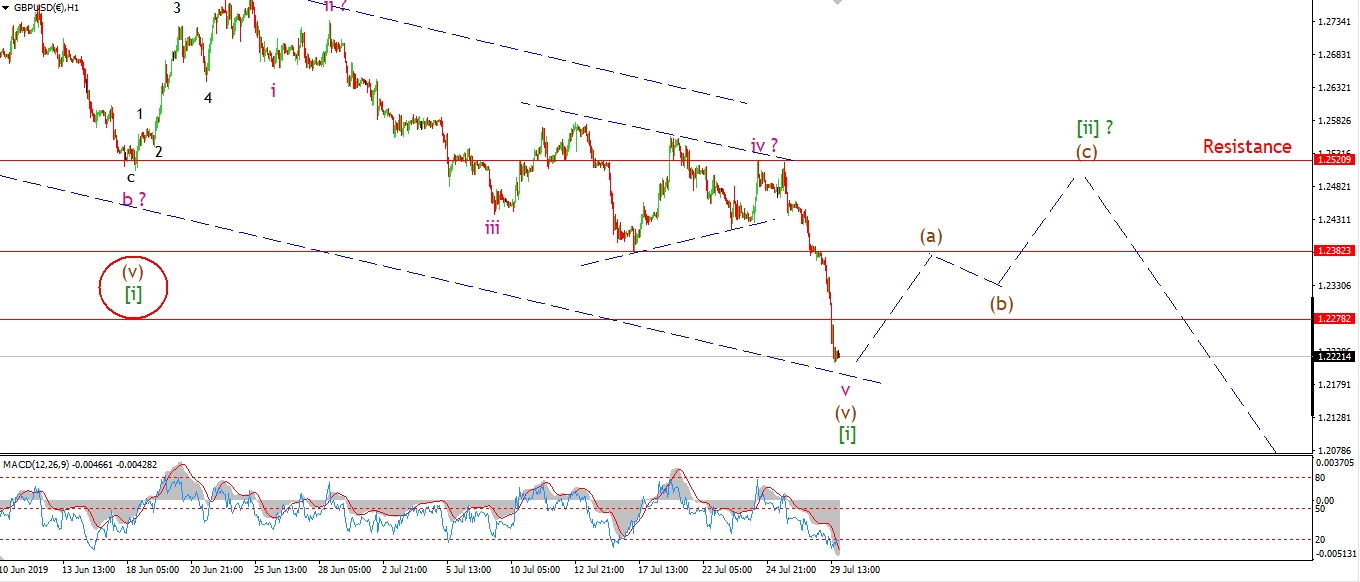 [/vc_column_text][/vc_column][vc_column width=”1/3″][vc_custom_heading text=”4 Hours” use_theme_fonts=”yes”][vc_column_text]
 [/vc_column_text][vc_custom_heading text=”Daily” use_theme_fonts=”yes”][vc_column_text]
 [/vc_column_text][/vc_column][/vc_row]
[vc_row][vc_column][vc_column_text]
The sharp move lower in cable today has ruled out the previous wave count for a correction higher in wave [ii].
I do expect the longer term down trend to resume eventually in wave [iii].
But firstly,
the price structure needs a corrective rally to take place in wave [ii],
and this will setup for the longer term decline to resume in wave [iii].
Todays decline seems to be a thrust from a triangle wave ‘iv’.
And this suggests wave ‘v’ is now completing.
If this is correct,
then we should see a correction higher in wave [ii] begin this week.
The outlook is surely hit a bearish extreme now
which should be enough to warrant a reaction.
Tomorrow;
A rally back above 1.2380 will signal wave [ii] has begun.
[/vc_column_text][/vc_column][/vc_row]
[vc_row][vc_column][vc_separator border_width=”5″][/vc_column][/vc_row][vc_row][vc_column][vc_column_text]
USDJPY
[/vc_column_text][/vc_column][/vc_row][vc_row][vc_column][vc_separator border_width=”5″][/vc_column][/vc_row][vc_row][vc_column width=”2/3″][vc_custom_heading text=”1 hr” use_theme_fonts=”yes”][vc_column_text]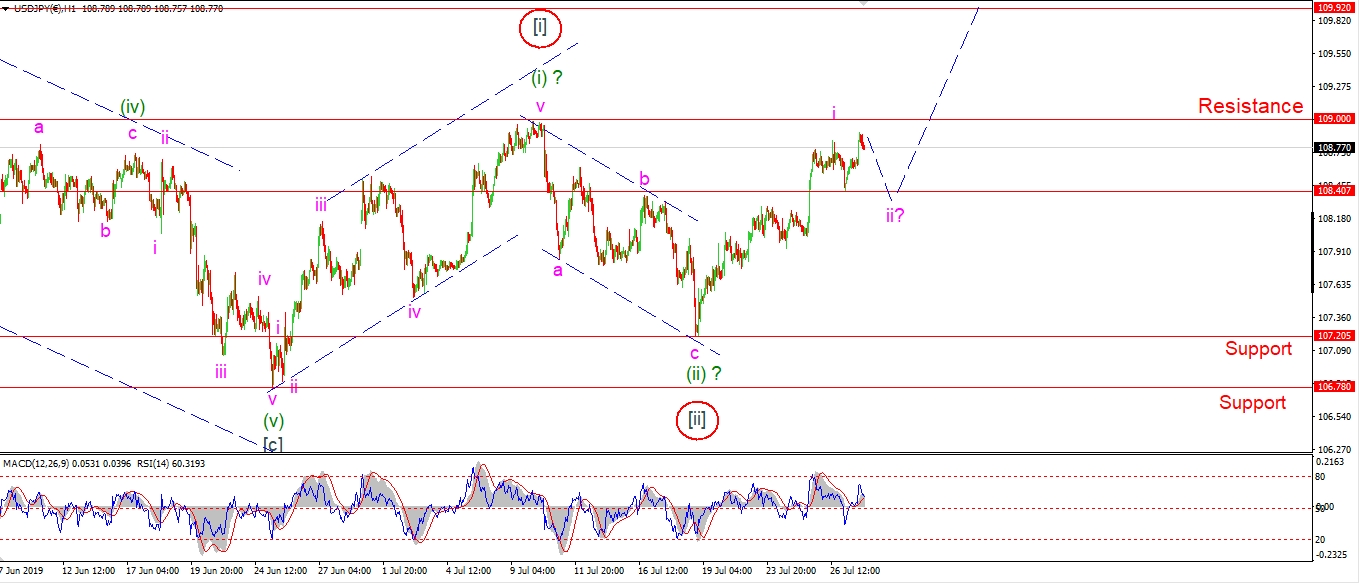 [/vc_column_text][/vc_column][vc_column width=”1/3″][vc_custom_heading text=”4 Hours” use_theme_fonts=”yes”][vc_column_text]
 [/vc_column_text][vc_custom_heading text=”Daily” use_theme_fonts=”yes”][vc_column_text]
 [/vc_column_text][/vc_column][/vc_row]
[vc_row][vc_column][vc_column_text]
USDJPY is higher today off the overnight low.
But the rise so far is in three waves which suggests a corrective recovery in wave ‘ii’.
The slight new high above Fridays high,
means that wave ‘ii’ should now trace out an expanded flat.
And then fall back below 108.40 to complete.
This should happen tomorrow.
At that point we will have a bullish signal in place in USDJPY,
and we should expect a rally in wave (iii) to begin soon.
I have also shown a reasonable alternate which views the rally so far at one degree higher.
Tomorrow;
Watch for wave ‘ii’ to complete at or above 108.00.
Wave ‘iii’ up should begin this week.
[/vc_column_text][/vc_column][/vc_row]
[vc_row][vc_column][vc_separator border_width=”5″][/vc_column][/vc_row][vc_row][vc_column][vc_column_text]
DOW JONES INDUSTRIALS
[/vc_column_text][/vc_column][/vc_row][vc_row][vc_column][vc_separator border_width=”5″][/vc_column][/vc_row][vc_row][vc_column width=”2/3″][vc_custom_heading text=”1 hr” use_theme_fonts=”yes”][vc_column_text]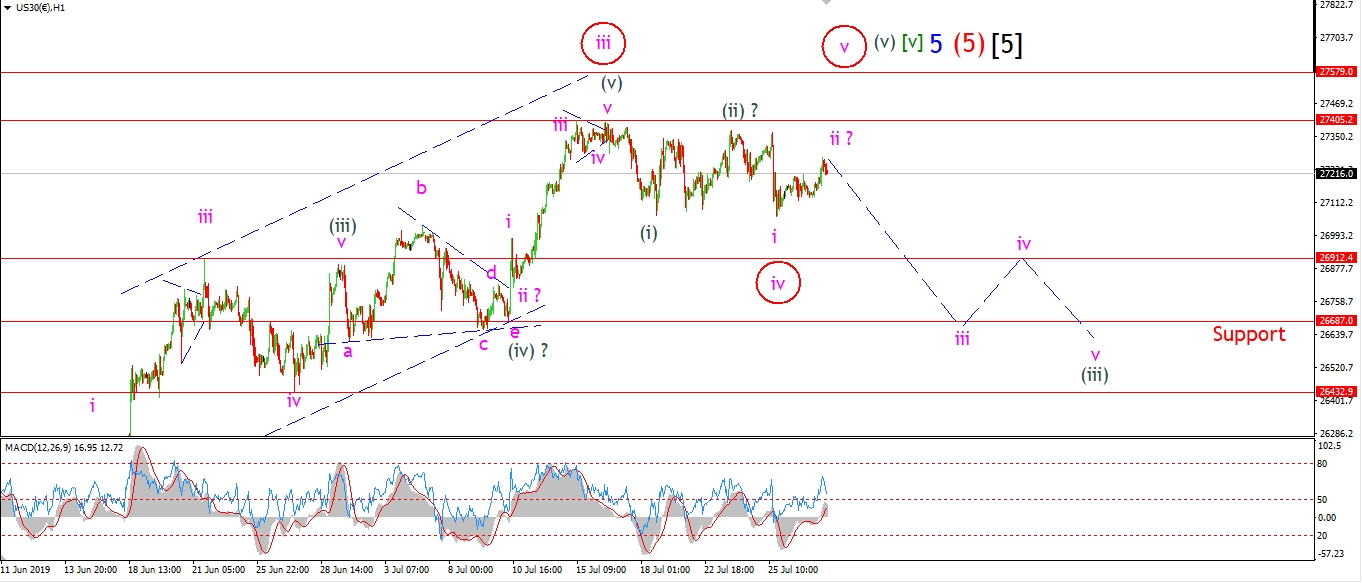 [/vc_column_text][/vc_column][vc_column width=”1/3″][vc_custom_heading text=”4 Hours” use_theme_fonts=”yes”][vc_column_text]
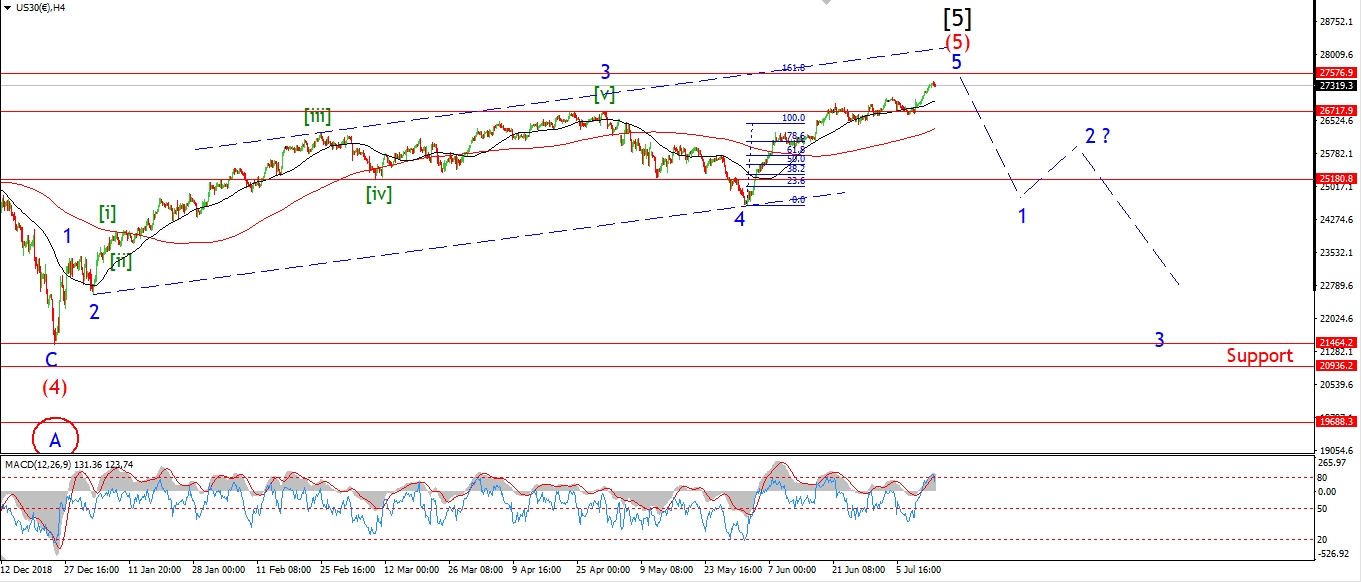 [/vc_column_text][vc_custom_heading text=”Daily” use_theme_fonts=”yes”][vc_column_text]
 [/vc_column_text][/vc_column][/vc_row]
[vc_row][vc_column][vc_column_text]
The Dow has rallied in three waves today.
If this pattern does not develop any further from here.
Then we have a correction to another lower high in place at the high of the session.
And that action suggests a new decline is about to begin in a third wave this week.
I have altered the wave count to show a series of 1,2 waves off the high.
Todays correction is viewed as wave ‘ii’ of (iii).
And wave ‘iii’ of (iii) to the downside is set to carry price lower for the rest of the week.
Tomorrow;
watch for last weeks high at wave (ii) to hold and wave (iii) down to get underway with a break of 27000 again.
The alternate count is still a possibility,
but a break of 27000 will rule it out.
[/vc_column_text][/vc_column][/vc_row]
[vc_row][vc_column][vc_separator border_width=”5″][/vc_column][/vc_row][vc_row][vc_column][vc_column_text]
GOLD
[/vc_column_text][/vc_column][/vc_row][vc_row][vc_column][vc_separator border_width=”5″][/vc_column][/vc_row][vc_row][vc_column width=”2/3″][vc_custom_heading text=”1 hr” use_theme_fonts=”yes”][vc_column_text]
 [/vc_column_text][/vc_column][vc_column width=”1/3″][vc_custom_heading text=”4 Hours” use_theme_fonts=”yes”][vc_column_text]
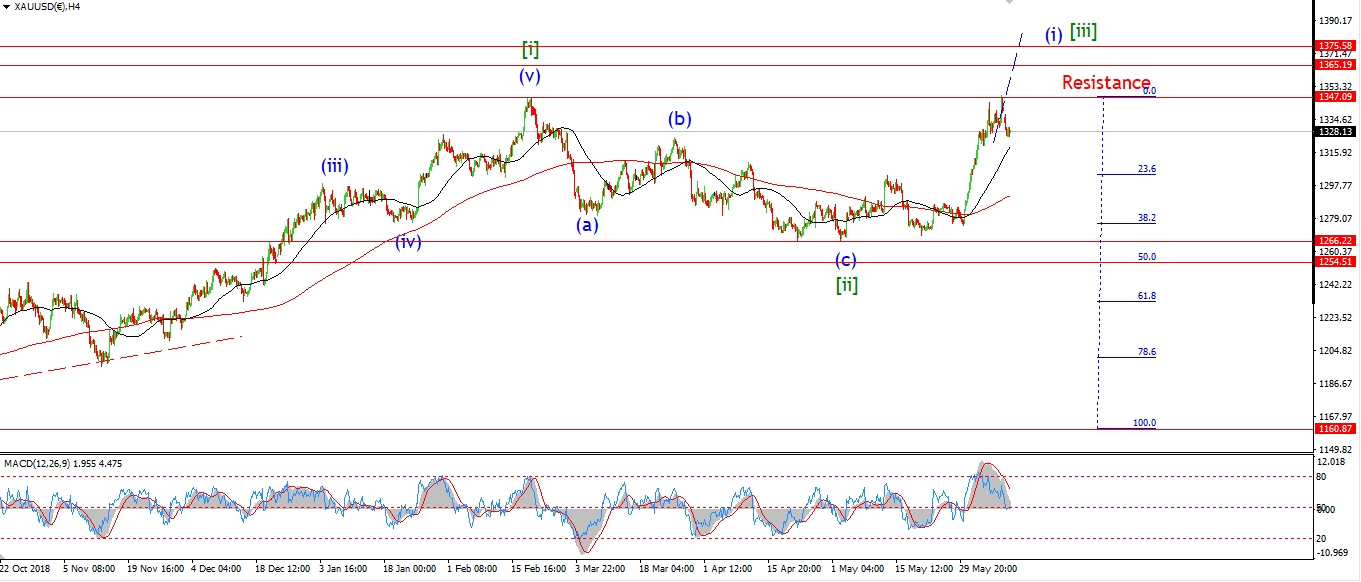 [/vc_column_text][vc_custom_heading text=”Daily” use_theme_fonts=”yes”][vc_column_text]
 [/vc_column_text][/vc_column][/vc_row]
[vc_row][vc_column][vc_column_text]
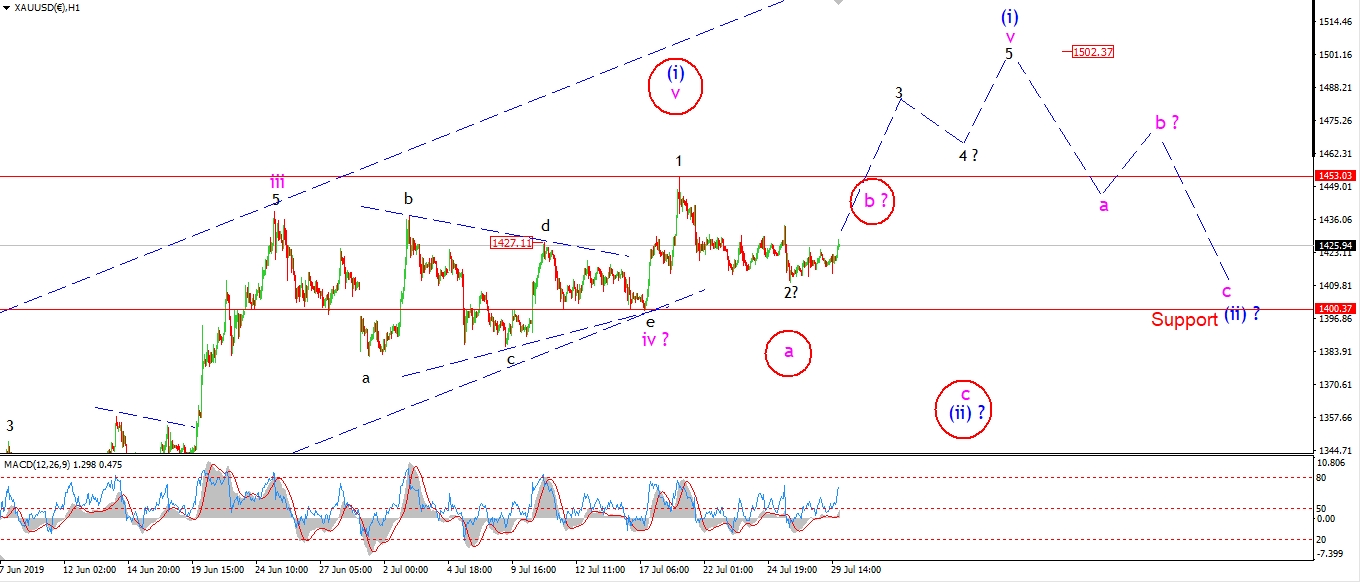
Gold is rising slightly this evening after another pretty flat trade.
The low at wave ‘2’ is holding so far,
but I do want to see a sharp rally above 1453 by Wednesday,
to confirm the current count for wave ‘v’ of (i).
The alternate count is fleshed out a little this evening.
Todays rise can be viewed as wave ‘b’ of (ii) as shown.
Although a break of 1453 will reduce the probability of this count.
Tomorrow;
Watch for wave ‘3’ of ‘v’ to continue above 1453.
1400 must hold for the bullish count to remain valid.
[/vc_column_text][/vc_column][/vc_row]
[vc_row][vc_column][vc_separator border_width=”5″][/vc_column][/vc_row][vc_row][vc_column][vc_column_text]
U.S CRUDE OIL
[/vc_column_text][/vc_column][/vc_row][vc_row][vc_column][vc_separator border_width=”5″][/vc_column][/vc_row][vc_row][vc_column width=”2/3″][vc_custom_heading text=”1 hr” use_theme_fonts=”yes”][vc_column_text]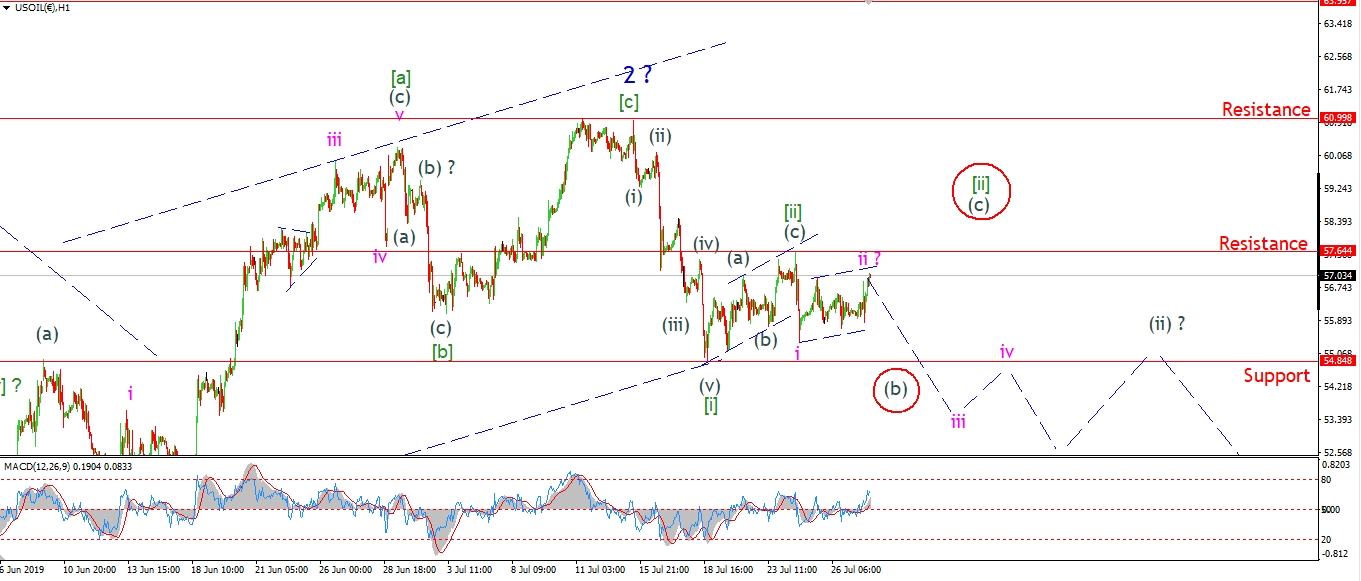 [/vc_column_text][/vc_column][vc_column width=”1/3″][vc_custom_heading text=”4 Hours” use_theme_fonts=”yes”][vc_column_text]
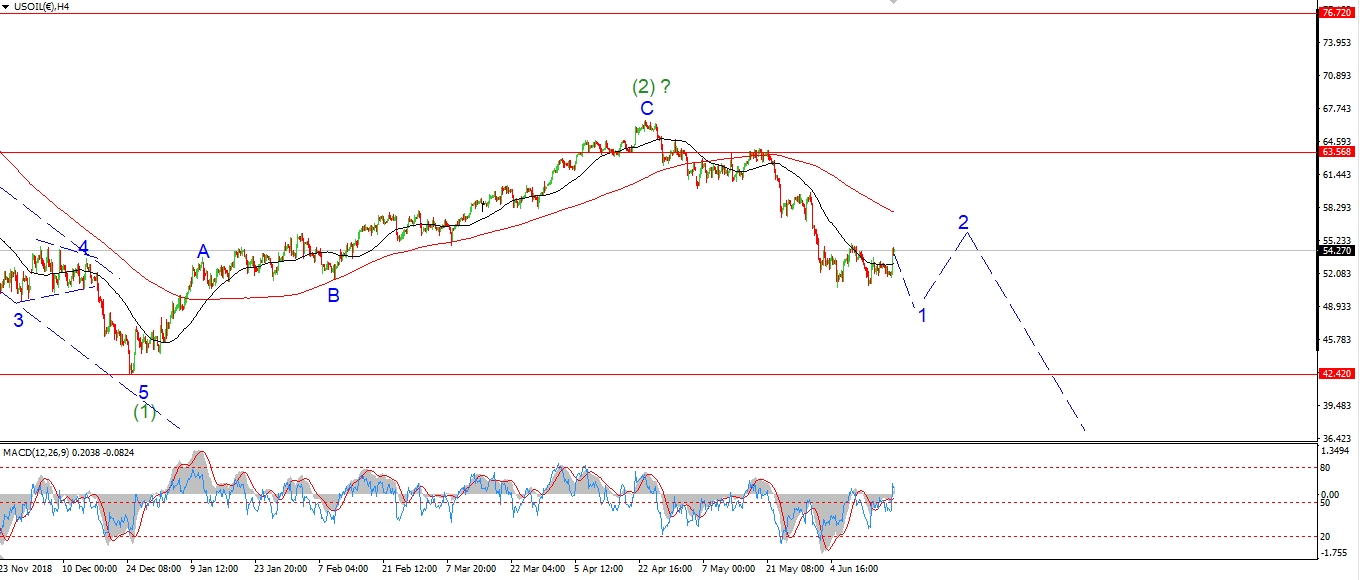 [/vc_column_text][vc_custom_heading text=”Daily” use_theme_fonts=”yes”][vc_column_text]
 [/vc_column_text][/vc_column][/vc_row]
[vc_row][vc_column][vc_column_text]
The corrective action in crude continued today.
The price has moved net sideways over the last few sessions in a possible wave ‘ii’ pink.
And the price is holding below 57.64 at wave [ii].
This all points to a corrective rally scenario,
which should be retraced quickly in wave ‘iii’ of (i) over the coming days.
Tomorrow;
Watch for wave [ii] to hold at 57.64.
A decline below 54.84 will signal wave (i) is underway.
[/vc_column_text][/vc_column][/vc_row]
[vc_row][vc_column][vc_separator border_width=”5″][/vc_column][/vc_row][vc_row][vc_column][vc_column_text]
US 10 yr Treasuries.
[/vc_column_text][/vc_column][/vc_row][vc_row][vc_column][vc_separator border_width=”5″][/vc_column][/vc_row][vc_row][vc_column width=”2/3″][vc_custom_heading text=”1 hr” use_theme_fonts=”yes”][vc_column_text]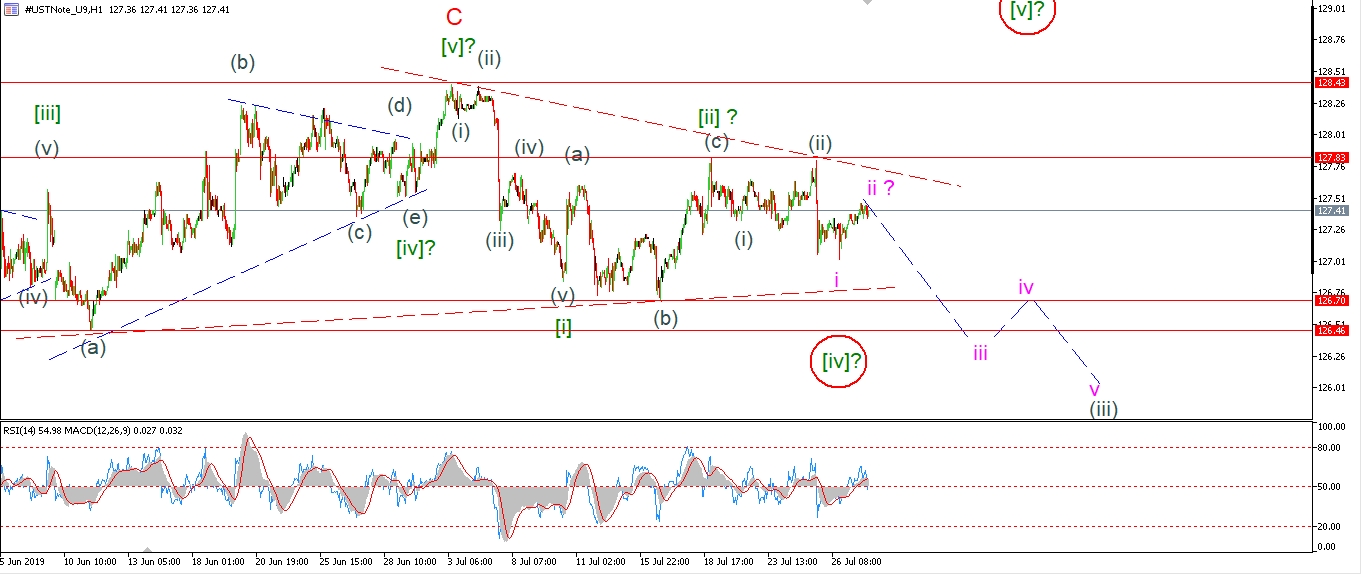 [/vc_column_text][/vc_column][vc_column width=”1/3″][vc_custom_heading text=”4 Hours” use_theme_fonts=”yes”][vc_column_text]
 [/vc_column_text][vc_custom_heading text=”Daily” use_theme_fonts=”yes”][vc_column_text]
 [/vc_column_text][/vc_column][/vc_row]
[vc_row][vc_column][vc_column_text]
The action today did not clarify anything in the short term for the 10YR.
The price has not declined into wave [iii] yet,
I have shown a bearish (i) (ii) ‘i’ ‘ii’ count off last weeks high.
this will be confirmed with a sharp move below 126.70 this week in wave (iii).
So the bearish count is still possible.
The best alternate count I can see views the whole action over the last 6 weeks
as a triangle correction in wave [iv] of ‘C’ as shown within the red trend lines.
A break above 127.83 will trigger this count.
Tomorrow;
Watch for wave ‘ii’ to complete below 127.60
and price to decline into wave ‘iii’ of (iii).
[/vc_column_text][/vc_column][/vc_row]
[vc_row][vc_column][vc_separator border_width=”5″][/vc_column][/vc_row][vc_row][vc_column][vc_column_text]
SILVER
[/vc_column_text][/vc_column][/vc_row][vc_row][vc_column][vc_separator border_width=”5″][/vc_column][/vc_row][vc_row][vc_column width=”2/3″][vc_custom_heading text=”1 hr” use_theme_fonts=”yes”][vc_column_text]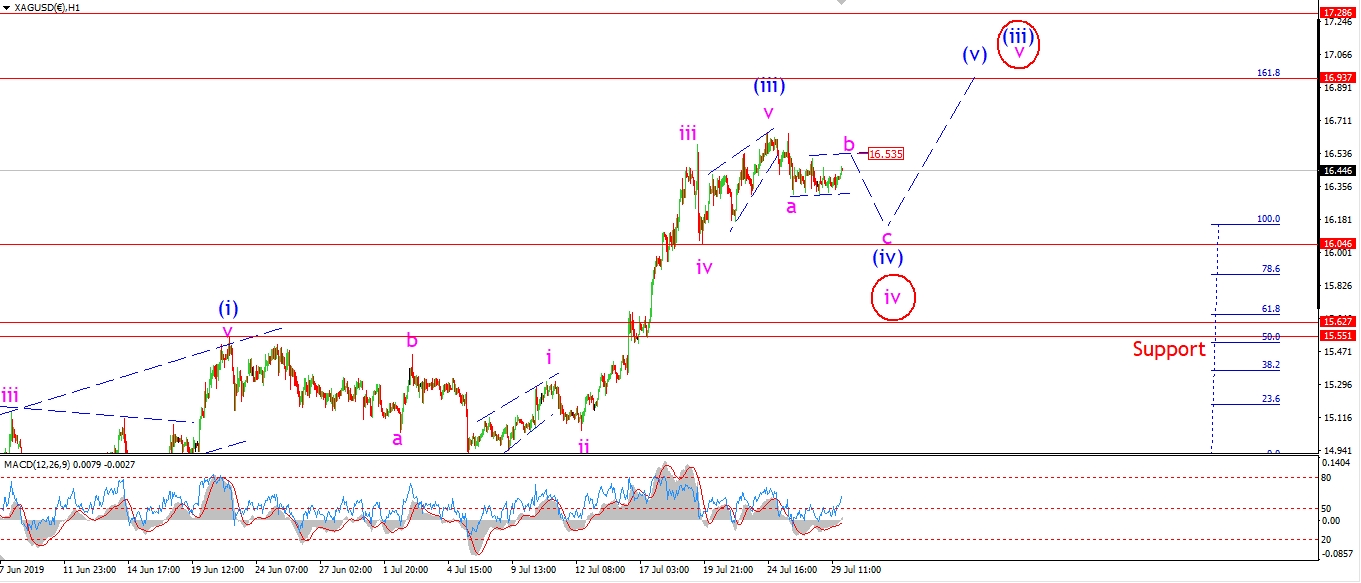 [/vc_column_text][/vc_column][vc_column width=”1/3″][vc_custom_heading text=”4 Hours” use_theme_fonts=”yes”][vc_column_text]
 [/vc_column_text][vc_custom_heading text=”Daily” use_theme_fonts=”yes”][vc_column_text]
 [/vc_column_text][/vc_column][/vc_row]
[vc_row][vc_column][vc_column_text]
The pattern in Silver is pretty hard to read right now.
And this fact alone adds to the idea
that this action is corrective to the downside rather than a new downtrend beginning.
I have shown a possible complex three wave move underway in either wave (iv) or wave ‘iv’.
The sideways action over the last few sessions is viewed as wave ‘b’,
and wave ‘c’ down over the coming few days should complete a three wave correction at about 16.00.
Tomorrow;
Watch for wave ‘b’ to complete within the trend channel at 16.50,
and wave ‘c’ to drop off that high to the target.
[/vc_column_text][/vc_column][/vc_row]
[vc_row][vc_column][vc_separator border_width=”5″][/vc_column][/vc_row][vc_row][vc_column][vc_column_text]
S&P 500.
[/vc_column_text][/vc_column][/vc_row][vc_row][vc_column][vc_separator border_width=”5″][/vc_column][/vc_row][vc_row][vc_column width=”2/3″][vc_custom_heading text=”1 hr” use_theme_fonts=”yes”][vc_column_text]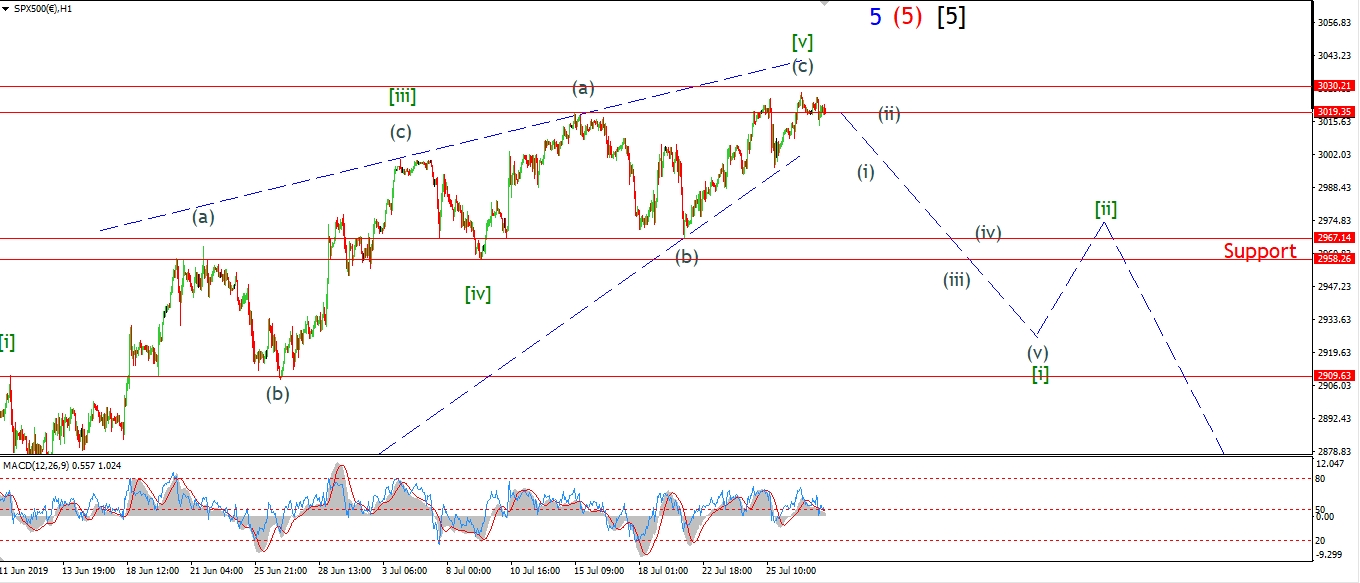 [/vc_column_text][/vc_column][vc_column width=”1/3″][vc_custom_heading text=”4 Hours” use_theme_fonts=”yes”][vc_column_text]
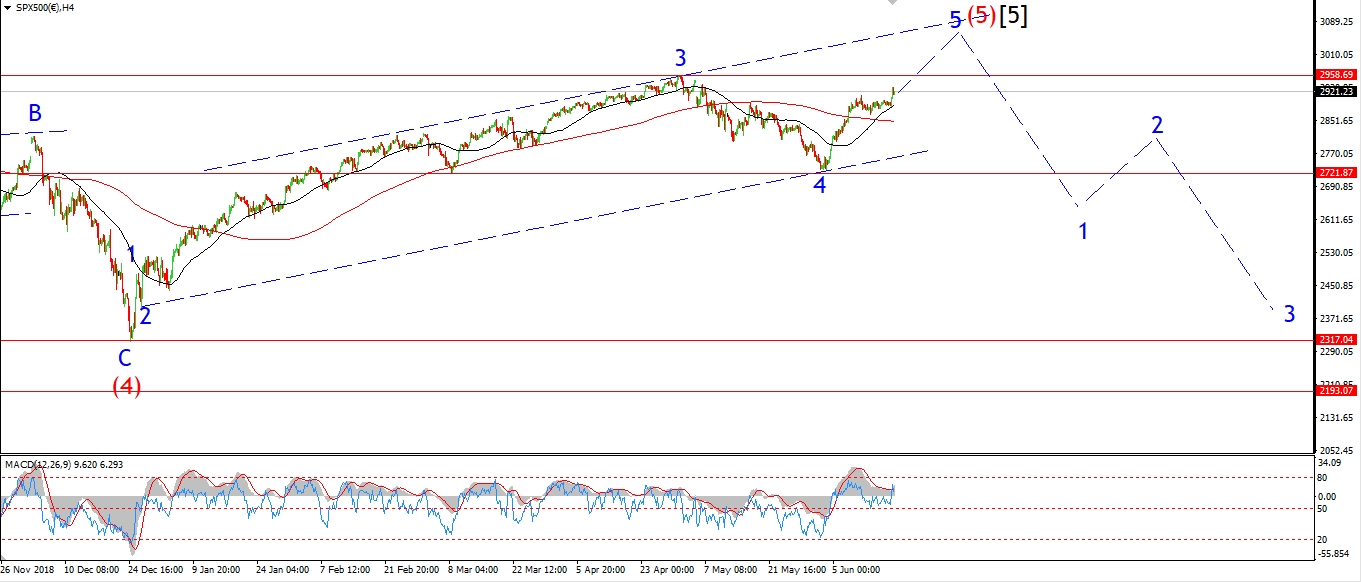 [/vc_column_text][vc_custom_heading text=”Daily” use_theme_fonts=”yes”][vc_column_text]
 [/vc_column_text][/vc_column][/vc_row]
[vc_row][vc_column][vc_column_text]
The S&P fell today but without any real impetus behind yet.
I think the market is primed for a sharp fall any day now,
given the extremes in sentiment,
lack of leadership in the rally,
and the extended nature of the wave count.
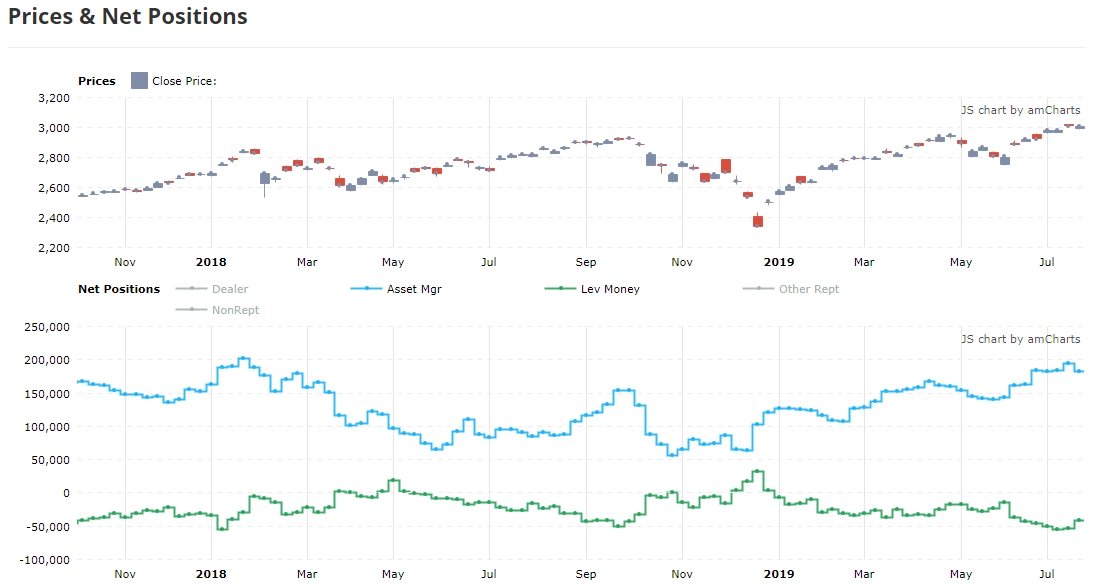
According to the latest COT data,
the market is in a more vulnerable situation now,
than it was late September last year.
And an equal extreme to February last year.
There seems to be no way out of this now but down.
And down hard as far as the wave count is concerned.
Tomorrow;
Watch for an initial drop in five waves off the highs
to signal wave (i) of [i] has begun.
This is the main focus for the week.
[/vc_column_text][/vc_column][/vc_row]
[vc_row][vc_column][vc_separator border_width=”5″][/vc_column][/vc_row]