
[vc_row][vc_column][vc_separator border_width=”5″][/vc_column][/vc_row]
[vc_row][vc_column][vc_column_text]
Good evening all.
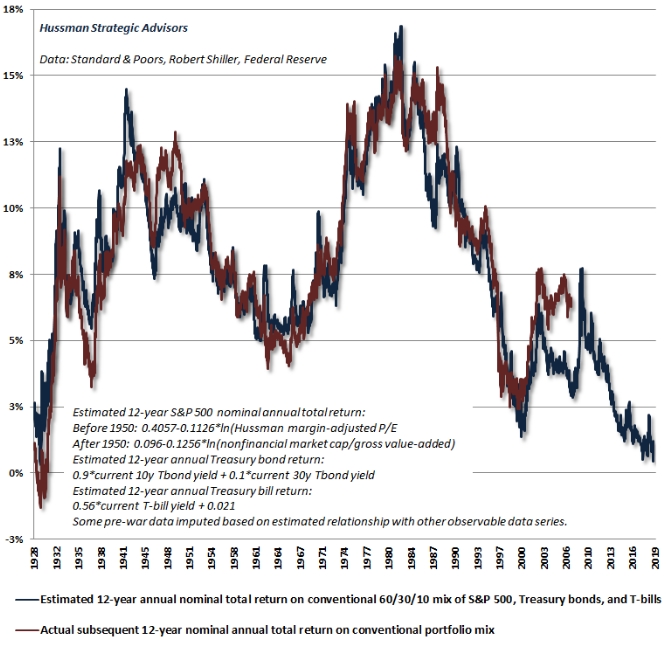
Heres a very interesting update from John Hussman to underline the severity of the current bubble.
Ooof.
Our estimate of 12-year prospective returns for a conventional portfolio mix (60% S&P 500, 30% Treasury bonds, 10% Tbills) is now down to 0.46%.
The single week in history with a lower estimated prospective return was August 26, 1929 at the market peak.
Just FYI.
 Get your umbrellas on the ready cause it gonna rain soon!
[/vc_column_text][/vc_column][/vc_row]
[vc_row][vc_column][vc_separator border_width=”5″][/vc_column][/vc_row]
[vc_row][vc_column][vc_column_text]
EURUSD
[/vc_column_text][/vc_column][/vc_row]
[vc_row][vc_column][vc_separator border_width=”5″][/vc_column][/vc_row][vc_row][vc_column width=”2/3″][vc_custom_heading text=”1 hr” use_theme_fonts=”yes”][vc_column_text]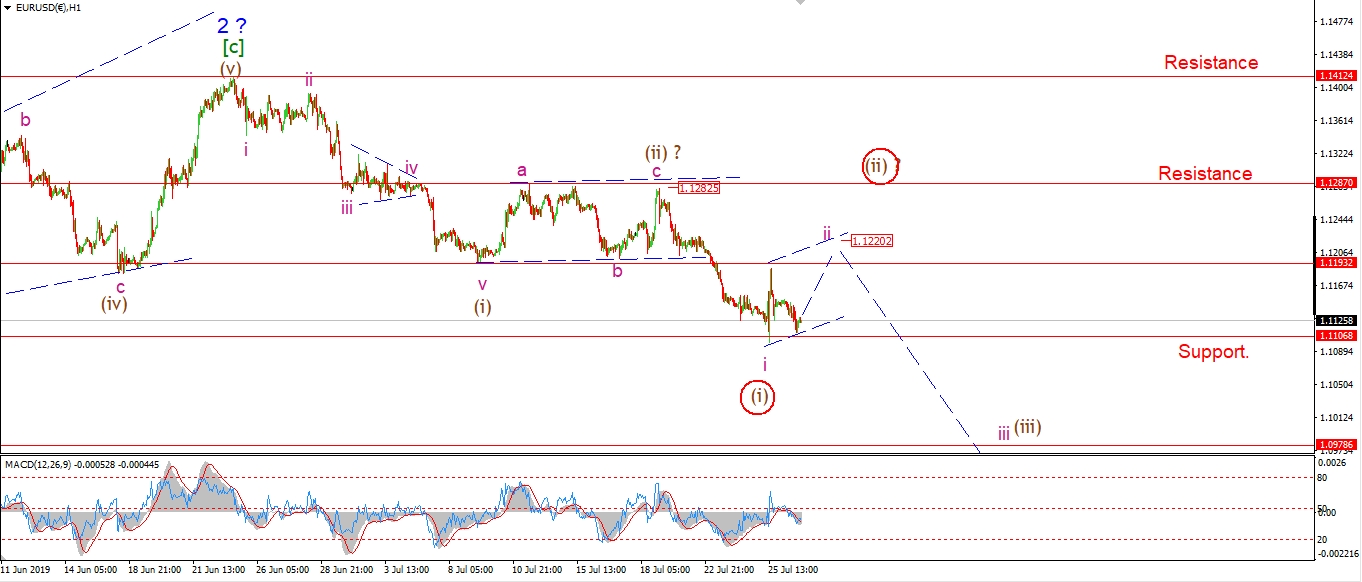 [/vc_column_text][/vc_column][vc_column width=”1/3″][vc_custom_heading text=”4 Hours” use_theme_fonts=”yes”][vc_column_text]
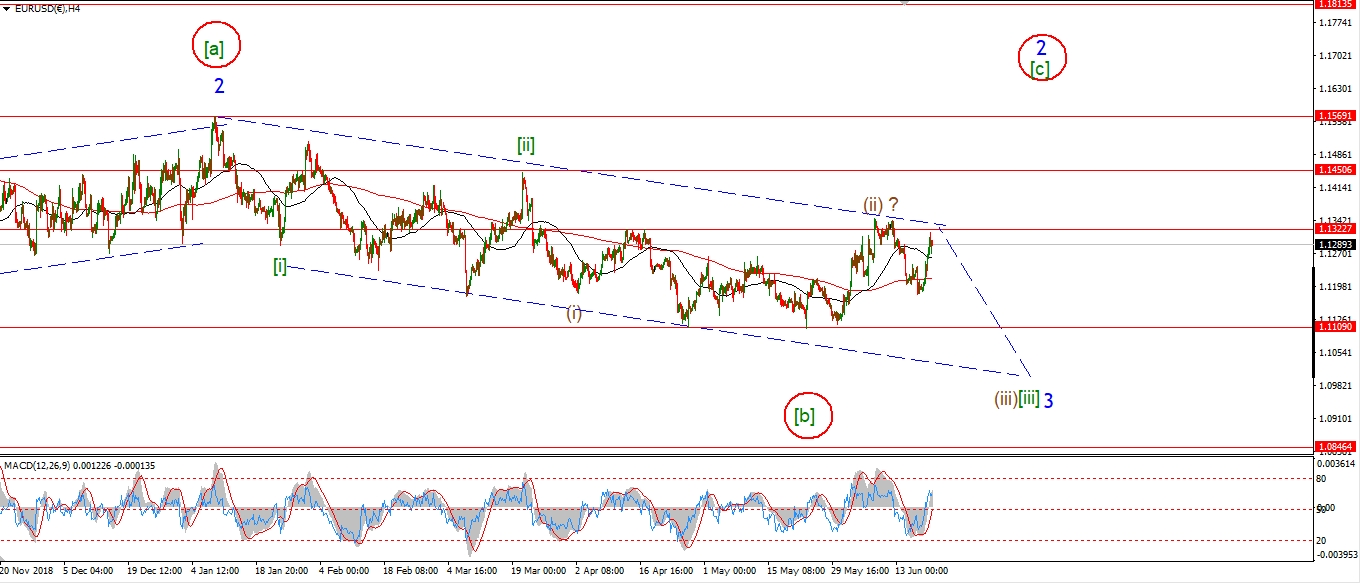 [/vc_column_text][vc_custom_heading text=”Daily” use_theme_fonts=”yes”][vc_column_text]
 [/vc_column_text][/vc_column][/vc_row]
[vc_row][vc_column][vc_column_text]
EURUSD moved lower in three waves today and has formed a small higher low this evening.
This three wave move looks like an internal ‘b’ wave within wave ‘ii’.
So we should see wave ‘ii’ rise again on Monday to meet the upper trend channel line at 1.1220 at a minimum.
This will complete the correction in wave ‘ii’,
and ready the market for a decline in wave ‘iii’ again.
I spoke about the alternate scenario on the video earlier today,
This involves a larger wave (ii) as shown.
Monday;
We should see wave ‘ii’ complete by Monday evening in the area of 1.1220.
Further weakness at that point will suggest that wave ‘iii’ down has begun.
[/vc_column_text][/vc_column][/vc_row]
[vc_row][vc_column][vc_separator border_width=”5″][/vc_column][/vc_row][vc_row][vc_column][vc_column_text]
GBPUSD
[/vc_column_text][/vc_column][/vc_row][vc_row][vc_column][vc_separator border_width=”5″][/vc_column][/vc_row][vc_row][vc_column width=”2/3″][vc_custom_heading text=”1 hr” use_theme_fonts=”yes”][vc_column_text]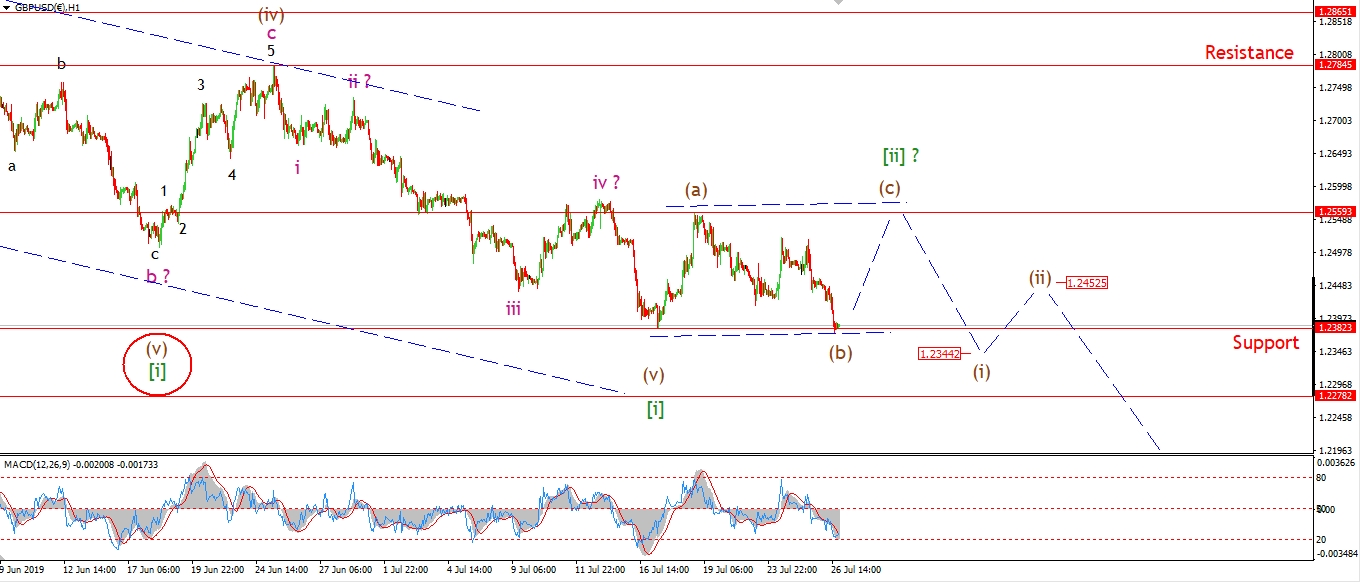 [/vc_column_text][/vc_column][vc_column width=”1/3″][vc_custom_heading text=”4 Hours” use_theme_fonts=”yes”][vc_column_text]
 [/vc_column_text][vc_custom_heading text=”Daily” use_theme_fonts=”yes”][vc_column_text]
 [/vc_column_text][/vc_column][/vc_row]
[vc_row][vc_column][vc_column_text]
Cable also fell further today.
This action is still viewed as part of a correction within wave [ii].
The price has fallen in three waves this week,
and this is labelled wave (b) of [ii].
The fact that we got a slight new low this evening makes wave [ii] an expanded flat correction.
And wave (c) of [ii] should now rally in five waves off the low to complete the correction above 1.2560.
Monday;
Watch for wave (c) to push higher again on Monday to break the wave (a) high at a minimum.
[/vc_column_text][/vc_column][/vc_row]
[vc_row][vc_column][vc_separator border_width=”5″][/vc_column][/vc_row][vc_row][vc_column][vc_column_text]
USDJPY
[/vc_column_text][/vc_column][/vc_row][vc_row][vc_column][vc_separator border_width=”5″][/vc_column][/vc_row][vc_row][vc_column width=”2/3″][vc_custom_heading text=”1 hr” use_theme_fonts=”yes”][vc_column_text]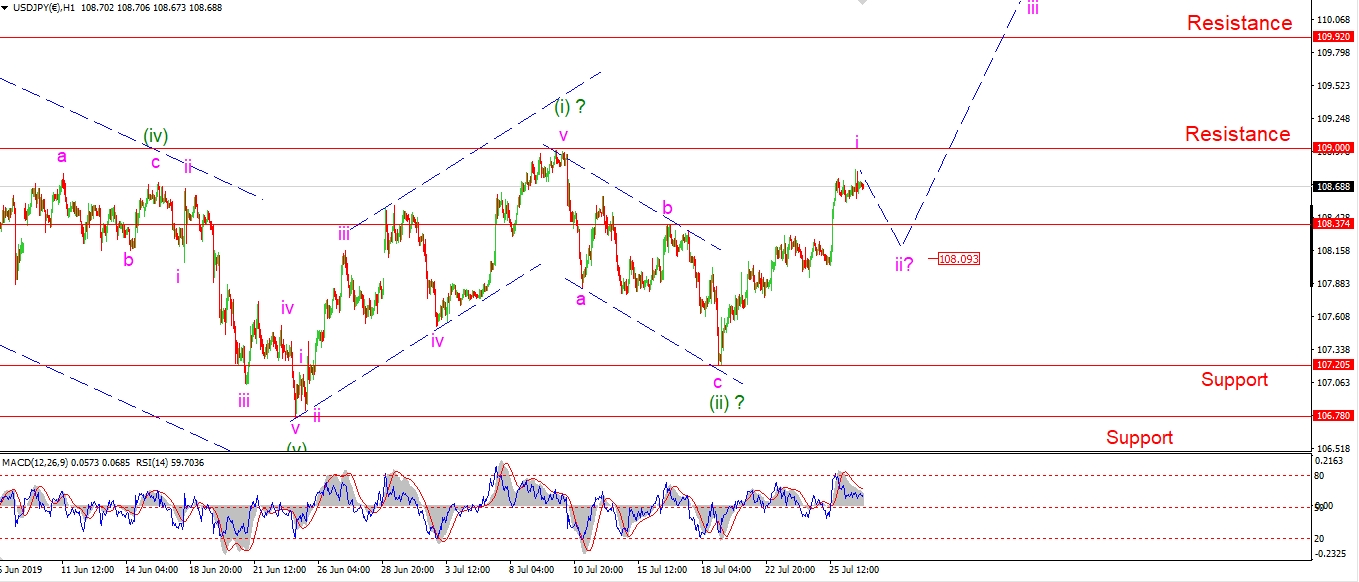 [/vc_column_text][/vc_column][vc_column width=”1/3″][vc_custom_heading text=”4 Hours” use_theme_fonts=”yes”][vc_column_text]
 [/vc_column_text][vc_custom_heading text=”Daily” use_theme_fonts=”yes”][vc_column_text]
 [/vc_column_text][/vc_column][/vc_row]
[vc_row][vc_column][vc_column_text]
USDJPY is holding at the highs today so far,
I think this suggests we have reached the top of wave ‘i’ pink as shown,
And wave ‘ii’ pink should begin from here.
The likely target lies at the 108.00 handle again for wave ‘ii’.
I think wave ‘ii’ should be over quite quickly,
given the long drawn out nature of the previous corrections.
It is time to start putting some gains in now for the USD.
Monday;
Watch for wave ‘ii’ to begin with a drop towards the 108.00 level.
[/vc_column_text][/vc_column][/vc_row]
[vc_row][vc_column][vc_separator border_width=”5″][/vc_column][/vc_row][vc_row][vc_column][vc_column_text]
DOW JONES INDUSTRIALS
[/vc_column_text][/vc_column][/vc_row][vc_row][vc_column][vc_separator border_width=”5″][/vc_column][/vc_row][vc_row][vc_column width=”2/3″][vc_custom_heading text=”1 hr” use_theme_fonts=”yes”][vc_column_text]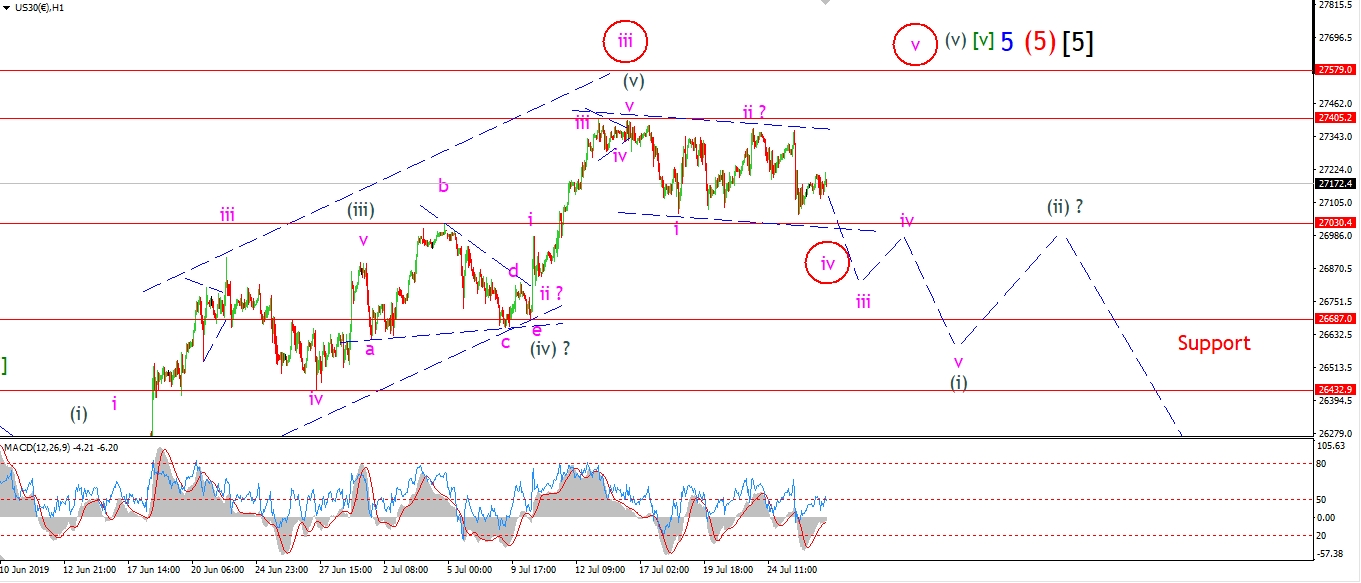 [/vc_column_text][/vc_column][vc_column width=”1/3″][vc_custom_heading text=”4 Hours” use_theme_fonts=”yes”][vc_column_text]
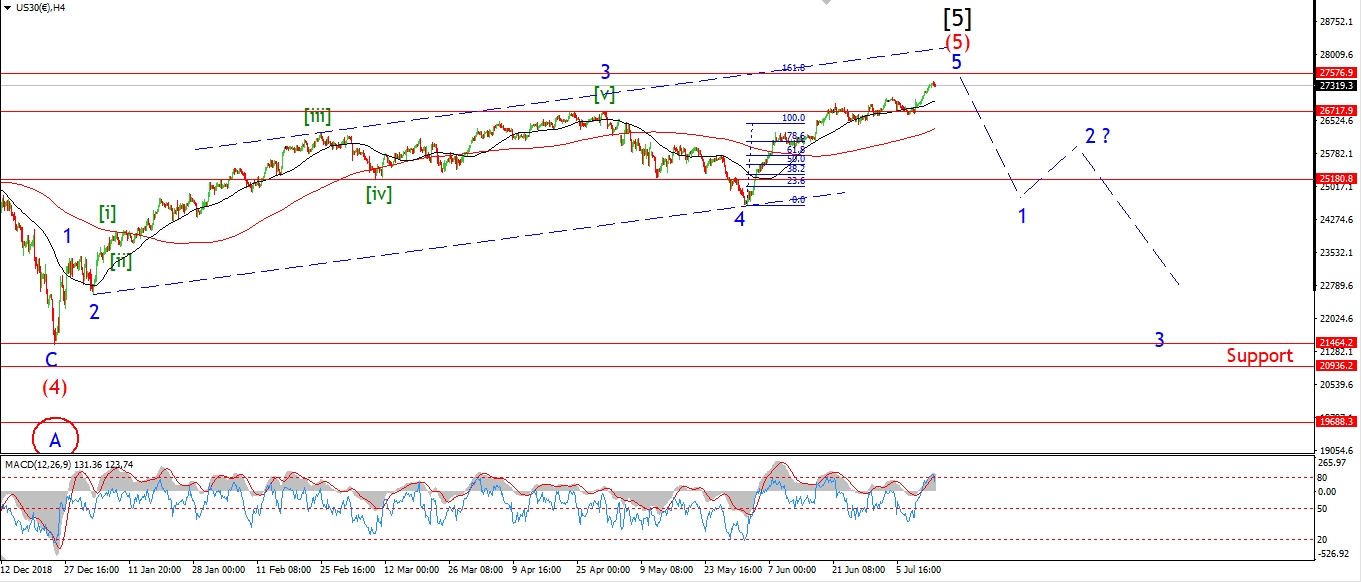 [/vc_column_text][vc_custom_heading text=”Daily” use_theme_fonts=”yes”][vc_column_text]
 [/vc_column_text][/vc_column][/vc_row]
[vc_row][vc_column][vc_column_text]
The S&P made a new high today,
but the DOW is diverging lower now,
and on the cusp of creating a five wave pattern lower off its recent highs.
The alternate count is still a possibility for the DOW,
But I am not convinced by it.
The fact that all boats did not rise today,
suggests a very concentrated and narrow rally within the S&P.
And if the decline in the DOW continues on Monday,
this will be a very strong signal that a major turn in underway.
Monday;
We still await five waves down in the DOW,
but,
if the current count is correct,
then next week should be enough for wave (i) to close out.
Watch for wave ‘iii’ of (i) to continue lower.
[/vc_column_text][/vc_column][/vc_row]
[vc_row][vc_column][vc_separator border_width=”5″][/vc_column][/vc_row][vc_row][vc_column][vc_column_text]
GOLD
[/vc_column_text][/vc_column][/vc_row][vc_row][vc_column][vc_separator border_width=”5″][/vc_column][/vc_row][vc_row][vc_column width=”2/3″][vc_custom_heading text=”1 hr” use_theme_fonts=”yes”][vc_column_text]
 [/vc_column_text][/vc_column][vc_column width=”1/3″][vc_custom_heading text=”4 Hours” use_theme_fonts=”yes”][vc_column_text]
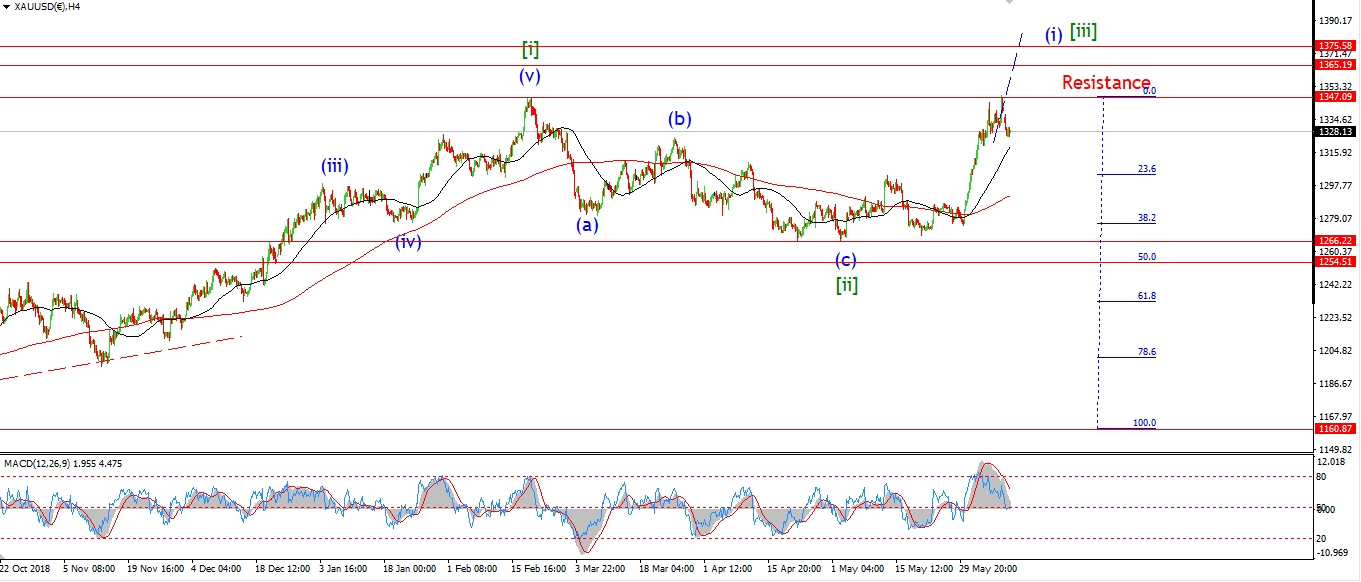 [/vc_column_text][vc_custom_heading text=”Daily” use_theme_fonts=”yes”][vc_column_text]
 [/vc_column_text][/vc_column][/vc_row]
[vc_row][vc_column][vc_column_text]
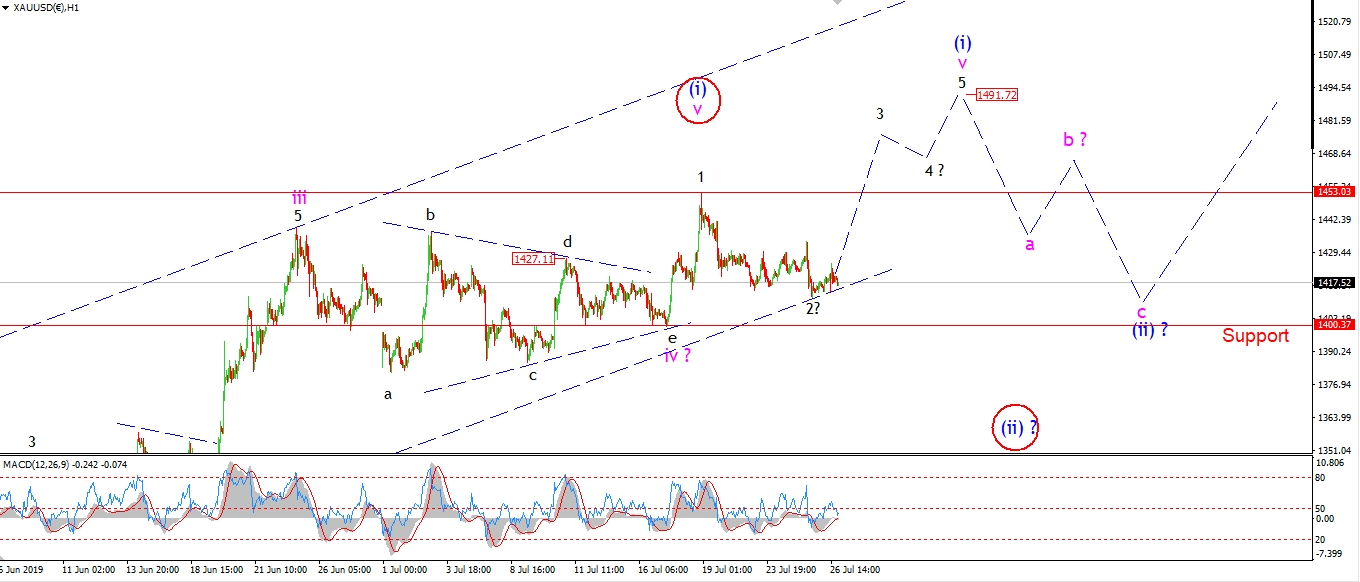
There was no change for gold today.
The market was dead flat,
and this leaves open the possibility that wave ‘v’ is still underway.
That all important 1400 level is still holding,
so I will stick with the current wave count for now.
Monday;
Watch for 1400 to continue to hold and wave ‘3’ of ‘v’ to push higher.
Wave ‘v’ and wave (i) should complete by the end of the week.
And then we can prepare for a correction into wave (ii).
[/vc_column_text][/vc_column][/vc_row]
[vc_row][vc_column][vc_separator border_width=”5″][/vc_column][/vc_row][vc_row][vc_column][vc_column_text]
U.S CRUDE OIL
[/vc_column_text][/vc_column][/vc_row][vc_row][vc_column][vc_separator border_width=”5″][/vc_column][/vc_row][vc_row][vc_column width=”2/3″][vc_custom_heading text=”1 hr” use_theme_fonts=”yes”][vc_column_text]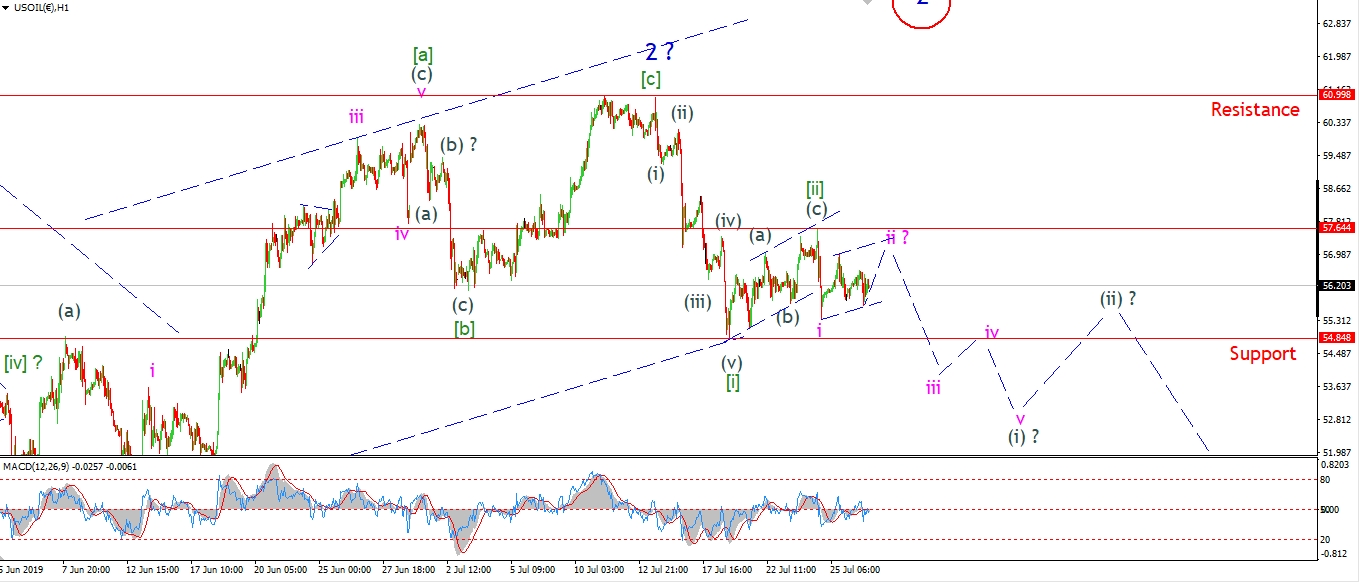 [/vc_column_text][/vc_column][vc_column width=”1/3″][vc_custom_heading text=”4 Hours” use_theme_fonts=”yes”][vc_column_text]
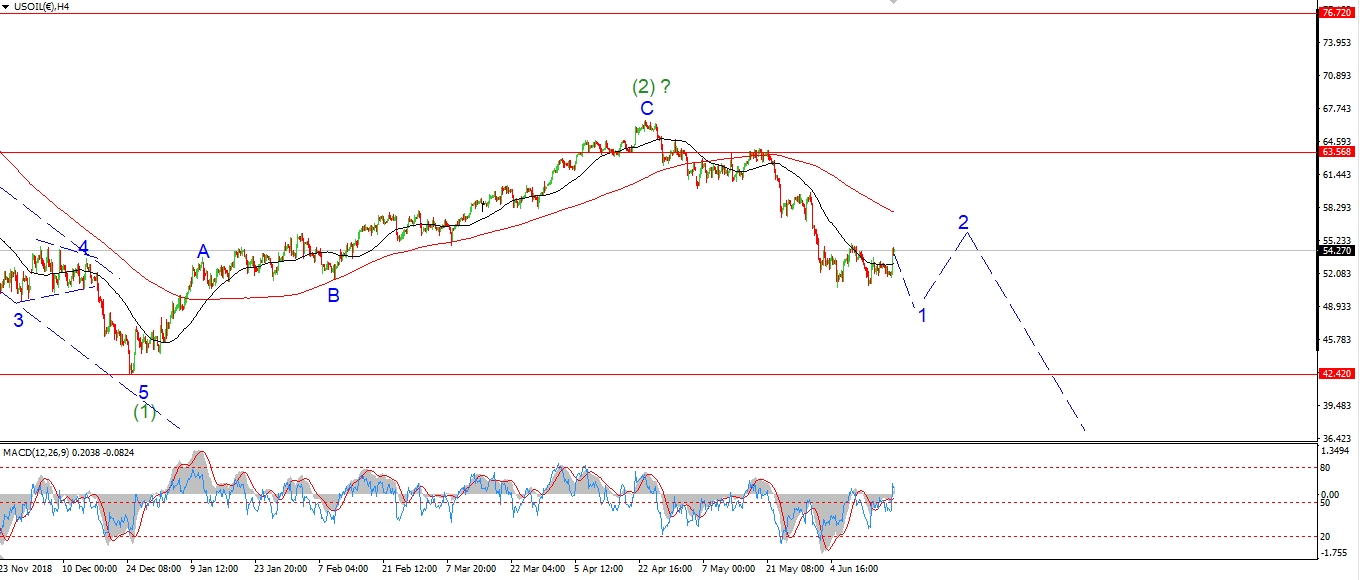 [/vc_column_text][vc_custom_heading text=”Daily” use_theme_fonts=”yes”][vc_column_text]
 [/vc_column_text][/vc_column][/vc_row]
[vc_row][vc_column][vc_column_text]
Crude has fallen in a clear three wave form over the last few sessions.
The market has rebounded slightly this afternoon also.
This action suggests wave ‘ii’ pink is still underway.
And wave ‘ii’ should complete a three wave form to the upside as shown by Monday evening.
this correction must complete below the previous wave [ii] at 57.64.
Tomorrow,
watch for wave ‘ii’ to complete below 57.64.
Wave ‘iii’ down will be confirmed with a break of 54.84.
[/vc_column_text][/vc_column][/vc_row]
[vc_row][vc_column][vc_separator border_width=”5″][/vc_column][/vc_row][vc_row][vc_column][vc_column_text]
US 10 yr Treasuries.
[/vc_column_text][/vc_column][/vc_row][vc_row][vc_column][vc_separator border_width=”5″][/vc_column][/vc_row][vc_row][vc_column width=”2/3″][vc_custom_heading text=”1 hr” use_theme_fonts=”yes”][vc_column_text]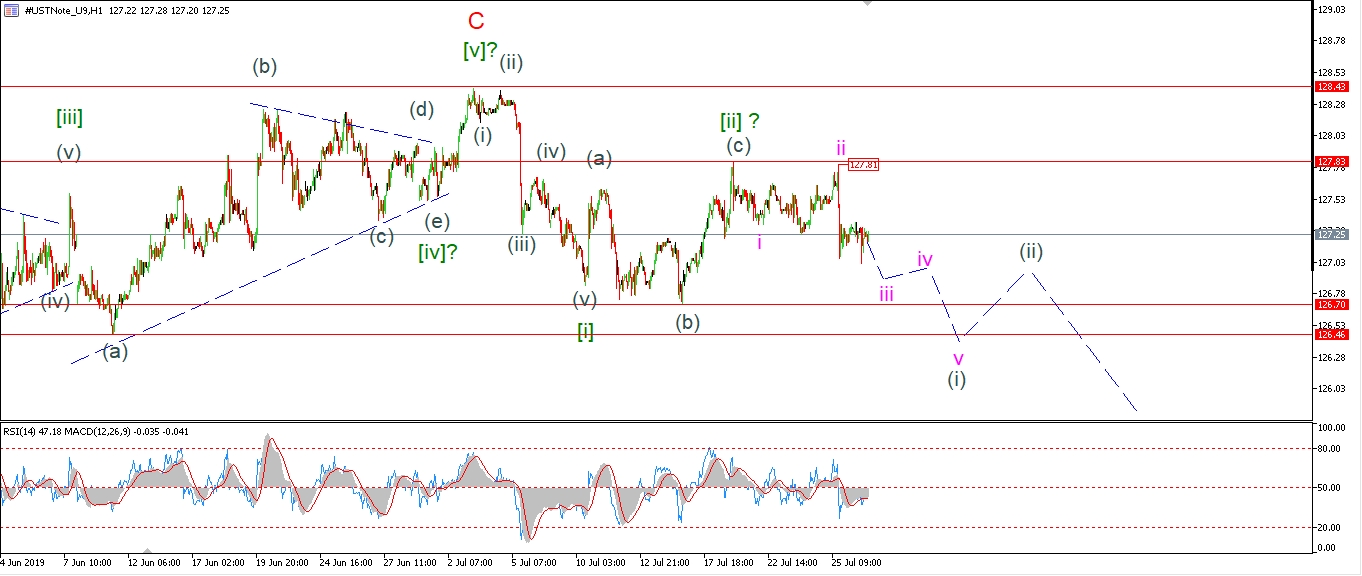 [/vc_column_text][/vc_column][vc_column width=”1/3″][vc_custom_heading text=”4 Hours” use_theme_fonts=”yes”][vc_column_text]
 [/vc_column_text][vc_custom_heading text=”Daily” use_theme_fonts=”yes”][vc_column_text]
 [/vc_column_text][/vc_column][/vc_row]
[vc_row][vc_column][vc_column_text]
I am still tracking a five wave move lower in wave (i) grey today.
The price is currently viewed as moving in wave ‘iii’ of (i).
So we should see further declines next week to confirm the change in trend.
Monday;
Watch for wave (i) down to continue and complete next week.
Wave (i) should break 126.70 at a minimum.
[/vc_column_text][/vc_column][/vc_row]
[vc_row][vc_column][vc_separator border_width=”5″][/vc_column][/vc_row][vc_row][vc_column][vc_column_text]
SILVER
[/vc_column_text][/vc_column][/vc_row][vc_row][vc_column][vc_separator border_width=”5″][/vc_column][/vc_row][vc_row][vc_column width=”2/3″][vc_custom_heading text=”1 hr” use_theme_fonts=”yes”][vc_column_text]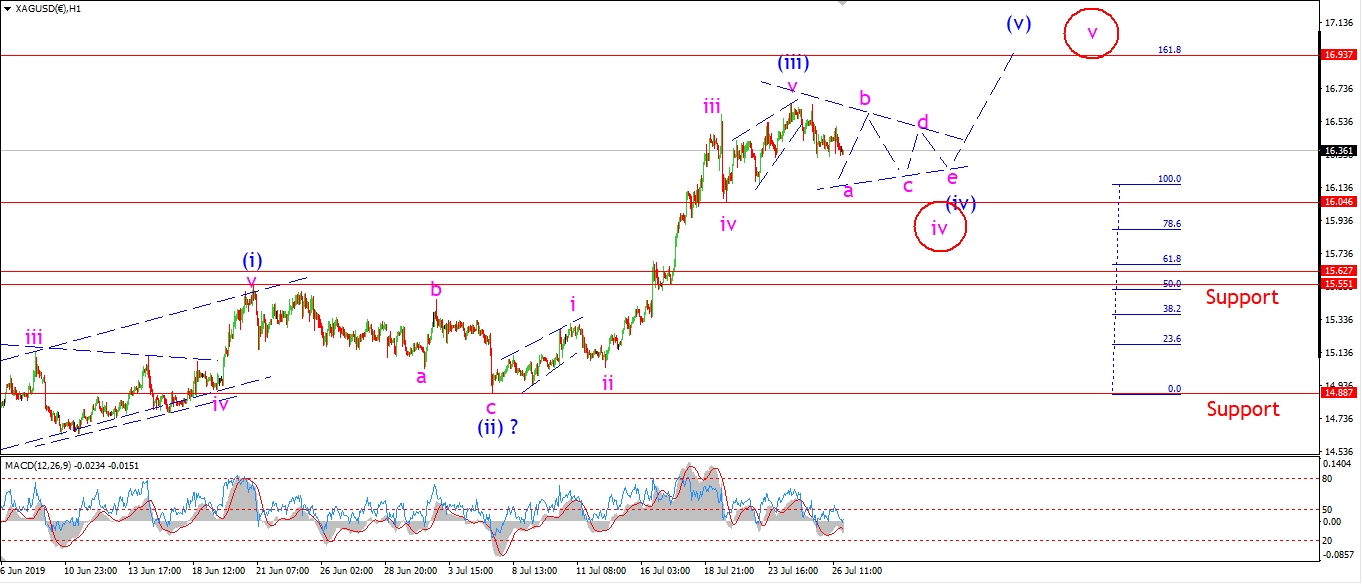 [/vc_column_text][/vc_column][vc_column width=”1/3″][vc_custom_heading text=”4 Hours” use_theme_fonts=”yes”][vc_column_text]
 [/vc_column_text][vc_custom_heading text=”Daily” use_theme_fonts=”yes”][vc_column_text]
 [/vc_column_text][/vc_column][/vc_row]
[vc_row][vc_column][vc_column_text]
Silver is correcting off the recent high now in a fourth wave.
The only question I have now is;
at what degree is the fourth wave occurring.
I discussed this in the video earlier.
We may have a correction in wave ‘iv’ pink within wave (iii),
or this could be the beginning of wave (iv) itself.
Either way,
this decline should prove corrective over the coming weeks,
And we should resume a rally again once complete.
Monday;
Watch for the correction to continue for the majority of next week.
The price should hold above 16.00 also.
[/vc_column_text][/vc_column][/vc_row]
[vc_row][vc_column][vc_separator border_width=”5″][/vc_column][/vc_row][vc_row][vc_column][vc_column_text]
S&P 500.
[/vc_column_text][/vc_column][/vc_row][vc_row][vc_column][vc_separator border_width=”5″][/vc_column][/vc_row][vc_row][vc_column width=”2/3″][vc_custom_heading text=”1 hr” use_theme_fonts=”yes”][vc_column_text]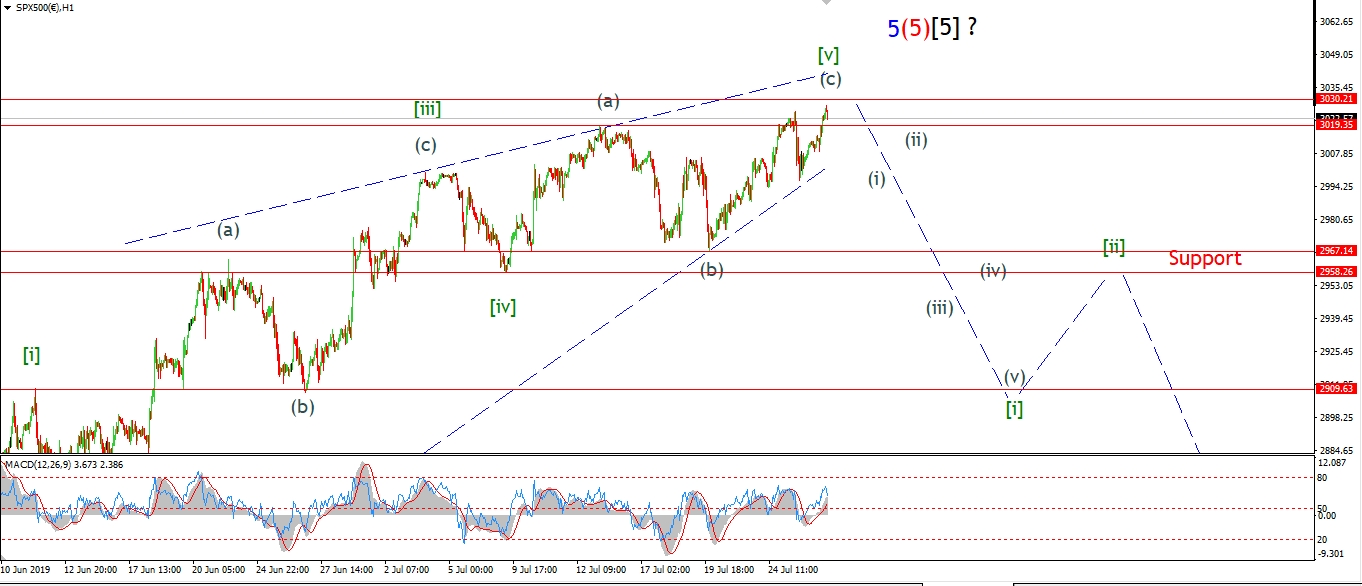 [/vc_column_text][/vc_column][vc_column width=”1/3″][vc_custom_heading text=”4 Hours” use_theme_fonts=”yes”][vc_column_text]
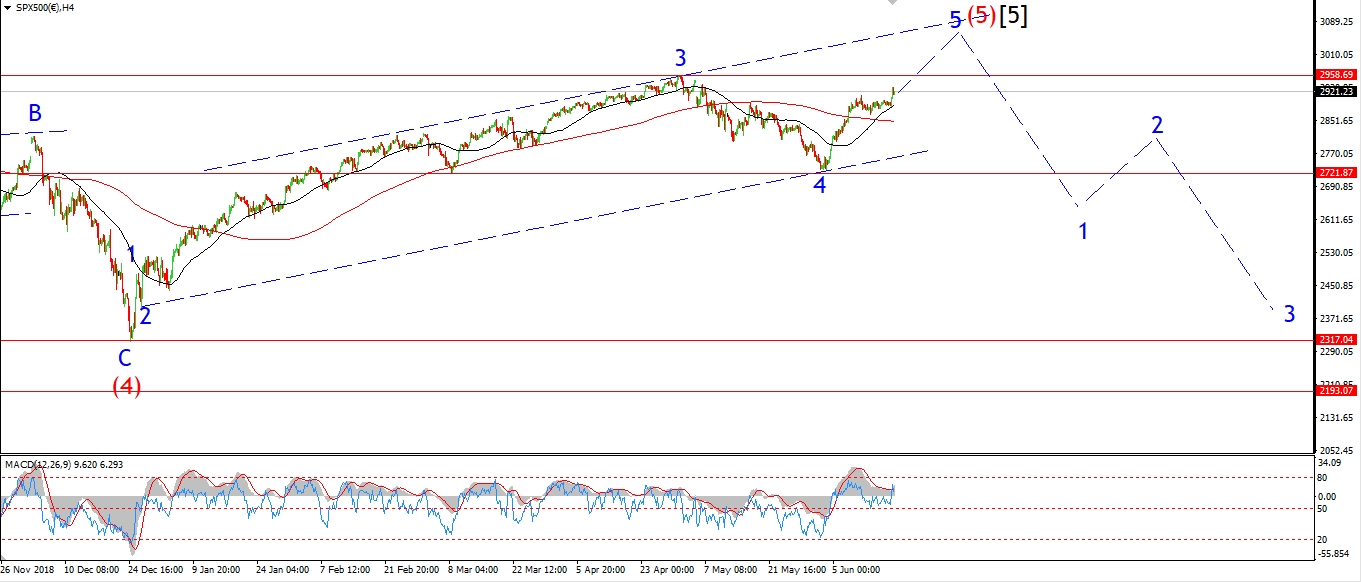 [/vc_column_text][vc_custom_heading text=”Daily” use_theme_fonts=”yes”][vc_column_text]
 [/vc_column_text][/vc_column][/vc_row]
[vc_row][vc_column][vc_column_text]
Wave [v] managed a new high today with a further rally in wave (c).
This rally is seriously exhausted now,
the market is approaching the 3030 target we looked at last week on very weak momentum.
So I think we are rallying on fumes.
This bubble is looking for a pin now,
so watch out next week.
Because I think there is a very real chance of a sharp and substantial move lower in a short period of time.
If that move lower traced out five waves and breaks 2900,
that will be the end of the bull market in my book.
This market is a dead man walking as they say!
Monday;
Watch for wave (i) down to begin next week.
2967 – 2958 marks the first major support level.
watch for that level to break as wave (iii) of [i].
[/vc_column_text][/vc_column][/vc_row]
[vc_row][vc_column][vc_separator border_width=”5″][/vc_column][/vc_row]