
Good evening to one and all, the Lord’s Blessings to you tonight.
From John Hussman,
Notice that the market losses that resolve extreme overextension are not just short-term events. Combinations of rich valuations, unfavorable internals, and extreme overextension like these often occur at or near important cyclical market peaks.
The potential for a near-term “air pocket” or “free fall” isn’t a forecast so much as a regularity that should not be ruled out. Likewise, with valuations again higher than at any point in history prior to December 2020, with the exception of several weeks surrounding the 1929 peak, the potential for a much steeper follow-through should be taken seriously. Even passive investors should examine their exposures carefully, and rebalance their portfolios to reflect their actual level of risk tolerance.

https://twitter.com/bullwavesreal
EURUSD.
EURUSD 1hr.
EURUSD 4hr.
EURUSD daily.
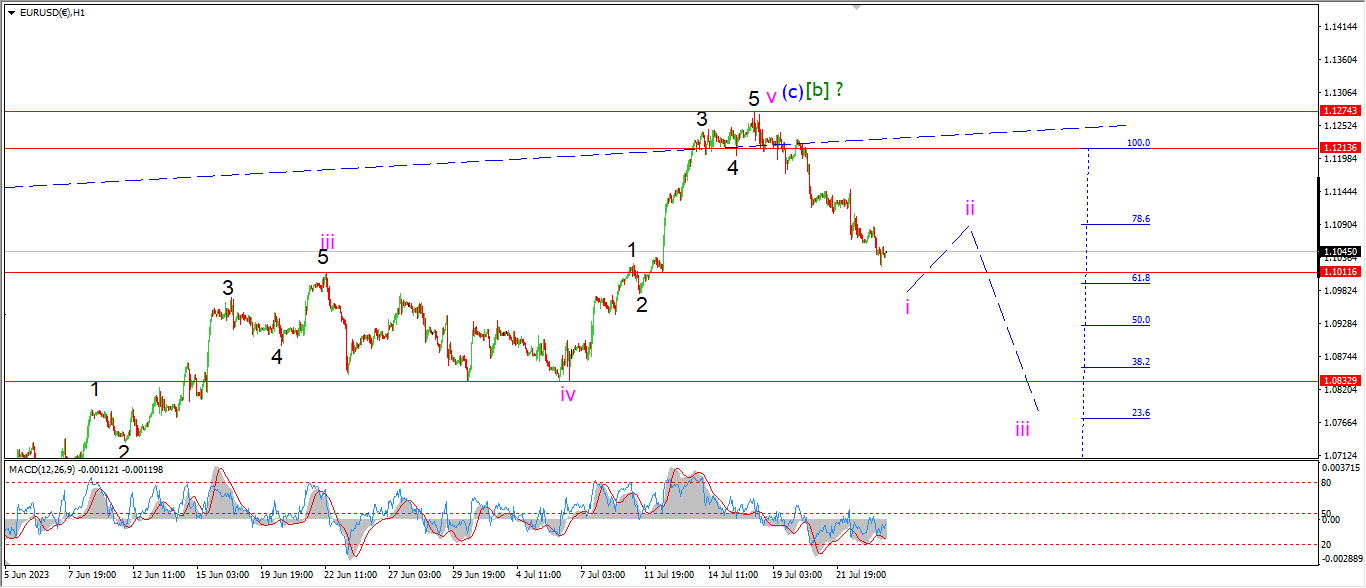
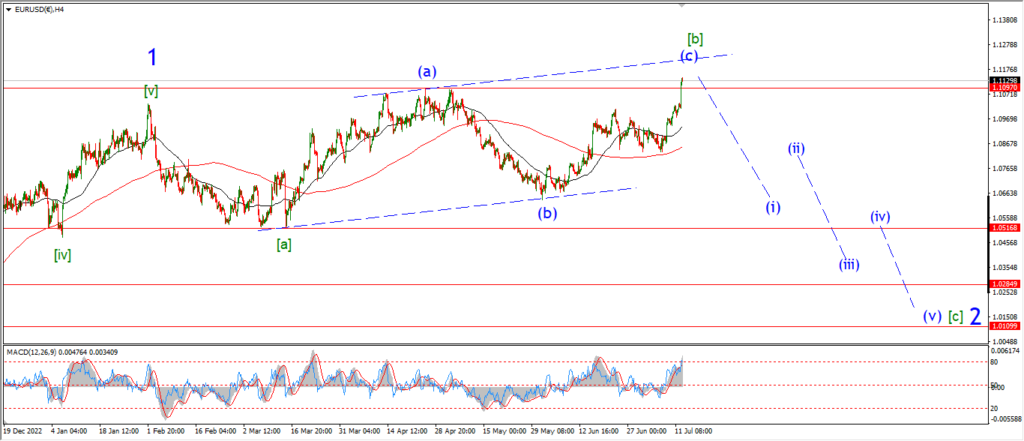
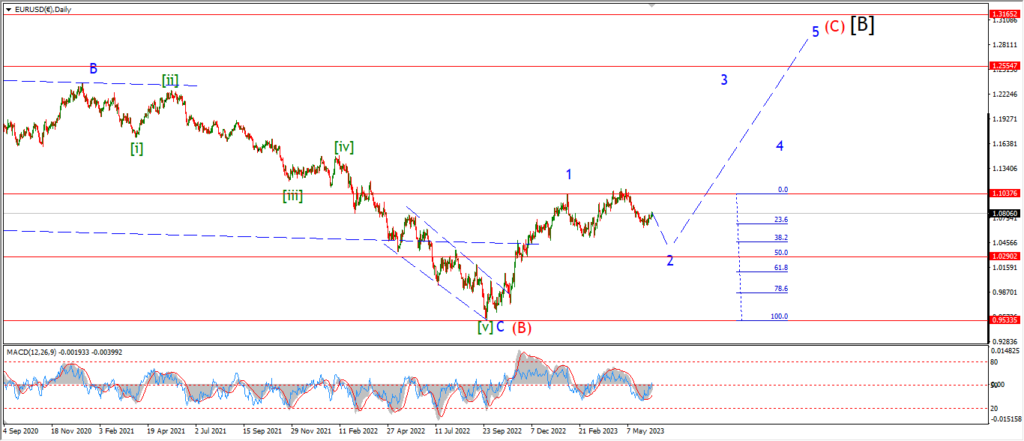
The initial decline off wave [b] is coming to an end it seems.
The price did step lower once more today,
and I would like to see a larger decline in wave ‘i’ of (i),
A break below the previous wave ‘iii’ low at 1.1011 would be preferred.
but at this point we have enough to work with at least.
Wave ‘ii’ should form a corrective lower high before the end of this week even if there is another drop to complete wave ‘i’.
Tomorrow;
Watch for a break of initial support at 1.1011.
Wave ‘i’ should complete with that,
and then I will look for wave ‘ii’ to correct higher for the rest of the week.
GBPUSD
GBPUSD 1hr.
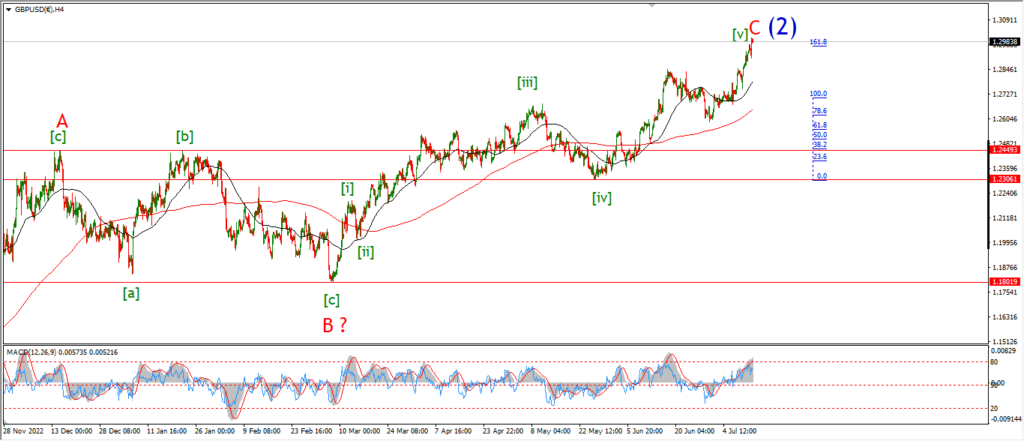
GBPUSD 4hr.
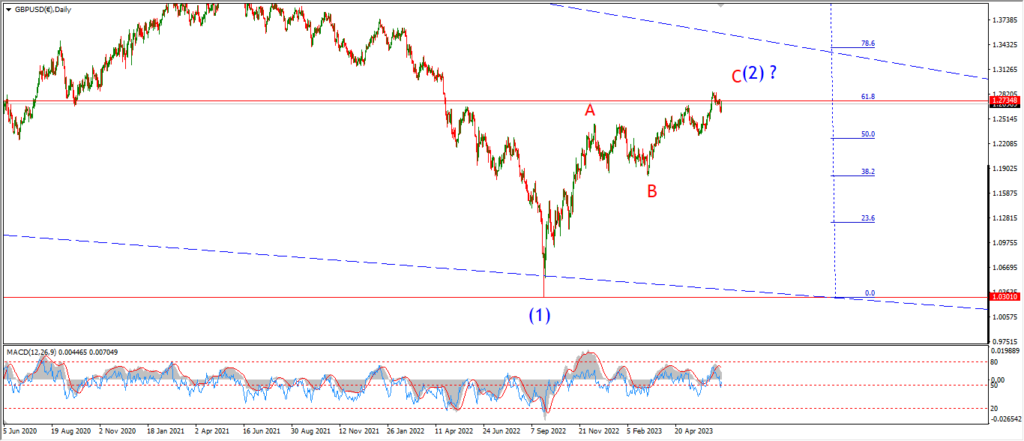
GBPUSD daily.
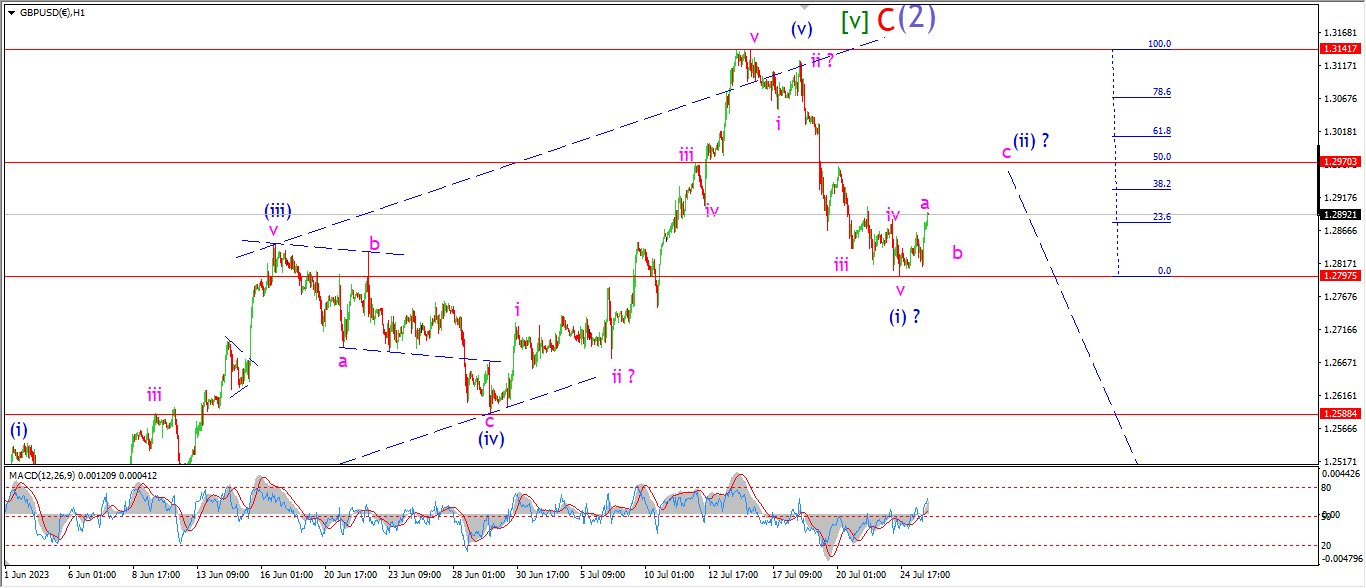
A similar setup in cable suggests a reversal pattern is building here also.
Wave (i) blue has now broken below the previous wave (iii) high at 1.2847,
and now the decline has stopped at lest for now.
I am suggesting that wave (i) is done here,
and I am looking for wave (ii) to begin correcting higher soon.
Wave (ii) should target that 50% retracement level at 1.2970 later this week.
So lets see how this develops from here.
Tomorrow;
watch for the low at 1.2797 to hold at wave (i).
a break of that level again will suggest wave (i) is still underway.
Wave ‘a’ and ‘b’ should create a small higher low by tomorrow evening.
USDJPY.
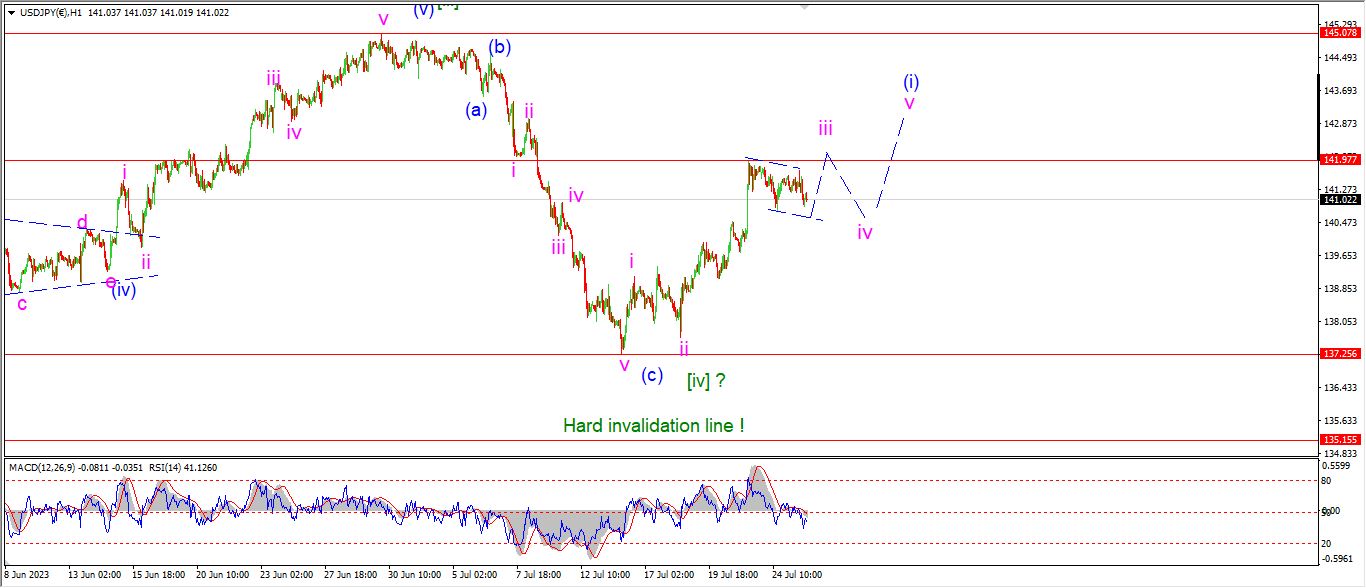
USDJPY 1hr.

USDJPY 4hr.
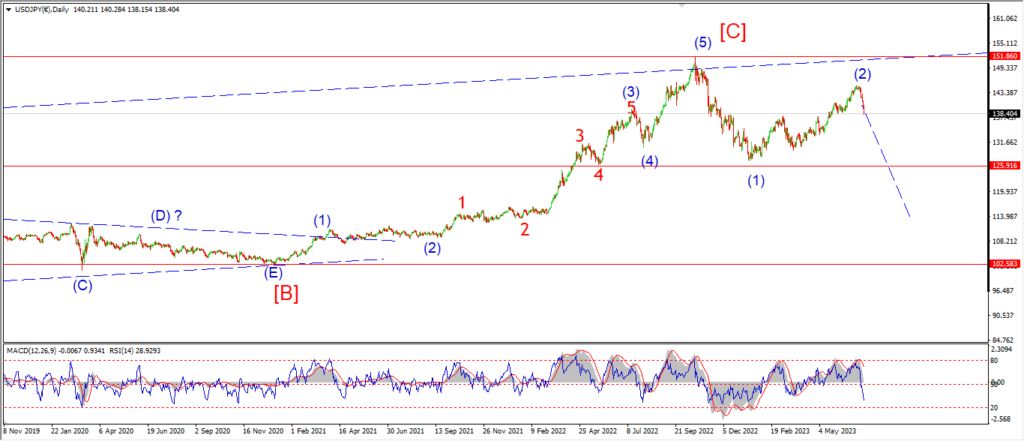
USDJPY daily.
I am looking at the action today and I think this correction is happening within wave ‘iii’ pink.
This could be a fourth wave correction in wave ‘iii’.
and if this count is correct,
then wave (i) blue has more upside ahead this week before turning lower into wave (ii).
If the price breaks below 140.00 again that will suggest wave (i) is done and wave (ii) is already underway here.
But at the moment,
I am willing to give wave (i) a little more upside potential.
I am suggesting a target in the area of 143.50 to complete wave (i).
Tomorrow;
Watch for 140.00 to hold as wave ‘iii’ develops.
Wave ‘iii’ of (i) should complete above 142.00 and then correct again in wave ‘iv’.
DOW JONES.
DOW 1hr.
DOW 4hr
DOW daily.
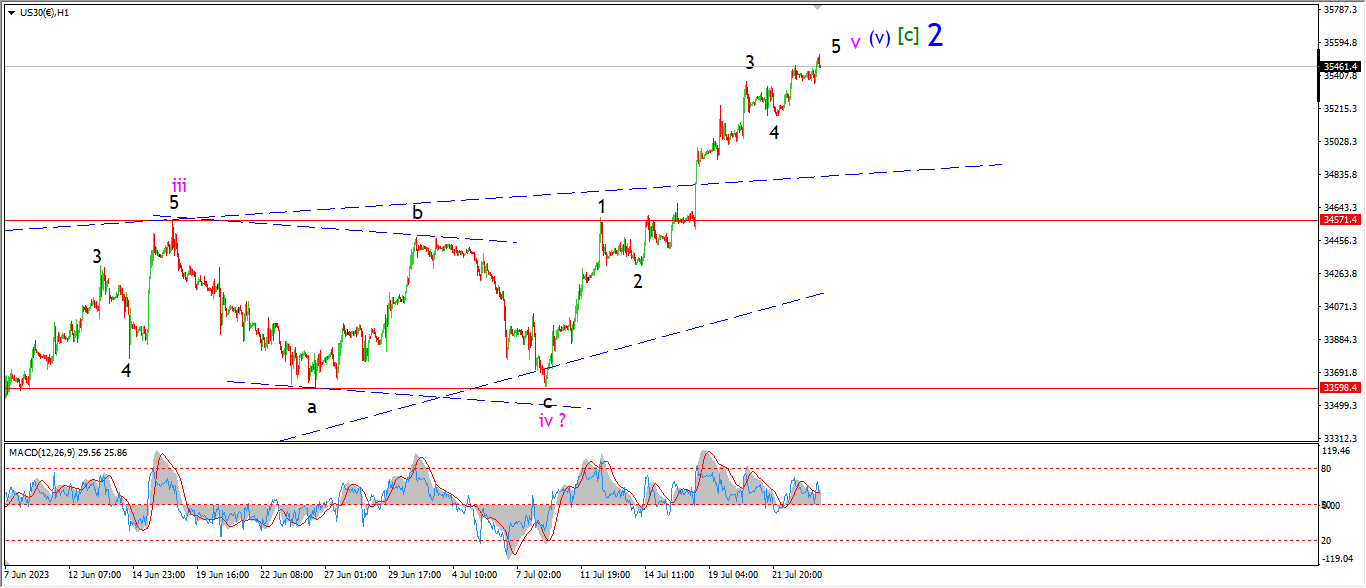
Nothing to report in the stock market today really.
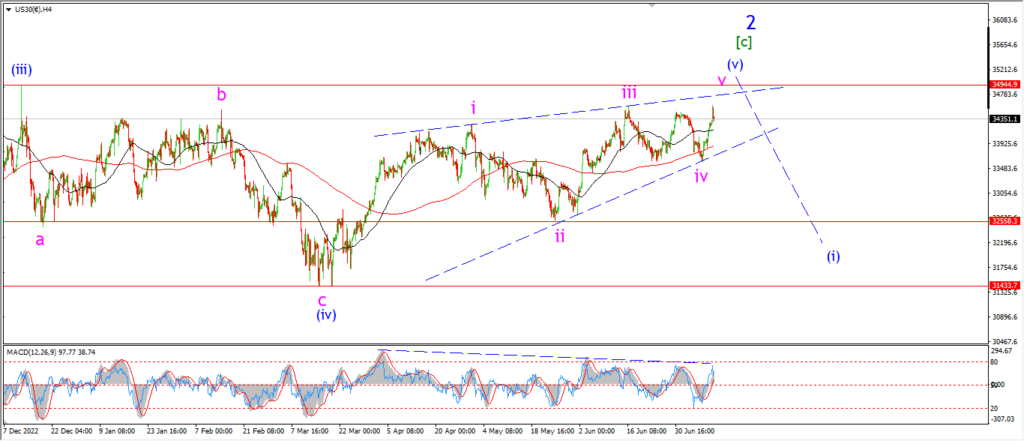
There is a small five wave pattern now closing out in wave ‘5’ of ‘v’ of (v) of [c].
and obviously that suggests another topping opportunity is upon us here.
We will see if the market will just blow off this pattern top and continue into something different.
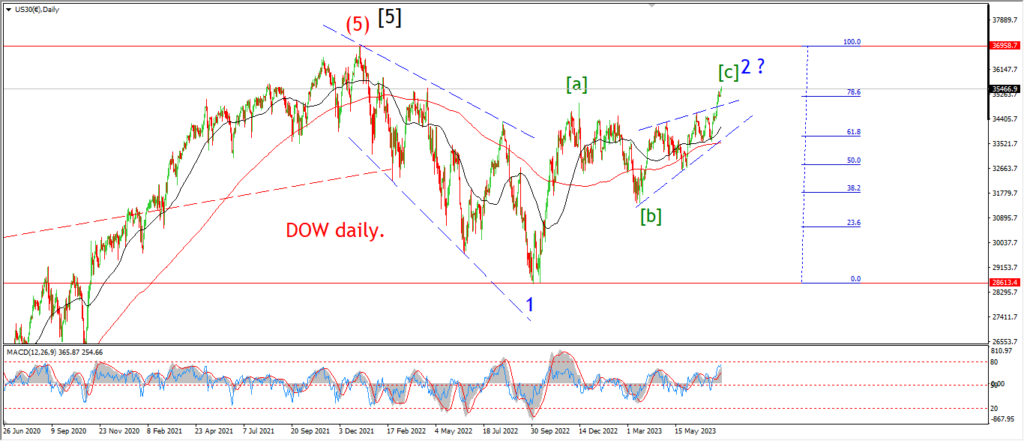
I have shown another possible interpretation of the overall pattern in the daily chart.
In this case the pattern is still topping out in wave ‘2’,
but the internal pattern is a little different.
Tomorrow;
The market is in sleep mode again this week as the conditions of a top are now at extremes not seen since the all time highs last year.
the reversal off wave ‘2’ will come,
but until something changes in the hourly chart there is very little to say at all!
Watch for this wave ‘v’ top to hit and then I will look for a decline back into the wedge trend lines.
GOLD
GOLD 1hr.
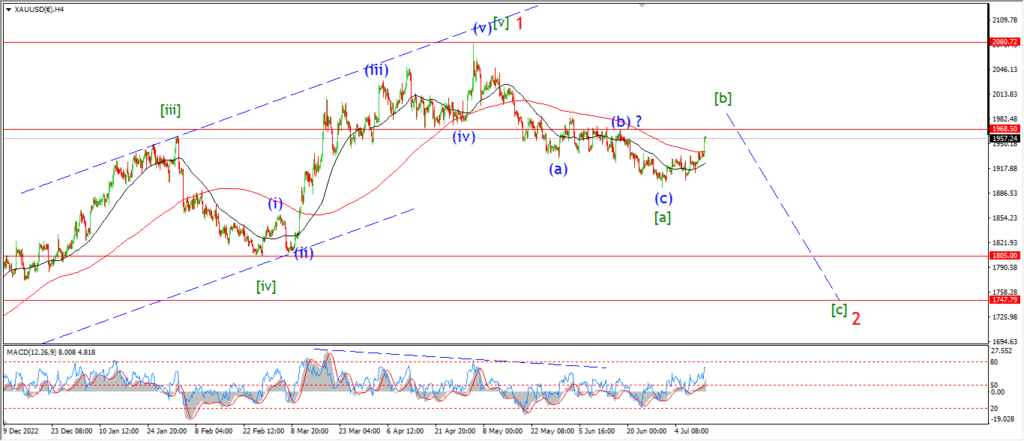
GOLD 4hr.
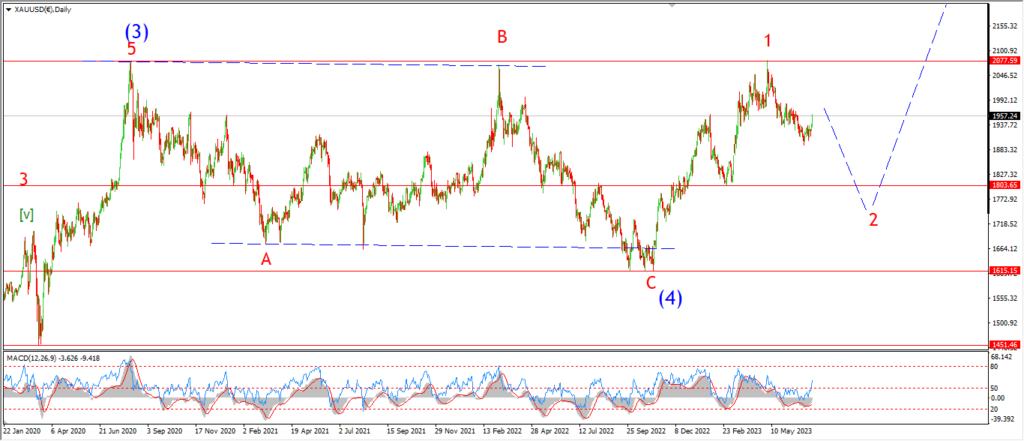
GOLD daily.
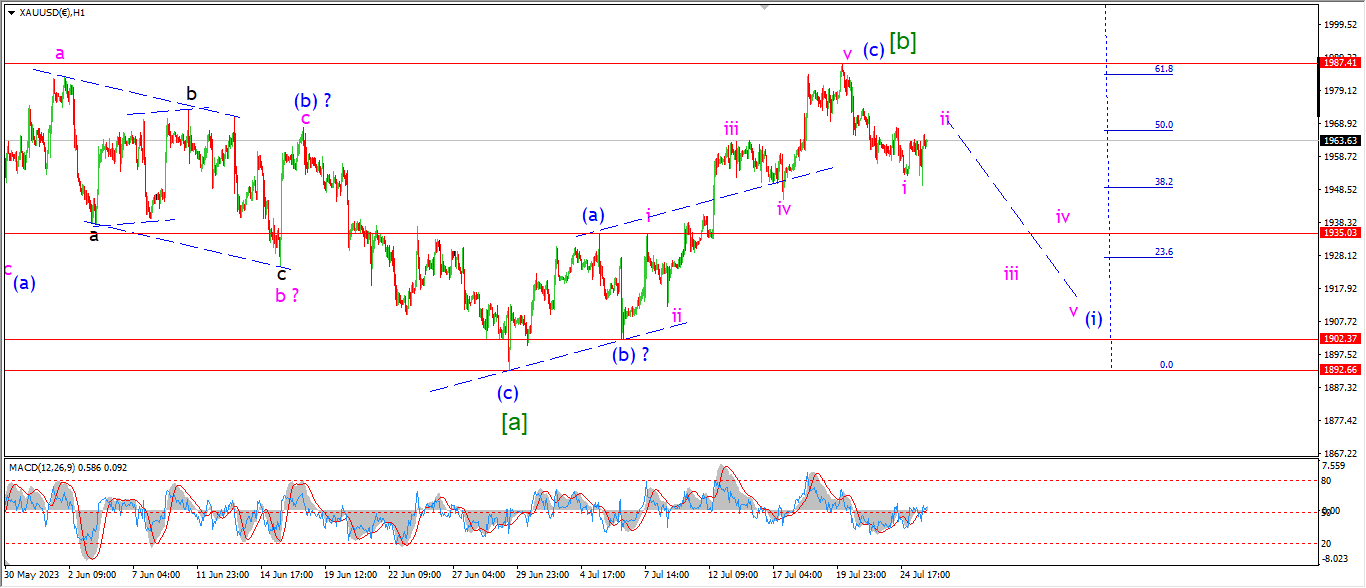
There is a possibility that wave ‘i’ and ‘ii’ is forming a bearish lower high tonight.
There is a small wave ‘ii’ expanded flat pattern developing in wave ‘ii’ even now.
This forms a nice head and shoulders pattern around the top at wave [b].
Wave (i) down must fall in five waves from here.
And I am suggesting a low in wave (i) neat 1910.
Tomorrow;
Watch for wave ‘ii’ to top and the price should fall back into wave ‘iii’ of (i).
If we see a break of 1935 again that will signal wave ‘iii’ is underway.
CRUDE OIL.
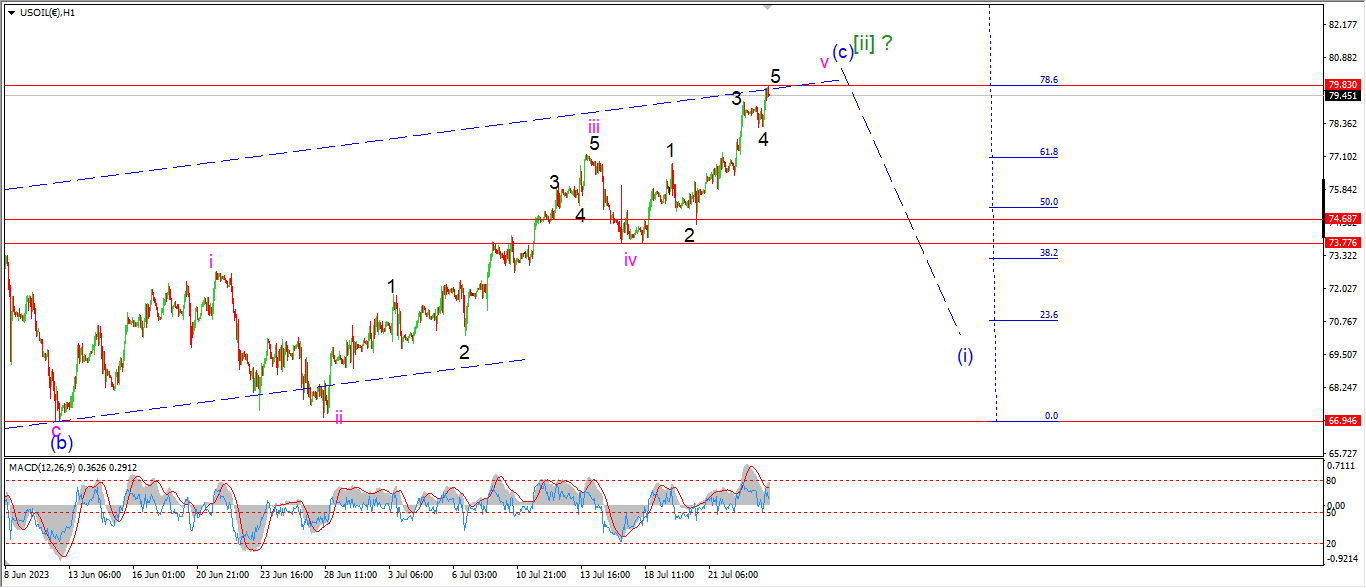
CRUDE OIL 1hr.
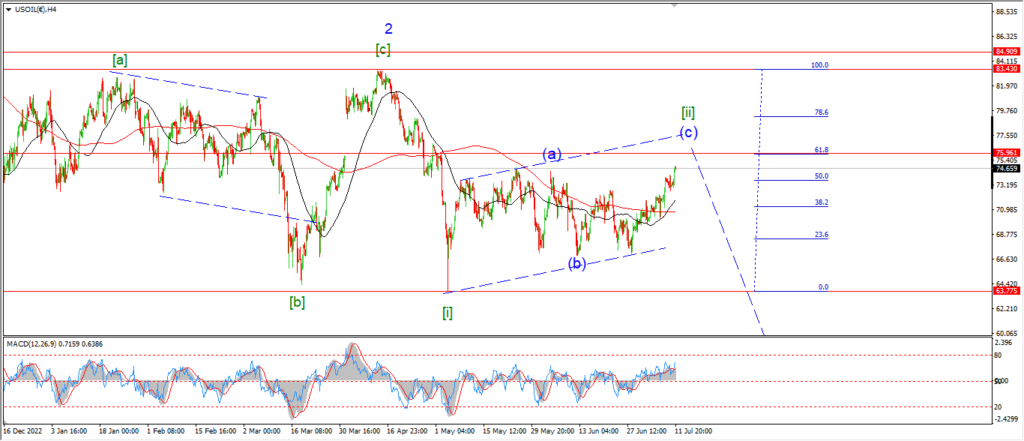
CRUDE OIL 4hr.
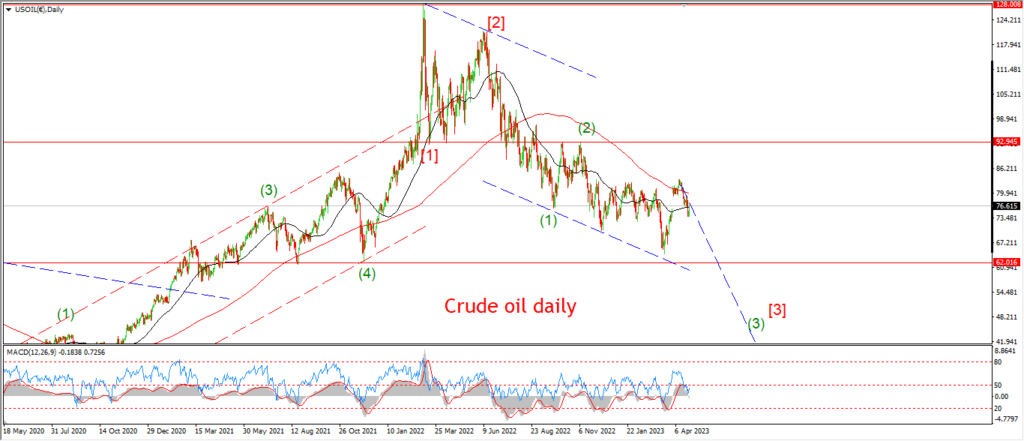
CRUDE OIL daily.
There is a cluster of supports in the price structure near the 74.00 handle now.
This is formed by the previous wave ‘iv’ of (c) and the wave (a) high.
I am suggesting that a solid decline back below that level again will signal wave (i) of [iii] is underway.
Tomorrow;
We have a five wave structure in wave ‘v’ now complete.
and the price has hit the trend channel line again at todays high.
Watch for wave ‘v’ to put in a top here and wave (i) down to turn lower from here.
S&P 500.
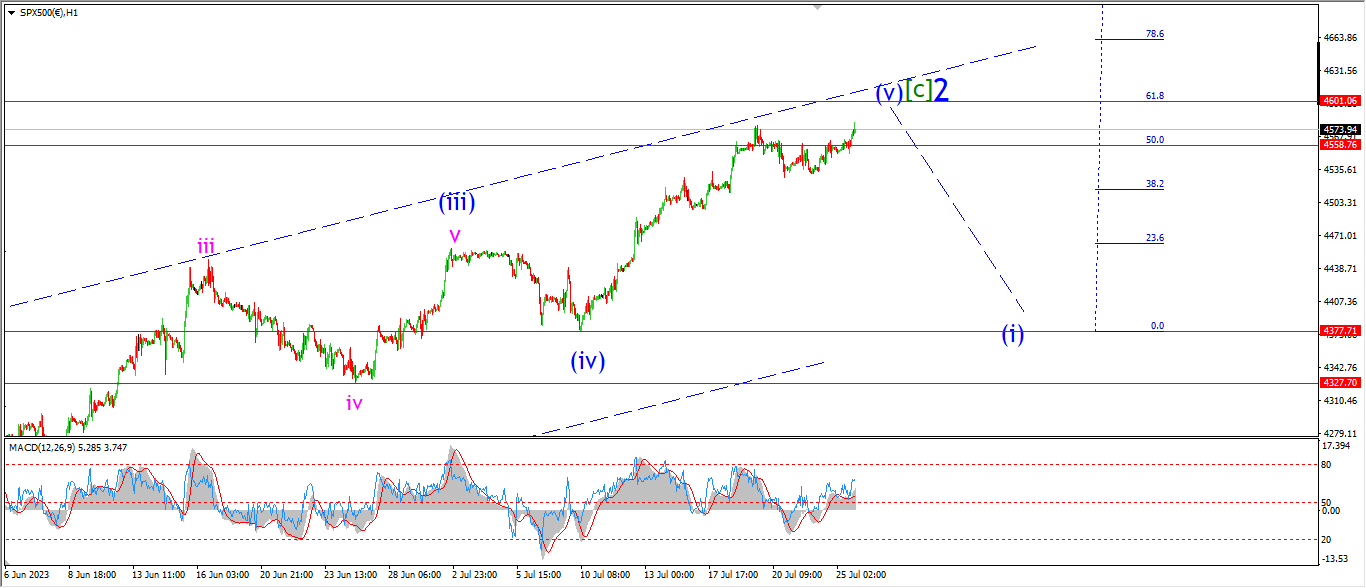
S&P 500 1hr
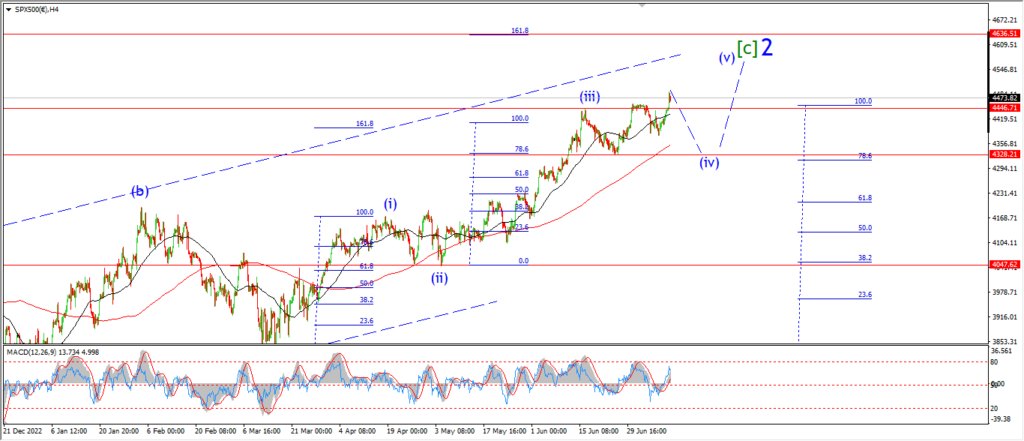
S&P 500 4hr
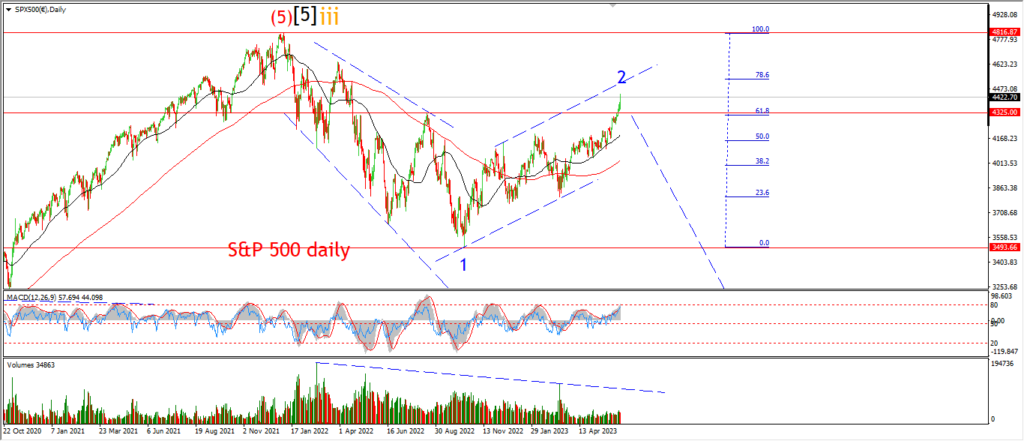
S&P 500 daily.
I am struggling to read much into this weeks action at the moment.
The price continues to hold at the top of wave (v) of [c] of ‘2’.
and todays highs have now confirmed another 12mth high for the S&P.
This comes with the backdrop of a completed three wave rally in wave ‘2’.
A rapidly declining economic picture.
A worsening employment picture,
A cracking commercial real estate market.
A frozen mortgage market.
Out rite monetary deflation in the broad measures.
A burgeoning world war developing.
Chinese economy is hitting the rocks.
Pretty much everything that could go wrong is all going wrong at the same time.
But for some reason,
people think the stock market is a safe haven from the developing storm.
Go figure!
Tomorrow;
Wave (v) of [c] has broken above the 50% Fib level of wave (i) and closing in on the 62% level.
The upper trend channel line is just above now at at about 4620.
What happens when a market is extended and stretched beyond all measures,
well it creats the conditions for a snap back decline off the top.
Wave (i) down should be in that ball park.
With a drop back under wave (iv) and 4377 on the cards.
Lets see how this final wave (v) develops over the coming few days.
SILVER.
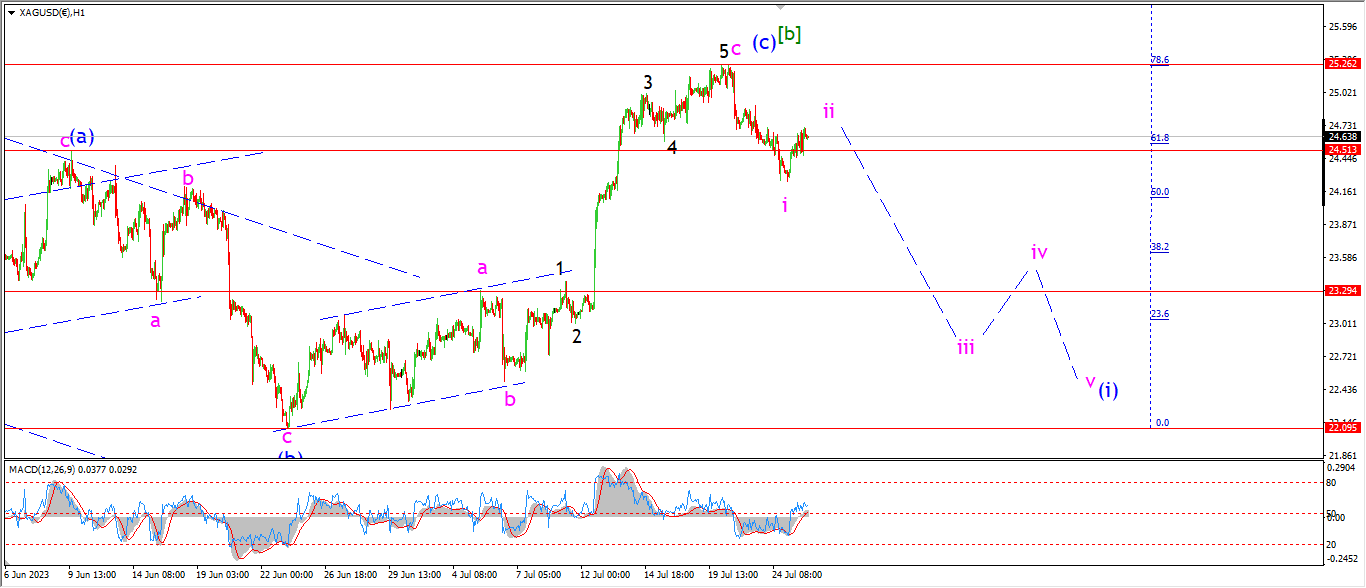
SILVER 1hr
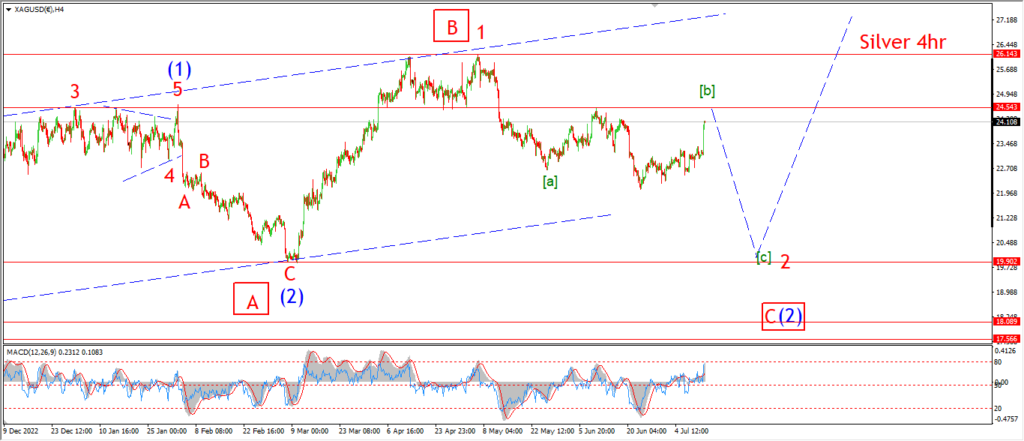
SILVER 4hr.
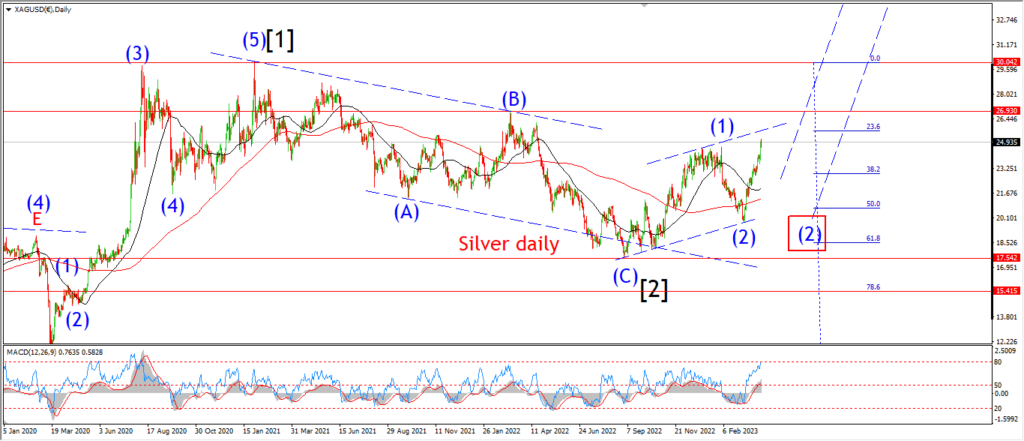
SILVER daily.
We have a small ‘i’ ‘ii’ pattern in the making here today.
The price is building a lower high off wave [b] now.
and once we see a break down below 23.30 again that will signal the top is in for wave [b] and wave (i) of [c] is underway.
Tomorrow;
Watch for this wave ‘ii’ lower high to complete.
Watch for a break of 24.00 again to signal that wave ‘iii’ has started.
BITCOIN
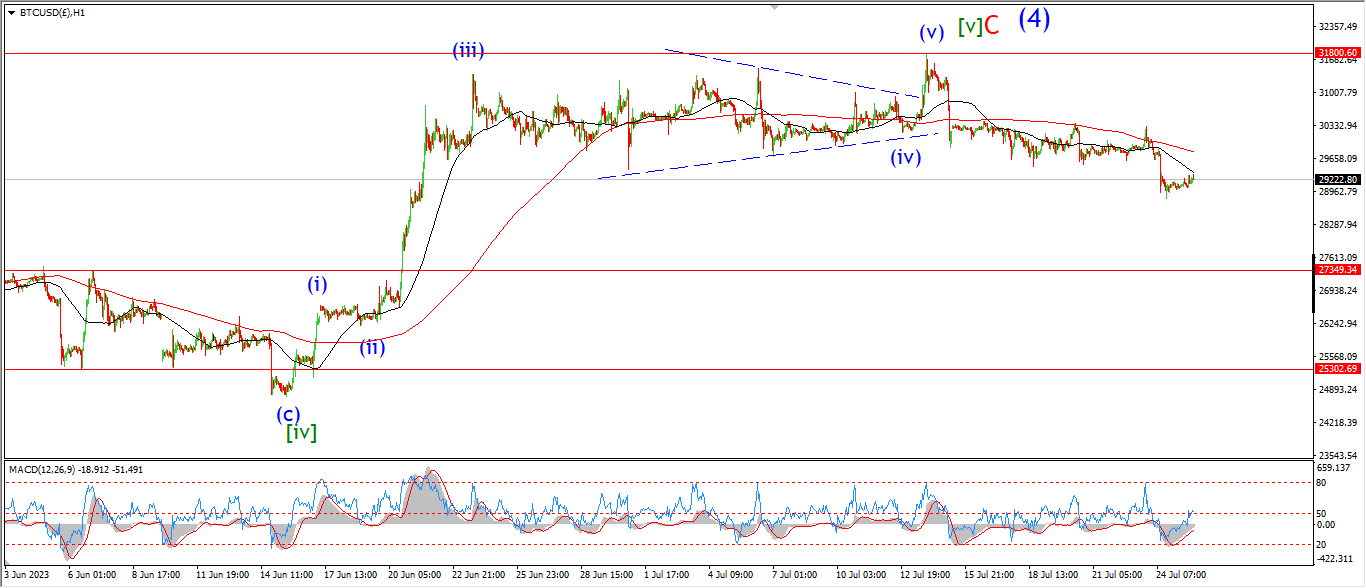
BITCOIN 1hr.
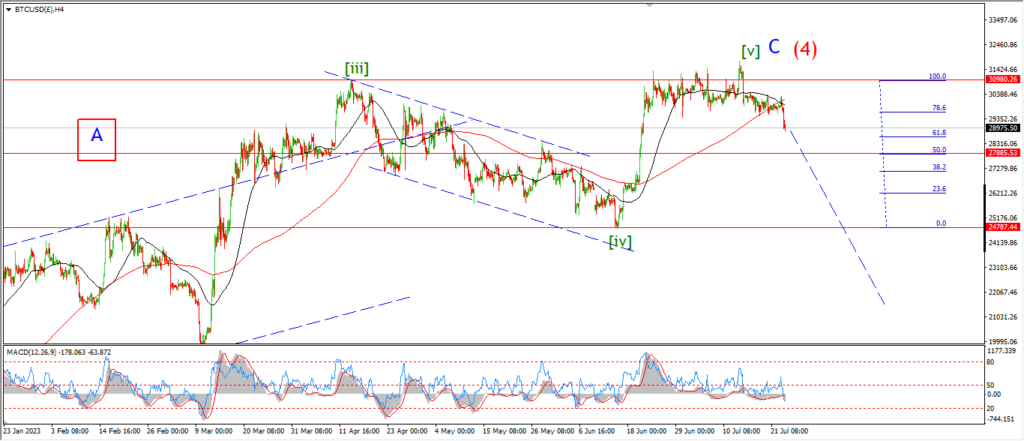
BITCOIN 4hr.
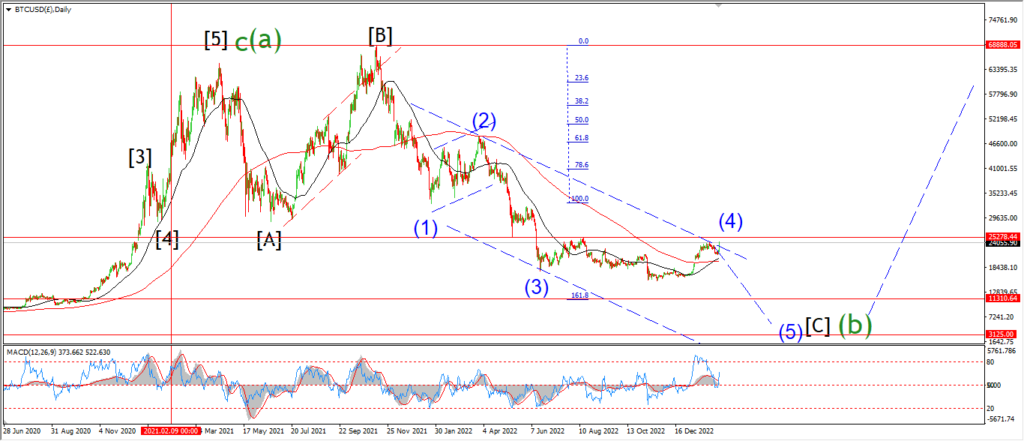
BITCOIN daily.
….
FTSE 100.
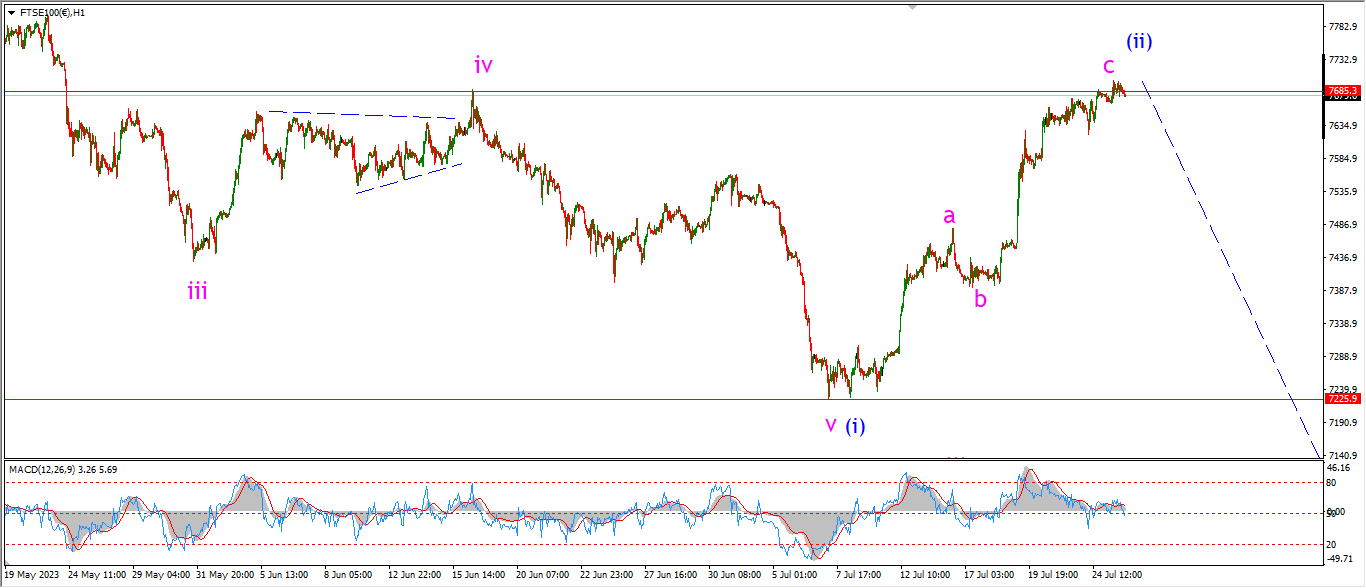
FTSE 100 1hr.
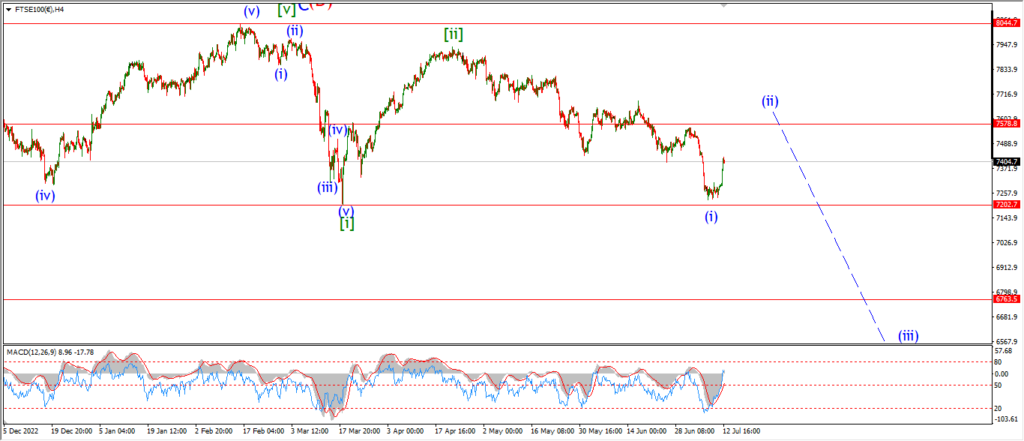
FTSE 100 4hr.
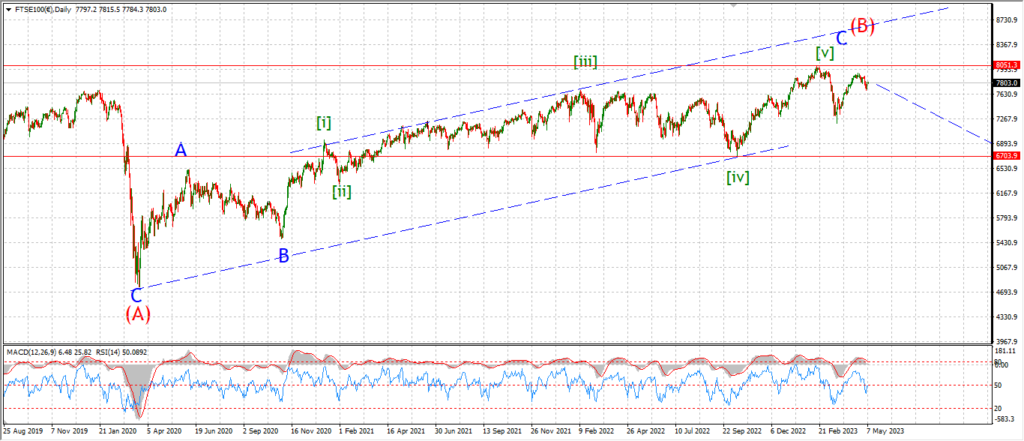
FTSE 100 daily.
….
DAX.
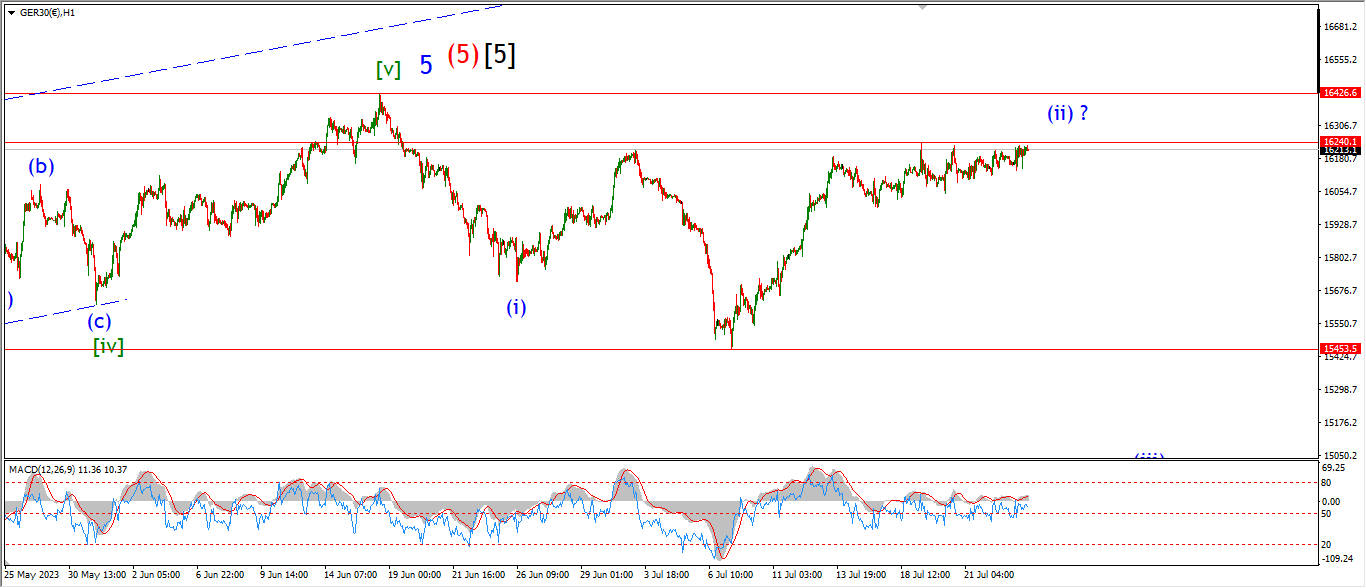
DAX 1hr
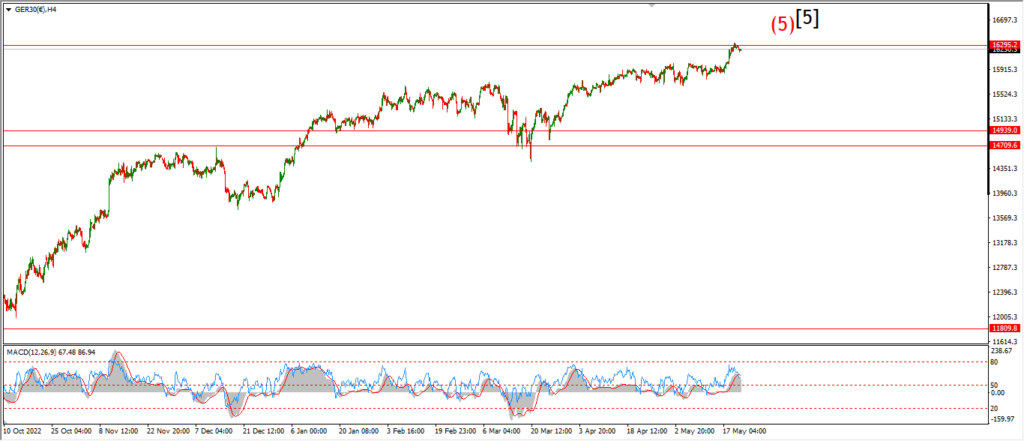
DAX 4hr
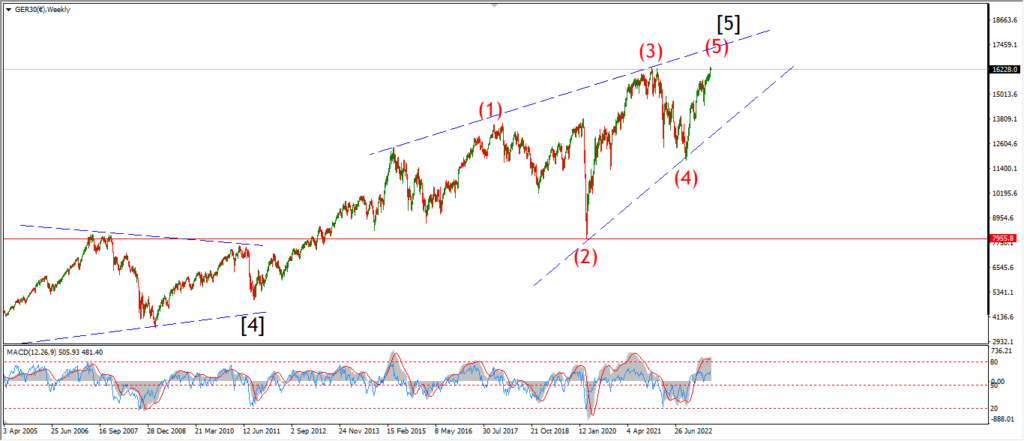
DAX daily.
….
NASDAQ 100.
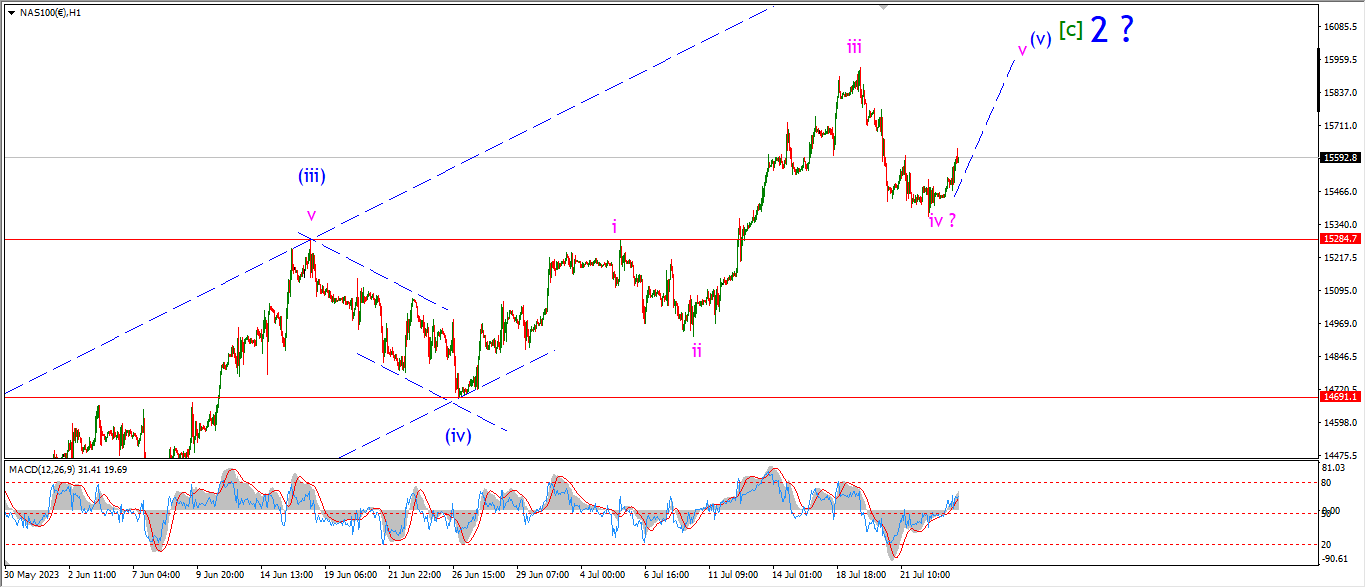
NASDAQ 1hr

NASDAQ 4hr.
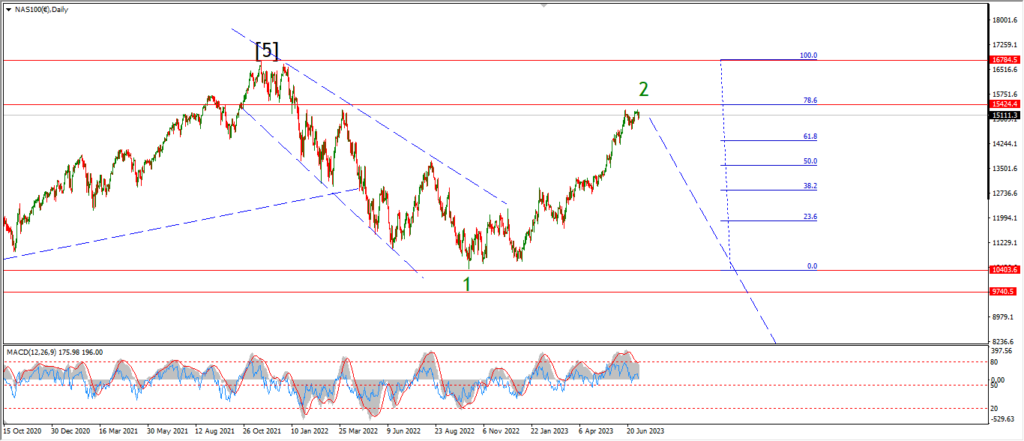
NASDAQ daily.
….