
[vc_row][vc_column][vc_separator border_width=”5″][/vc_column][/vc_row]
[vc_row][vc_column][vc_column_text]
Good evening all.
[/vc_column_text][/vc_column][/vc_row]
[vc_row][vc_column][vc_separator border_width=”5″][/vc_column][/vc_row]
[vc_row][vc_column][vc_column_text]
EURUSD
[/vc_column_text][/vc_column][/vc_row]
[vc_row][vc_column][vc_separator border_width=”5″][/vc_column][/vc_row][vc_row][vc_column width=”2/3″][vc_custom_heading text=”1 hr” use_theme_fonts=”yes”][vc_column_text]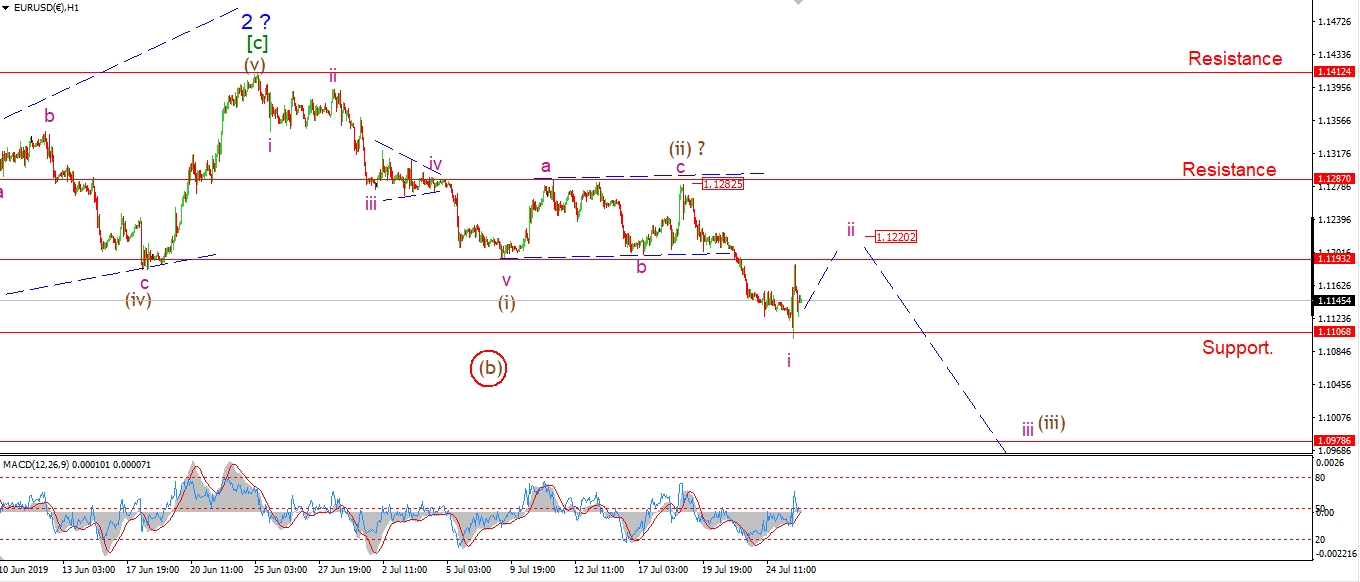 [/vc_column_text][/vc_column][vc_column width=”1/3″][vc_custom_heading text=”4 Hours” use_theme_fonts=”yes”][vc_column_text]
 [/vc_column_text][vc_custom_heading text=”Daily” use_theme_fonts=”yes”][vc_column_text]
 [/vc_column_text][/vc_column][/vc_row]
[vc_row][vc_column][vc_column_text]
EURUSD has broken through the lower resistance level at 1.1106 today.
this is a key level in the longer term pattern for the EURO,
even though this was only a momentary break,
it does go a long way to confirming that wave ‘3’ blue is now underway.
Wave ‘i’ pink is now complete at todays low.
And wave ‘ii’ is now underway with that spike higher this afternoon.
Wave ‘ii’ should now create a three wave correction to a lower high below 1.1282 at wave (ii).
Tomorrow;
Watch for wave ‘ii’ to complete tomorrow.
Wave ‘iii’ of (iii) should be ready to go much lower next week.
[/vc_column_text][/vc_column][/vc_row]
[vc_row][vc_column][vc_separator border_width=”5″][/vc_column][/vc_row][vc_row][vc_column][vc_column_text]
GBPUSD
[/vc_column_text][/vc_column][/vc_row][vc_row][vc_column][vc_separator border_width=”5″][/vc_column][/vc_row][vc_row][vc_column width=”2/3″][vc_custom_heading text=”1 hr” use_theme_fonts=”yes”][vc_column_text]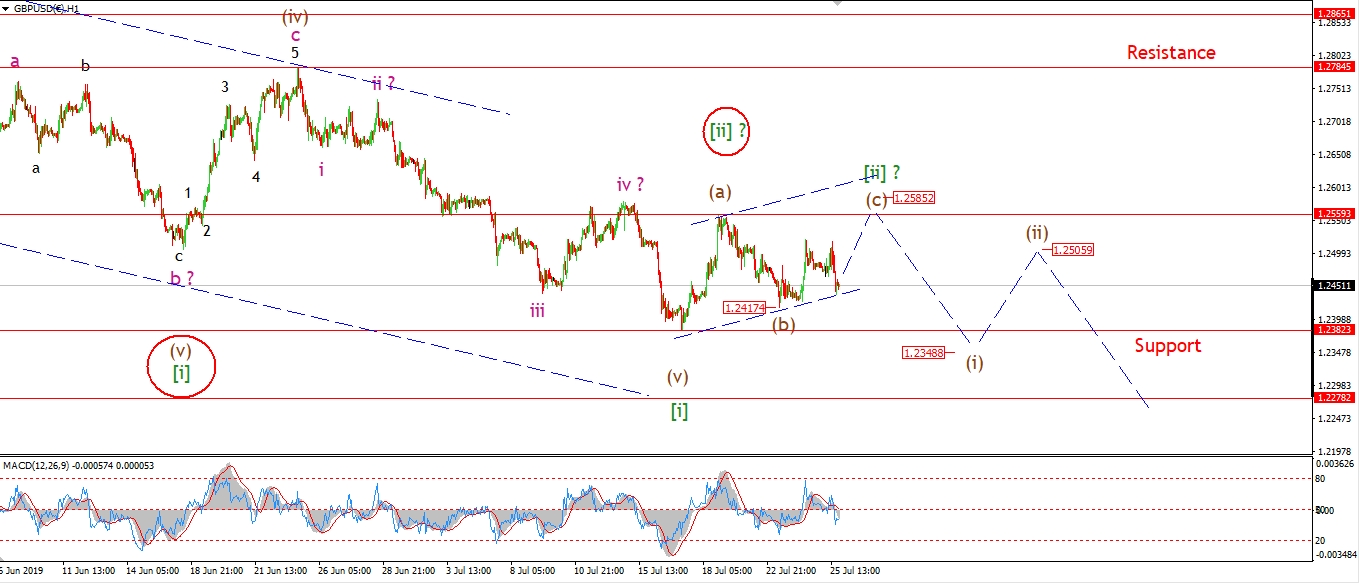 [/vc_column_text][/vc_column][vc_column width=”1/3″][vc_custom_heading text=”4 Hours” use_theme_fonts=”yes”][vc_column_text]
 [/vc_column_text][vc_custom_heading text=”Daily” use_theme_fonts=”yes”][vc_column_text]
 [/vc_column_text][/vc_column][/vc_row]
[vc_row][vc_column][vc_column_text]
Cable has fallen off Wednesdays high in a three wave form so far.
This action suggests that wave (c) is either tracing out a three wave move higher to complete wave [ii] at 1.2580.
This would classify wave [ii] as a combination correction
Or,
wave (b) is still ongoing and as a contracting triangle.
In which case the range will contract for the next few days.
In both cases wave [ii] will complete early next week,
and wave [iii] down will resume the longer term trend to the downside.
Tomorrow;
Watch for wave (c) to complete with a break of 1.2560 before turning lower again next week.
[/vc_column_text][/vc_column][/vc_row]
[vc_row][vc_column][vc_separator border_width=”5″][/vc_column][/vc_row][vc_row][vc_column][vc_column_text]
USDJPY
[/vc_column_text][/vc_column][/vc_row][vc_row][vc_column][vc_separator border_width=”5″][/vc_column][/vc_row][vc_row][vc_column width=”2/3″][vc_custom_heading text=”1 hr” use_theme_fonts=”yes”][vc_column_text]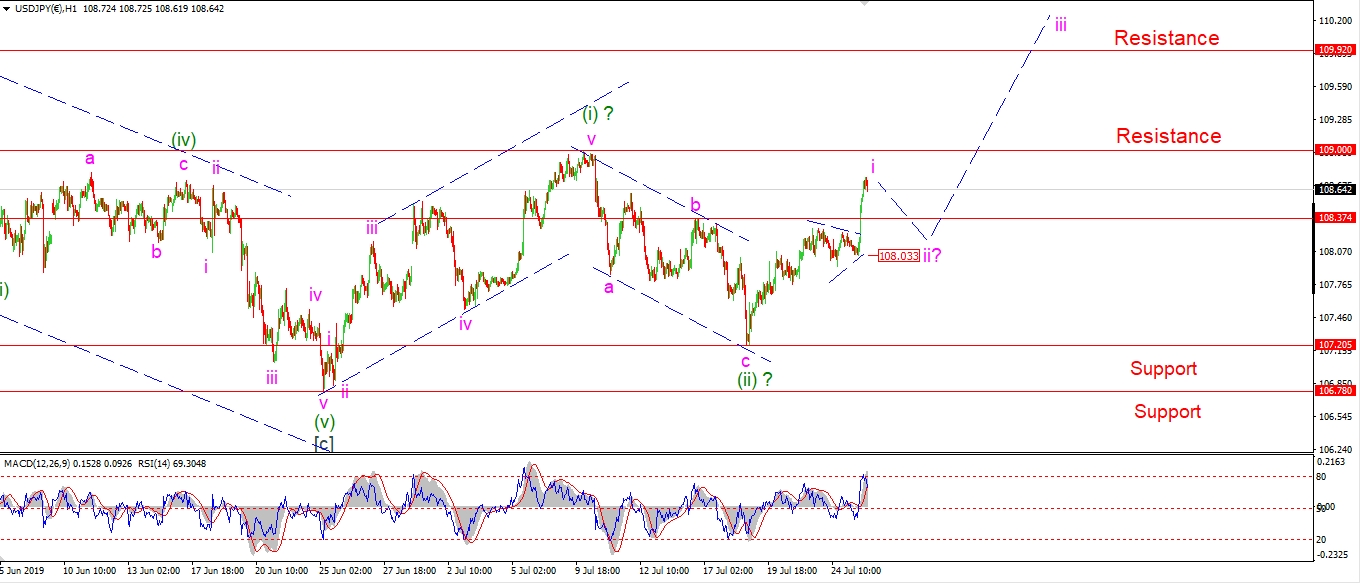 [/vc_column_text][/vc_column][vc_column width=”1/3″][vc_custom_heading text=”4 Hours” use_theme_fonts=”yes”][vc_column_text]
 [/vc_column_text][vc_custom_heading text=”Daily” use_theme_fonts=”yes”][vc_column_text]
 [/vc_column_text][/vc_column][/vc_row]
[vc_row][vc_column][vc_column_text]
Now we have some confirming price action to work with!
The rally today seems to have occurred out of a small triangle.
This wave form explains the slow trade this week!
If this is a thrust from a triangle though,
we can expect todays highs to be the end of wave ‘i’ pink,
wave ‘ii’ pink will now begin from nearby highs and correct back towards 108.00 again.
If this pattern completes as I expect,
then we will have a bullish signal in place at the end of wave ‘ii’.
Ready for a run higher in wave ‘iii’.
Tomorrow;
watch for wave ‘ii’ to begin a three wave correction with a target at 108.00.
[/vc_column_text][/vc_column][/vc_row]
[vc_row][vc_column][vc_separator border_width=”5″][/vc_column][/vc_row][vc_row][vc_column][vc_column_text]
DOW JONES INDUSTRIALS
[/vc_column_text][/vc_column][/vc_row][vc_row][vc_column][vc_separator border_width=”5″][/vc_column][/vc_row][vc_row][vc_column width=”2/3″][vc_custom_heading text=”1 hr” use_theme_fonts=”yes”][vc_column_text]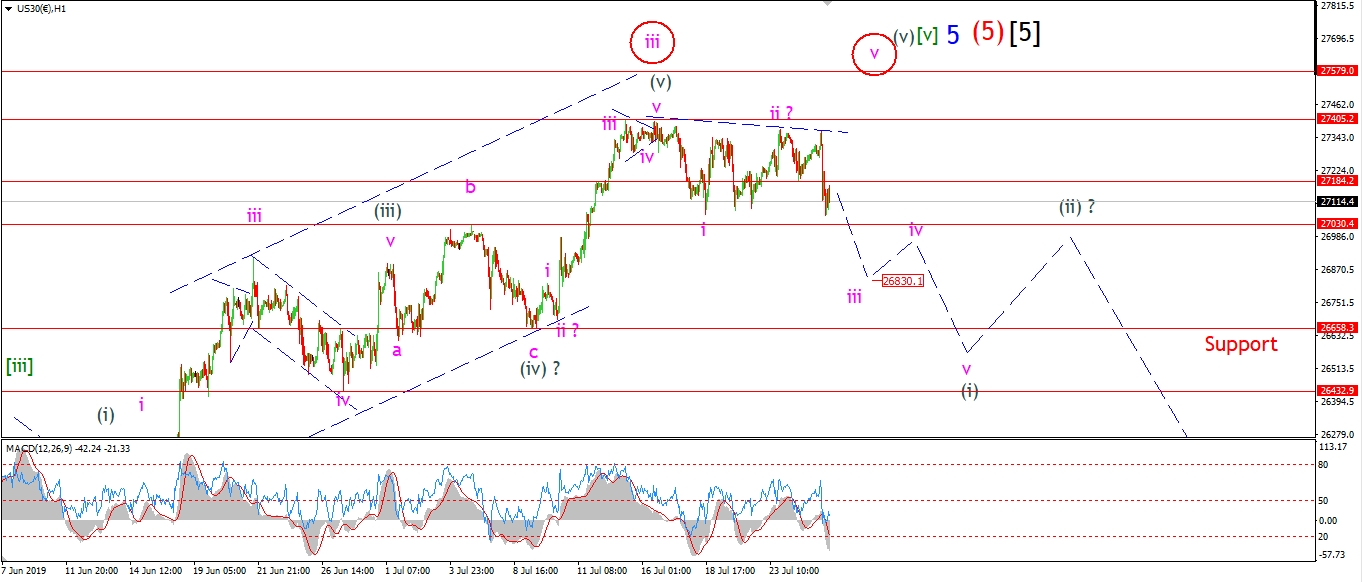 [/vc_column_text][/vc_column][vc_column width=”1/3″][vc_custom_heading text=”4 Hours” use_theme_fonts=”yes”][vc_column_text]
 [/vc_column_text][vc_custom_heading text=”Daily” use_theme_fonts=”yes”][vc_column_text]
 [/vc_column_text][/vc_column][/vc_row]
[vc_row][vc_column][vc_column_text]
The bearish pattern is still in place for the DOW after a sharp move lower today.
The decline off the high is still possible to read as a three wave correction,
but I think we will see a larger five wave move develop in wave (i) down over the coming week.
And that action will signal the trend is changing.
Wave ‘iii’ of (i) should hit 26830 in a clear five wave form by early next week.
This level is where wave ‘iii’ reaches 162% of wave ‘i’ pink.
Adn if that happens,
it will more or less rule out the alternate count I have shown.
Next week is again looking crucial for the development of a major turning point in the stock market.
Five waves down is the key.
Tomorrow;
Watch for wave ‘iii’ of (i) to hold below 27180 and break below 27000 again.
Lets see if we can finish the week on a negative note as we build towards the larger sell signal at wave (ii) next week.
[/vc_column_text][/vc_column][/vc_row]
[vc_row][vc_column][vc_separator border_width=”5″][/vc_column][/vc_row][vc_row][vc_column][vc_column_text]
GOLD
[/vc_column_text][/vc_column][/vc_row][vc_row][vc_column][vc_separator border_width=”5″][/vc_column][/vc_row][vc_row][vc_column width=”2/3″][vc_custom_heading text=”1 hr” use_theme_fonts=”yes”][vc_column_text]
 [/vc_column_text][/vc_column][vc_column width=”1/3″][vc_custom_heading text=”4 Hours” use_theme_fonts=”yes”][vc_column_text]
 [/vc_column_text][vc_custom_heading text=”Daily” use_theme_fonts=”yes”][vc_column_text]
 [/vc_column_text][/vc_column][/vc_row]
[vc_row][vc_column][vc_column_text]
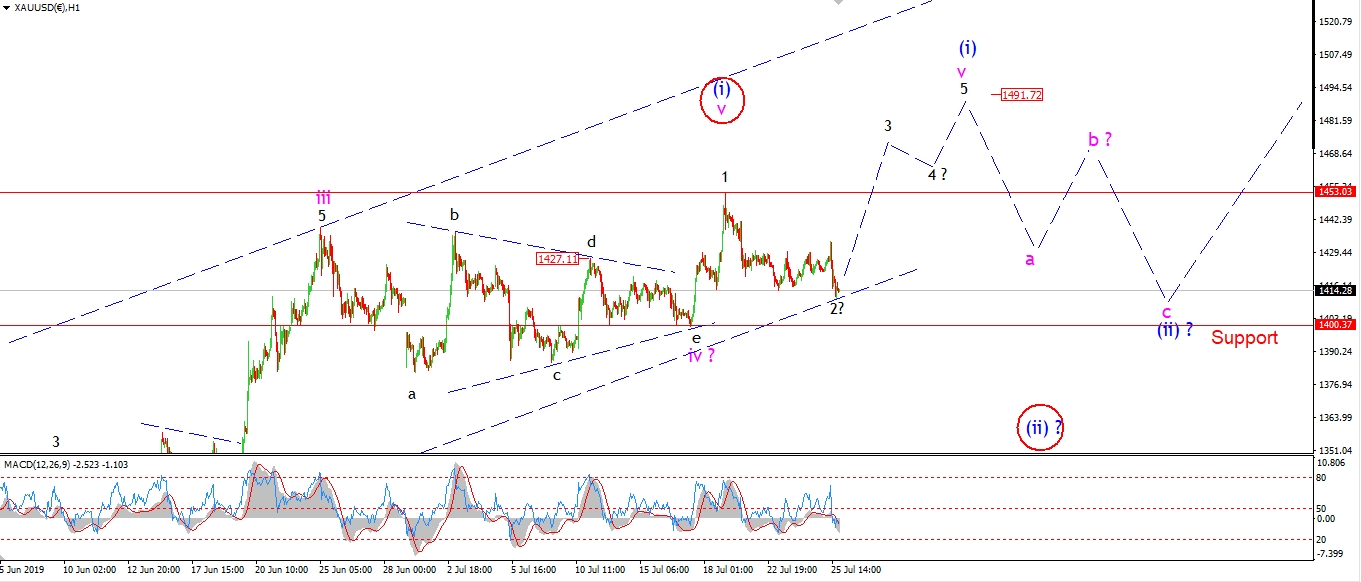
Gold must turn higher tomorrow to keep the short term bullish pattern alive for wave ‘v’.
The price has fallen off the high at wave ‘1’ in a three wave form so far,
and so this action can still be classified as a correction.
Only a break of 1400 will rule out the higher target for wave (i) at about 1500.
So 1400 is key to deciding the short term count
and signalling the beginning of wave (ii) blue.
Tomorrow;
Watch for wave ‘2’ to hold above 1400 again and turn higher into wave ‘3’ of ‘v’.
[/vc_column_text][/vc_column][/vc_row]
[vc_row][vc_column][vc_separator border_width=”5″][/vc_column][/vc_row][vc_row][vc_column][vc_column_text]
U.S CRUDE OIL
[/vc_column_text][/vc_column][/vc_row][vc_row][vc_column][vc_separator border_width=”5″][/vc_column][/vc_row][vc_row][vc_column width=”2/3″][vc_custom_heading text=”1 hr” use_theme_fonts=”yes”][vc_column_text]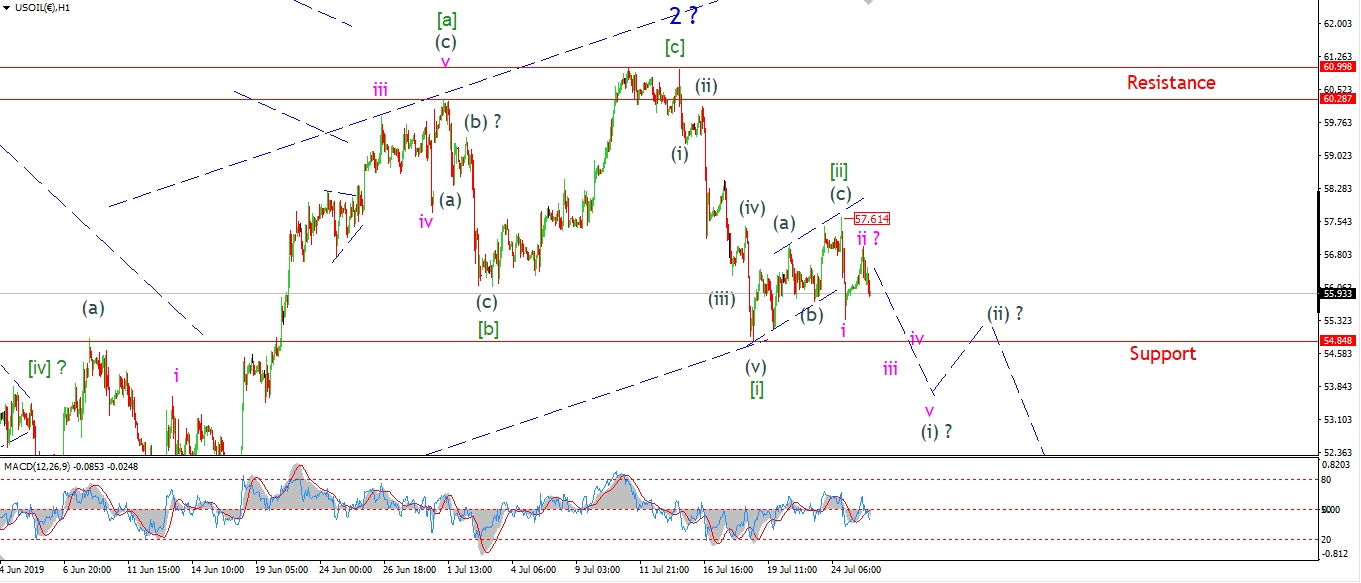 [/vc_column_text][/vc_column][vc_column width=”1/3″][vc_custom_heading text=”4 Hours” use_theme_fonts=”yes”][vc_column_text]
 [/vc_column_text][vc_custom_heading text=”Daily” use_theme_fonts=”yes”][vc_column_text]
 [/vc_column_text][/vc_column][/vc_row]
[vc_row][vc_column][vc_column_text]
Crude created a smaller lower high this afternoon.
This is labelled wave ‘ii’ pink,
and the price is again falling this evening as we hit the close now.
The lower wave [i] green has not been broken just yet,
but this should happen in wave (i) of [iii] quite soon.
If the short term pattern is correct,
then we should see another bearish lower high form in wave (ii) grey next week.
This will offer the best opportunity to catch wave (iii) of [iii] down which should follow.
Tomorrow;
Watch for wave (i) to continue lower and break 54.80 in wave ‘iii’ pink as shown.
[/vc_column_text][/vc_column][/vc_row]
[vc_row][vc_column][vc_separator border_width=”5″][/vc_column][/vc_row][vc_row][vc_column][vc_column_text]
US 10 yr Treasuries.
[/vc_column_text][/vc_column][/vc_row][vc_row][vc_column][vc_separator border_width=”5″][/vc_column][/vc_row][vc_row][vc_column width=”2/3″][vc_custom_heading text=”1 hr” use_theme_fonts=”yes”][vc_column_text]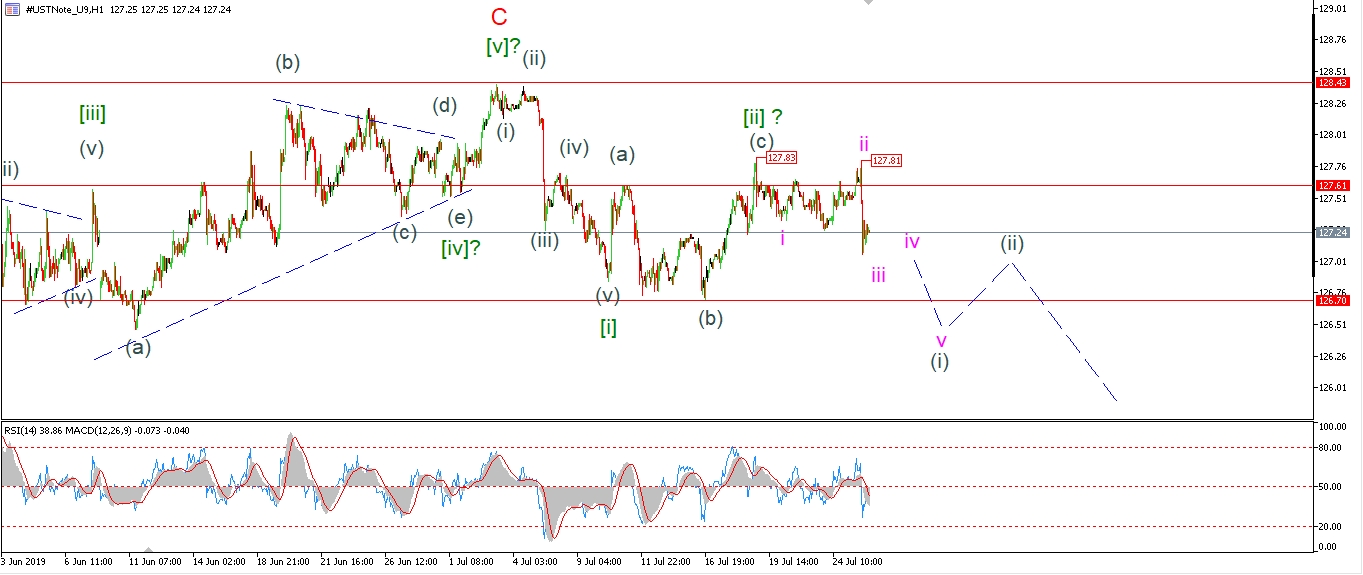 [/vc_column_text][/vc_column][vc_column width=”1/3″][vc_custom_heading text=”4 Hours” use_theme_fonts=”yes”][vc_column_text]
 [/vc_column_text][vc_custom_heading text=”Daily” use_theme_fonts=”yes”][vc_column_text]
 [/vc_column_text][/vc_column][/vc_row]
[vc_row][vc_column][vc_column_text]
We did not make a new high in wave (c) as expected today.
The market reached 127.81 before falling sharply to begin the larger wave [iii] down as shown.
I have changed the short term count back to the previous configuration.
So it is possible that todays decline is part of wave ‘iii’ of (i) to the downside.
We must see further declines build from here in wave (i),
and a break of 126.70 to create a bearish signal off the high.
Tomorrow;
Watch for wave ‘iii’ of (i) to continue lower.
127.81 should now hold.
[/vc_column_text][/vc_column][/vc_row]
[vc_row][vc_column][vc_separator border_width=”5″][/vc_column][/vc_row][vc_row][vc_column][vc_column_text]
SILVER
[/vc_column_text][/vc_column][/vc_row][vc_row][vc_column][vc_separator border_width=”5″][/vc_column][/vc_row][vc_row][vc_column width=”2/3″][vc_custom_heading text=”1 hr” use_theme_fonts=”yes”][vc_column_text]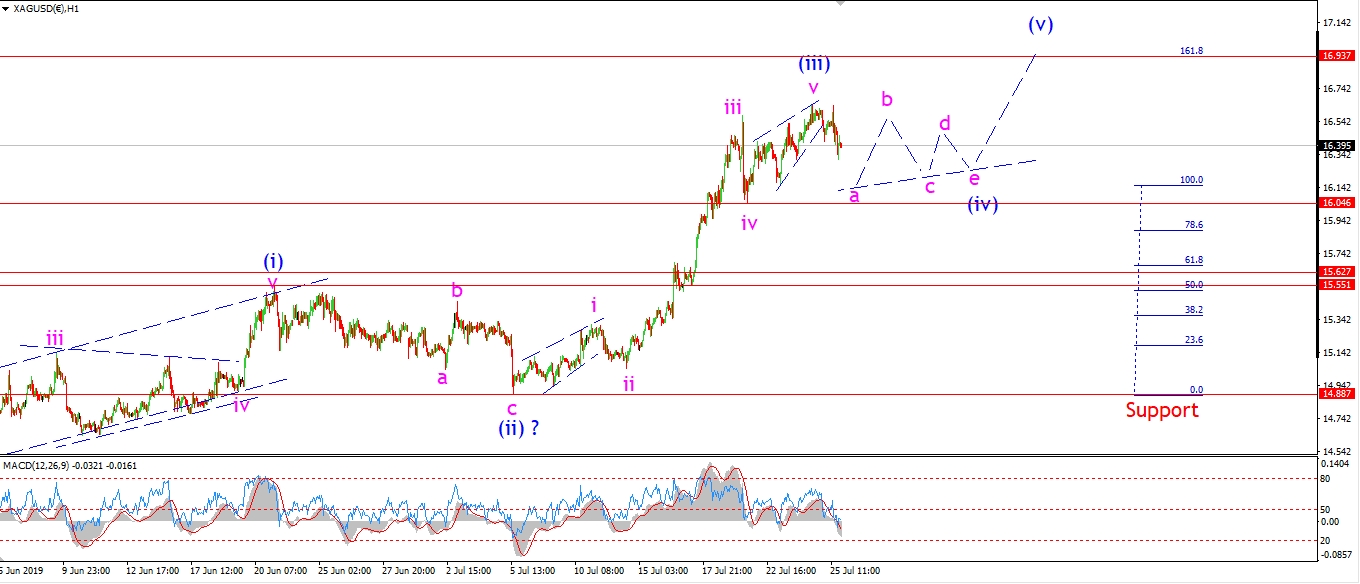 [/vc_column_text][/vc_column][vc_column width=”1/3″][vc_custom_heading text=”4 Hours” use_theme_fonts=”yes”][vc_column_text]
 [/vc_column_text][vc_custom_heading text=”Daily” use_theme_fonts=”yes”][vc_column_text]
 [/vc_column_text][/vc_column][/vc_row]
[vc_row][vc_column][vc_column_text]
Silver has fallen in three waves off Wednesdays high.
this forms the initial move lower in wave (iv) blue as shown.
It is impossible to know what form wave (iv) will take,
but it should be a consolidation move to hold on to much of the gains,
and a triangle will serve that purpose.
Wave (ii) blue was a flat correction,
so the guideline of alteration between corrective waves suggests a triangle also.
We will see soon enough.
Tomorrow;
Watch for wave ‘a’ of (iv) to continue towards 16.00 to complete the first leg down in wave (iv).
[/vc_column_text][/vc_column][/vc_row]
[vc_row][vc_column][vc_separator border_width=”5″][/vc_column][/vc_row][vc_row][vc_column][vc_column_text]
S&P 500.
[/vc_column_text][/vc_column][/vc_row][vc_row][vc_column][vc_separator border_width=”5″][/vc_column][/vc_row][vc_row][vc_column width=”2/3″][vc_custom_heading text=”1 hr” use_theme_fonts=”yes”][vc_column_text]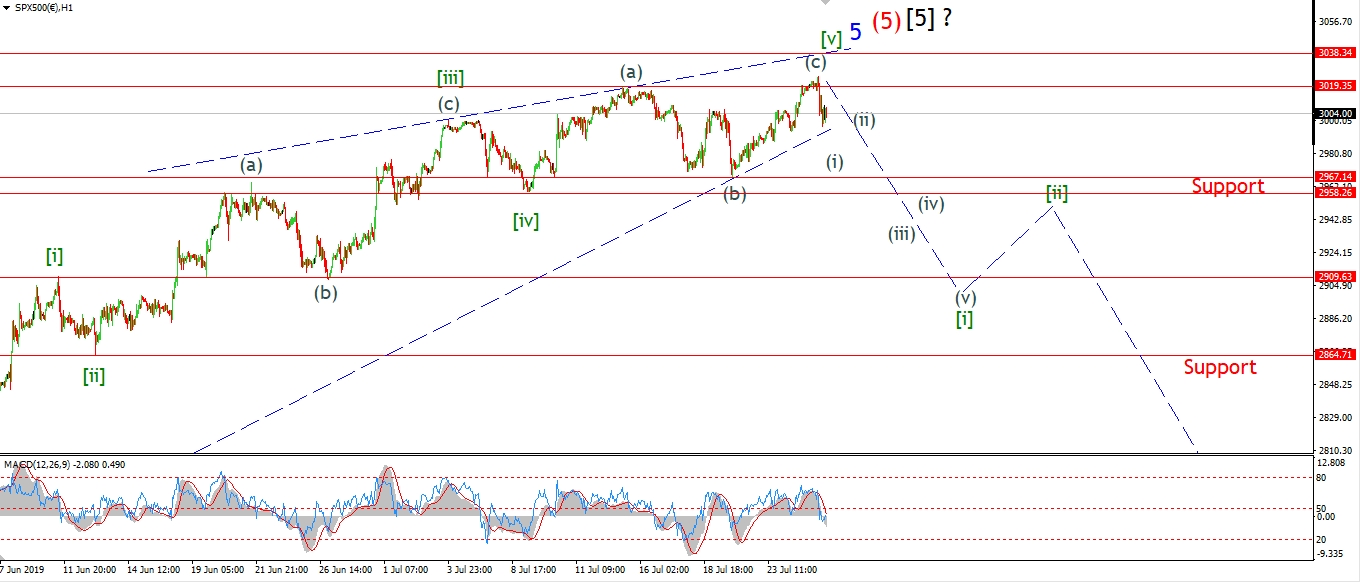 [/vc_column_text][/vc_column][vc_column width=”1/3″][vc_custom_heading text=”4 Hours” use_theme_fonts=”yes”][vc_column_text]
 [/vc_column_text][vc_custom_heading text=”Daily” use_theme_fonts=”yes”][vc_column_text]
 [/vc_column_text][/vc_column][/vc_row]
[vc_row][vc_column][vc_column_text]
Last night the final high registered for the S&P was 3019.35.
This was a new all time high,
as expected for wave (c) to complete wave [v].
And the market has fallen back today in a possible five wave form off that high.
So,
at this moment, I am marking this level as the the top for the bull market off the 2009 low.
Its been a long one,
but it is bound to end at some point!
The market must now continue falling from here,
to create a larger five wave move lower in wave [i] down as shown.
Wave [i] down should break 2900 again with ease.
And this action will signal the market has indeed topped out for good this time.
Tomorrow;
One step at a time now.
Watch for the high to hold at 3019,
and a continuation lower to build in wave (i) of [i] for the rest of Friday and Monday.
[/vc_column_text][/vc_column][/vc_row]
[vc_row][vc_column][vc_separator border_width=”5″][/vc_column][/vc_row]