
[vc_row][vc_column][vc_separator border_width=”5″][/vc_column][/vc_row]
[vc_row][vc_column][vc_column_text]
Hi there everyone.
I made it back to home shores!
The ferry ride last night was a bit of a nightmare,
sea sickness all round!
but I’m home and life goes back to normal.
That includes sitting in my swivel chair looking out at the back garden while I write this update!
Thank God for the small things in life!
Down to it then.
[/vc_column_text][/vc_column][/vc_row]
[vc_row][vc_column][vc_separator border_width=”5″][/vc_column][/vc_row]
[vc_row][vc_column][vc_column_text]
EURUSD
[/vc_column_text][/vc_column][/vc_row]
[vc_row][vc_column][vc_separator border_width=”5″][/vc_column][/vc_row][vc_row][vc_column width=”2/3″][vc_custom_heading text=”1 hr” use_theme_fonts=”yes”][vc_column_text]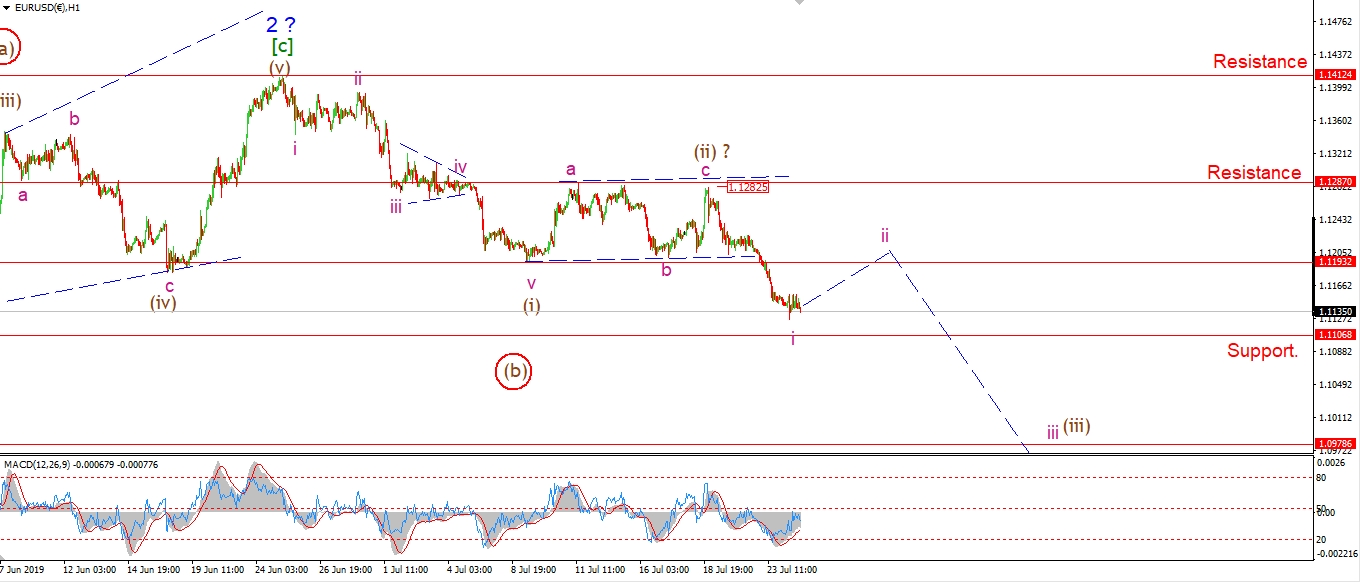 [/vc_column_text][/vc_column][vc_column width=”1/3″][vc_custom_heading text=”4 Hours” use_theme_fonts=”yes”][vc_column_text]
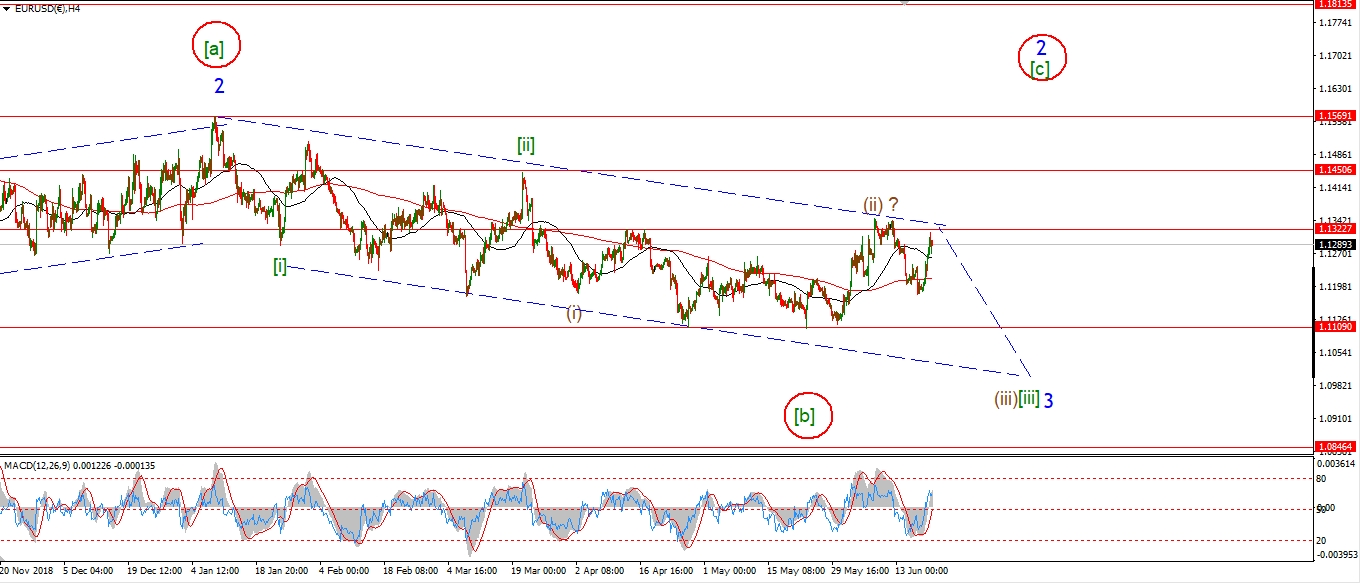 [/vc_column_text][vc_custom_heading text=”Daily” use_theme_fonts=”yes”][vc_column_text]
 [/vc_column_text][/vc_column][/vc_row]
[vc_row][vc_column][vc_column_text]
The running flat idea for wave (ii) is right on the money it seems,
as EURUSD is making a ‘b’ line for the lower support at 1.1106 now.
If we break that level,
then we can confirm that the larger wave ‘3’ blue is underway.
For the moment this lower level is offering some support to the market today.
I would like to see wave ‘i’ of (iii) break through that level before correcting in wave ‘ii’.
but we will have to wait and see on that front.
Tomorrow;
watch for wave ‘i’ of (iii) to find a low possibly after breaking support at 1.1106.
Wave ‘ii’ should begin a three wave correction by tomorrow afternoon.
[/vc_column_text][/vc_column][/vc_row]
[vc_row][vc_column][vc_separator border_width=”5″][/vc_column][/vc_row][vc_row][vc_column][vc_column_text]
GBPUSD
[/vc_column_text][/vc_column][/vc_row][vc_row][vc_column][vc_separator border_width=”5″][/vc_column][/vc_row][vc_row][vc_column width=”2/3″][vc_custom_heading text=”1 hr” use_theme_fonts=”yes”][vc_column_text]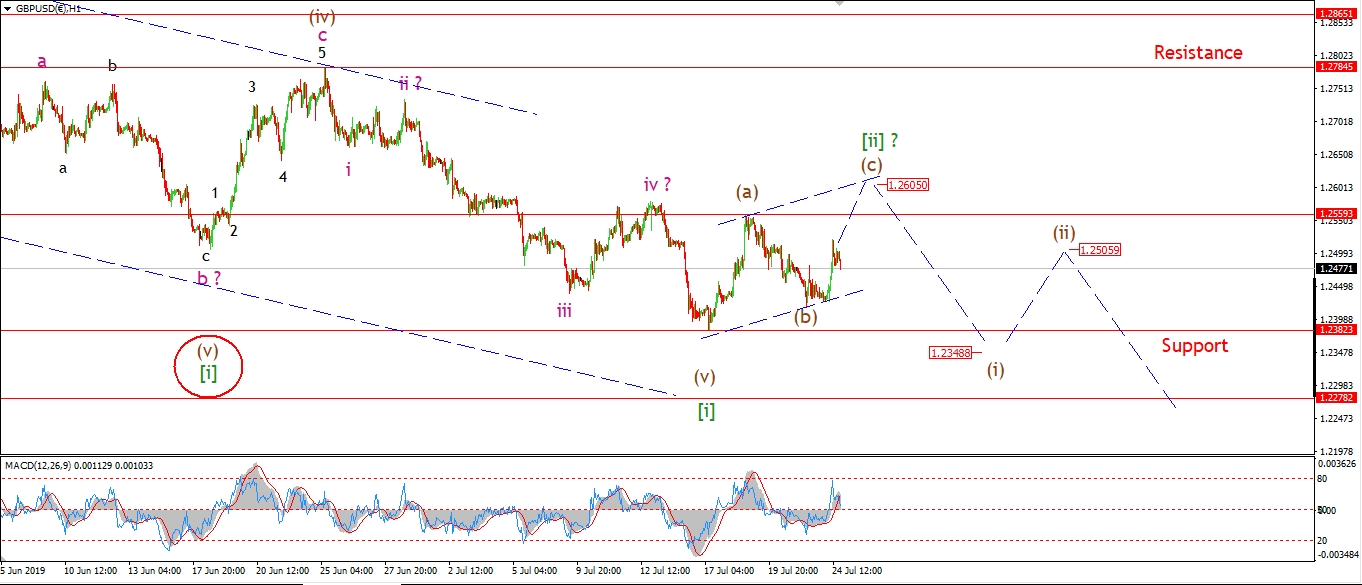 [/vc_column_text][/vc_column][vc_column width=”1/3″][vc_custom_heading text=”4 Hours” use_theme_fonts=”yes”][vc_column_text]
 [/vc_column_text][vc_custom_heading text=”Daily” use_theme_fonts=”yes”][vc_column_text]
 [/vc_column_text][/vc_column][/vc_row]
[vc_row][vc_column][vc_column_text]
Cable is rising today after creating a wave (b) low on Tuesday Morning.
this rally is viewed as wave (c) of [ii].
And the minimum target for wave (c) lies at 1.2560,
this is where the high of wave (a) is broken.
At that level we can look for early signs of a turn down into wave [iii].
Tomorrow;
Wave [ii] still needs a clear end point.
Watch for wave (c) to continue to the upper trend channel line at 1.2600 to complete the three wave correction.
[/vc_column_text][/vc_column][/vc_row]
[vc_row][vc_column][vc_separator border_width=”5″][/vc_column][/vc_row][vc_row][vc_column][vc_column_text]
USDJPY
[/vc_column_text][/vc_column][/vc_row][vc_row][vc_column][vc_separator border_width=”5″][/vc_column][/vc_row][vc_row][vc_column width=”2/3″][vc_custom_heading text=”1 hr” use_theme_fonts=”yes”][vc_column_text]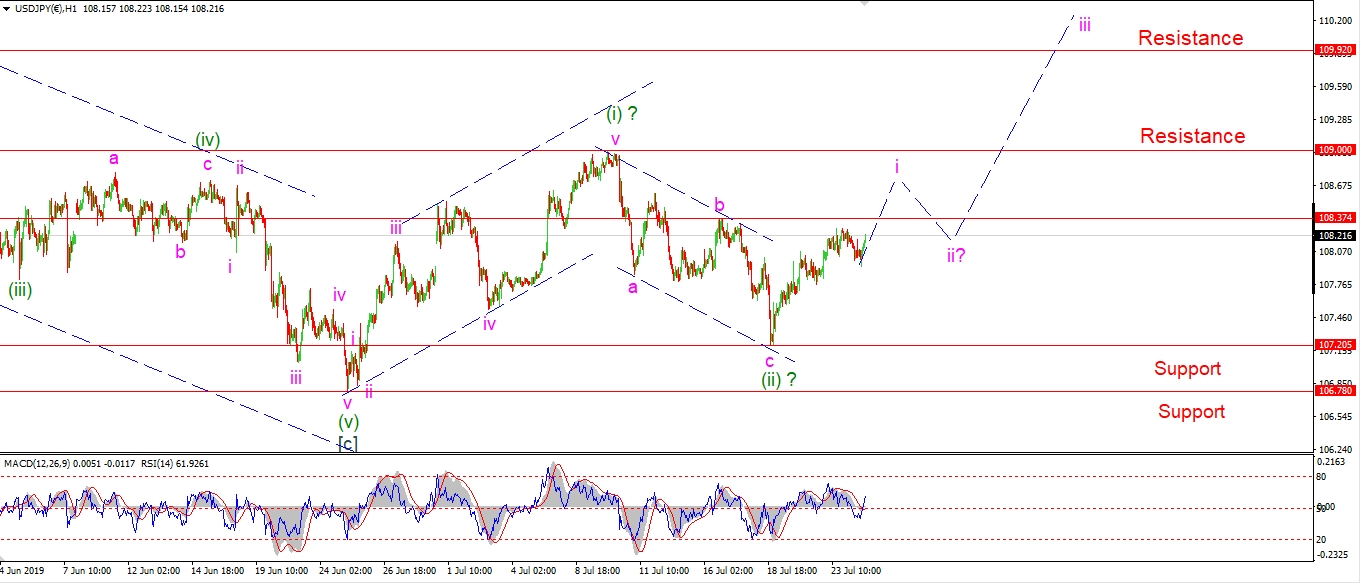 [/vc_column_text][/vc_column][vc_column width=”1/3″][vc_custom_heading text=”4 Hours” use_theme_fonts=”yes”][vc_column_text]
 [/vc_column_text][vc_custom_heading text=”Daily” use_theme_fonts=”yes”][vc_column_text]
 [/vc_column_text][/vc_column][/vc_row]
[vc_row][vc_column][vc_column_text]
The pattern in USDJPY is really on a knife edge,
but so far the rise off 107.20 is following a possible five wave form.
We do need to see an acceleration higher over the coming days though,
a break of resistance at 108.37 in wave ‘i’ will be a good start.
But a solid rally up past 109.00 is what I am looking for
in wave ‘iii’ of (iii) to clearly signal this market has turned for good.
Tomorrow;
Watch for wave ‘i’ to break above 108.37 before any correction begins in wave ‘ii’.
[/vc_column_text][/vc_column][/vc_row]
[vc_row][vc_column][vc_separator border_width=”5″][/vc_column][/vc_row][vc_row][vc_column][vc_column_text]
DOW JONES INDUSTRIALS
[/vc_column_text][/vc_column][/vc_row][vc_row][vc_column][vc_separator border_width=”5″][/vc_column][/vc_row][vc_row][vc_column width=”2/3″][vc_custom_heading text=”1 hr” use_theme_fonts=”yes”][vc_column_text]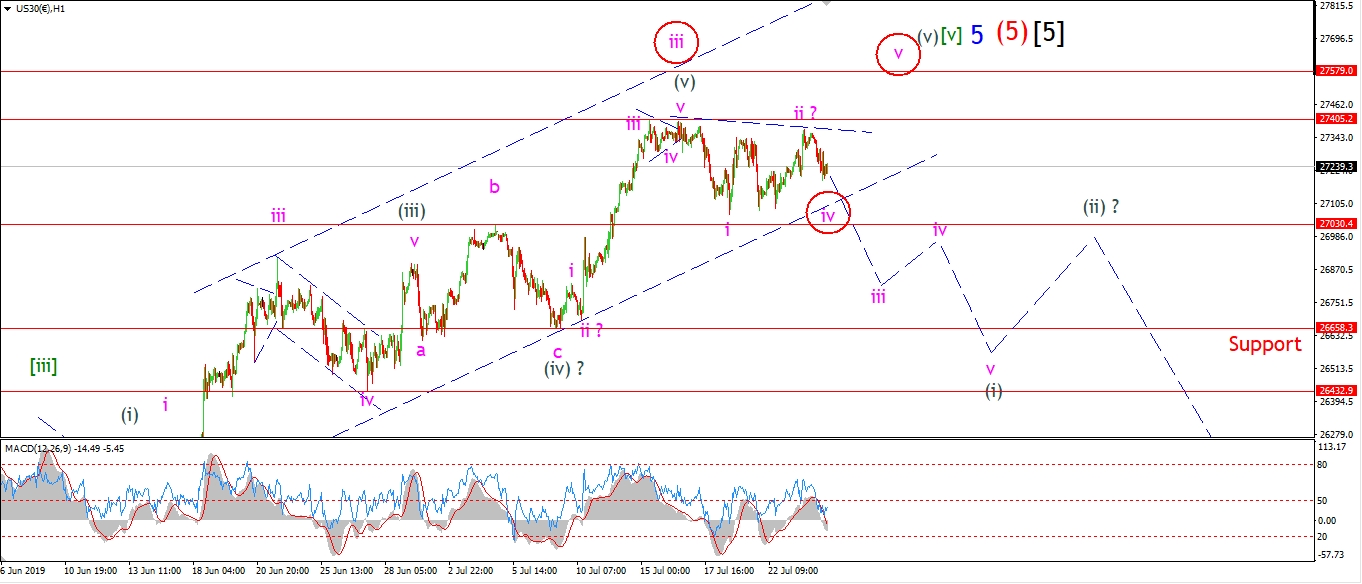 [/vc_column_text][/vc_column][vc_column width=”1/3″][vc_custom_heading text=”4 Hours” use_theme_fonts=”yes”][vc_column_text]
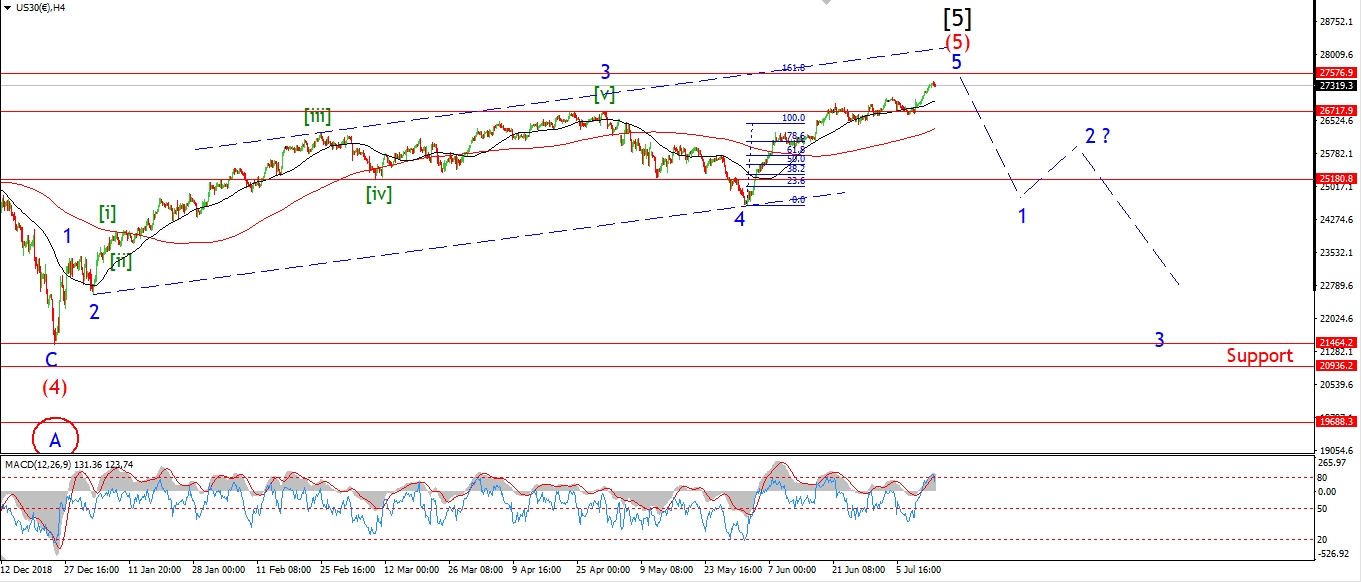 [/vc_column_text][vc_custom_heading text=”Daily” use_theme_fonts=”yes”][vc_column_text]
 [/vc_column_text][/vc_column][/vc_row]
[vc_row][vc_column][vc_column_text]
The DOW has just stumbled sideways all week so far.
We have not yet seen any sharp drop in a third wave to create a bearish signal off the highs.
The price action continues to contract also.
So this action leaves open the possibility that the alternate count is still in play.
I have shown the alternate count circled in red.
This involves a top in wave ‘iii’,
an ongoing triangle in wave ‘iv’,
and then one more rally in wave ‘v’ of (v).
At the moment I am open minded about what happens,
we could very well see a sharp drop below 27000 tomorrow
and this will seal the deal on the bearish count.
If we fail to get that bearish action tomorrow,
then we can concentrate on the alternate count.
Tomorrow;
Watch for wave ‘iii’ of (i) to break below 27000 and confirm the top is in.
[/vc_column_text][/vc_column][/vc_row]
[vc_row][vc_column][vc_separator border_width=”5″][/vc_column][/vc_row][vc_row][vc_column][vc_column_text]
GOLD
[/vc_column_text][/vc_column][/vc_row][vc_row][vc_column][vc_separator border_width=”5″][/vc_column][/vc_row][vc_row][vc_column width=”2/3″][vc_custom_heading text=”1 hr” use_theme_fonts=”yes”][vc_column_text]
 [/vc_column_text][/vc_column][vc_column width=”1/3″][vc_custom_heading text=”4 Hours” use_theme_fonts=”yes”][vc_column_text]
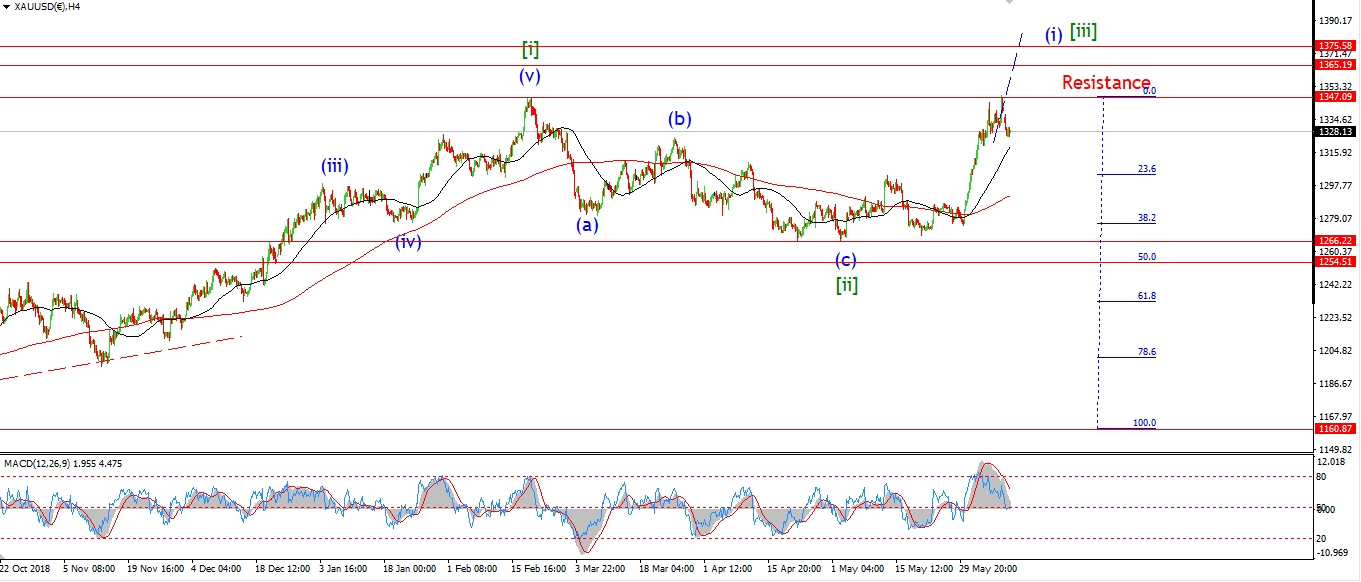 [/vc_column_text][vc_custom_heading text=”Daily” use_theme_fonts=”yes”][vc_column_text]
 [/vc_column_text][/vc_column][/vc_row]
[vc_row][vc_column][vc_column_text]
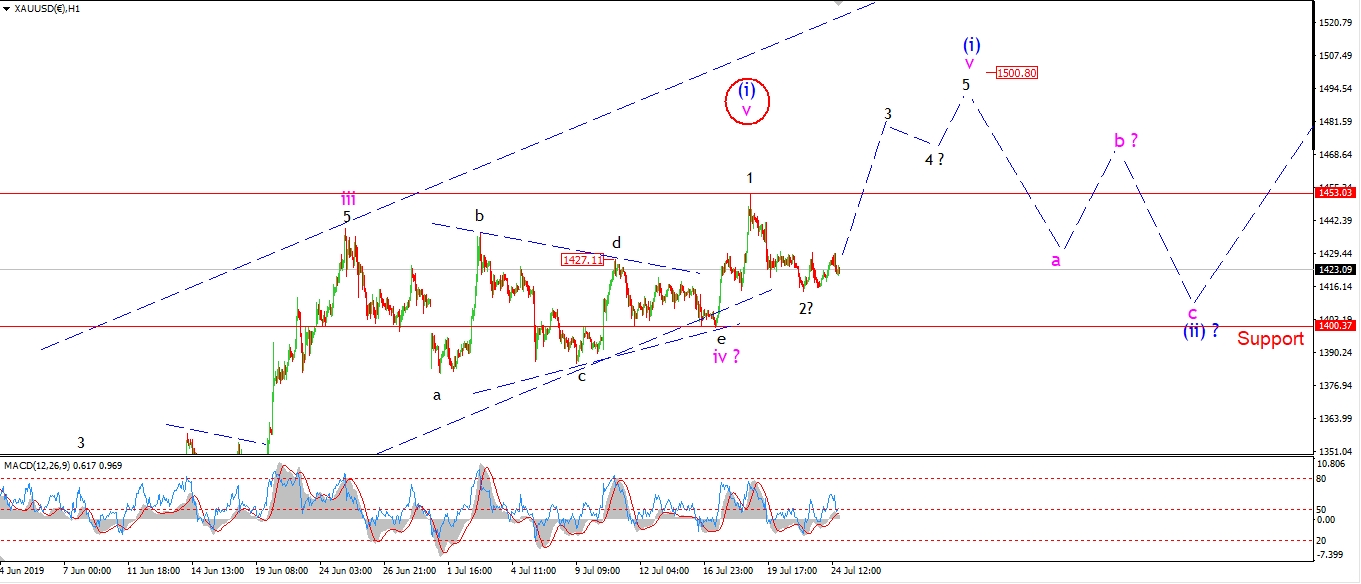
We are in no mans land at the moment in the short term pattern!
Gold has held above 1400 for another trading day.
The failure to drop below that level
leaves open the idea of an extension higher in wave ‘v’ as shown.
If the price rallies above 1453 tomorrow,
that will confirm the bullish interpretation.
The alternate count views the recent top at 1453 as the final high for wave (i).
Which means that wave (ii) is now underway.
A break of that 1400 level will trigger this count.
Tomorrow;
Watch for 1400 to hold,
and wave ‘3’ of ‘v’ to rally back above 1453.
[/vc_column_text][/vc_column][/vc_row]
[vc_row][vc_column][vc_separator border_width=”5″][/vc_column][/vc_row][vc_row][vc_column][vc_column_text]
U.S CRUDE OIL
[/vc_column_text][/vc_column][/vc_row][vc_row][vc_column][vc_separator border_width=”5″][/vc_column][/vc_row][vc_row][vc_column width=”2/3″][vc_custom_heading text=”1 hr” use_theme_fonts=”yes”][vc_column_text]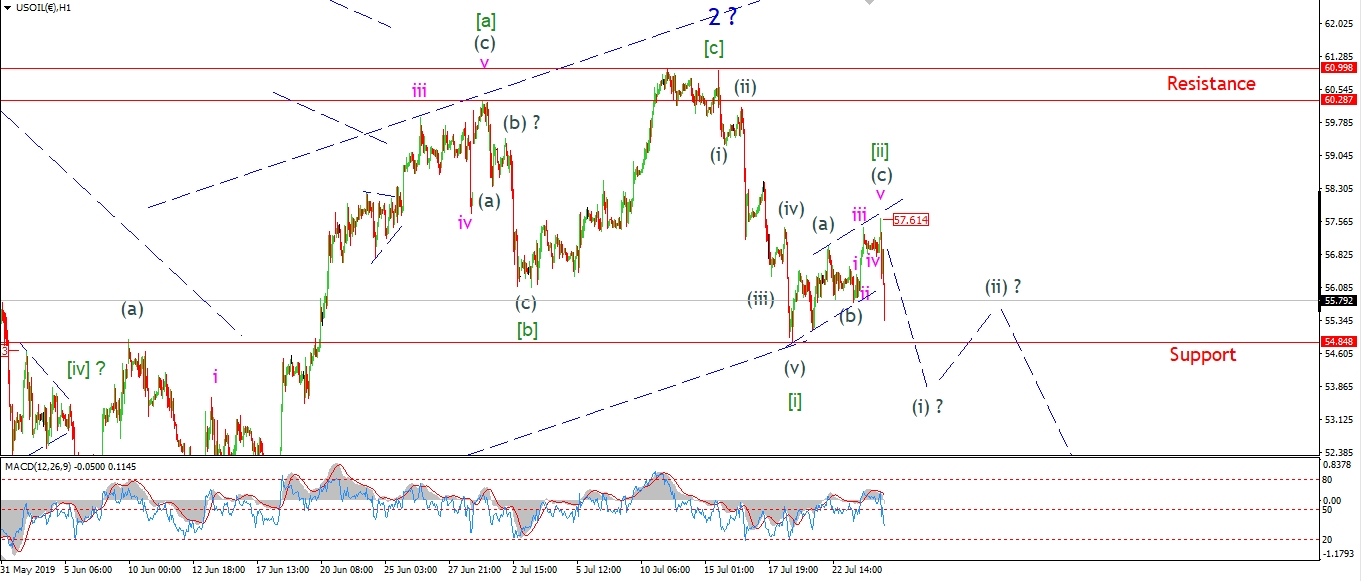 [/vc_column_text][/vc_column][vc_column width=”1/3″][vc_custom_heading text=”4 Hours” use_theme_fonts=”yes”][vc_column_text]
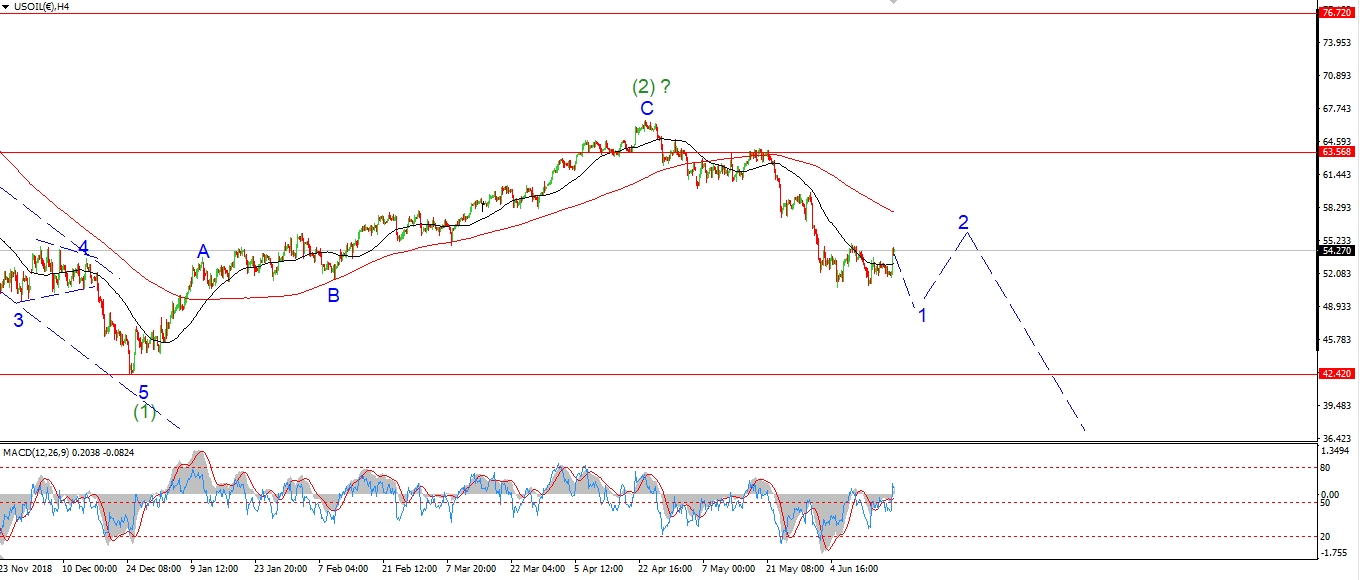 [/vc_column_text][vc_custom_heading text=”Daily” use_theme_fonts=”yes”][vc_column_text]
 [/vc_column_text][/vc_column][/vc_row]
[vc_row][vc_column][vc_column_text]
Yesterdays action in crude triggered the alternate count.
This simply views the correction off the recent low at 54.80 as wave [i].
And the recent correction is now labelled wave [ii].
Crude hit a high this evening in wave (c) of [ii].
This rally completed in five waves and hit the upper trend channel line at the high.
The price has plunged off that high this evening,
this may be the beginning of wave [iii] of ‘3’ to downside.
And this next leg down has the potential to be very painful to the oil industry!
Tomorrow;
Wave [iii] down should first begin with another bearish lower high in waves (i) and (ii) as shown.
Watch for wave (i) to break below 54.80,
and then a three wave correction in wave (ii).
[/vc_column_text][/vc_column][/vc_row]
[vc_row][vc_column][vc_separator border_width=”5″][/vc_column][/vc_row][vc_row][vc_column][vc_column_text]
US 10 yr Treasuries.
[/vc_column_text][/vc_column][/vc_row][vc_row][vc_column][vc_separator border_width=”5″][/vc_column][/vc_row][vc_row][vc_column width=”2/3″][vc_custom_heading text=”1 hr” use_theme_fonts=”yes”][vc_column_text]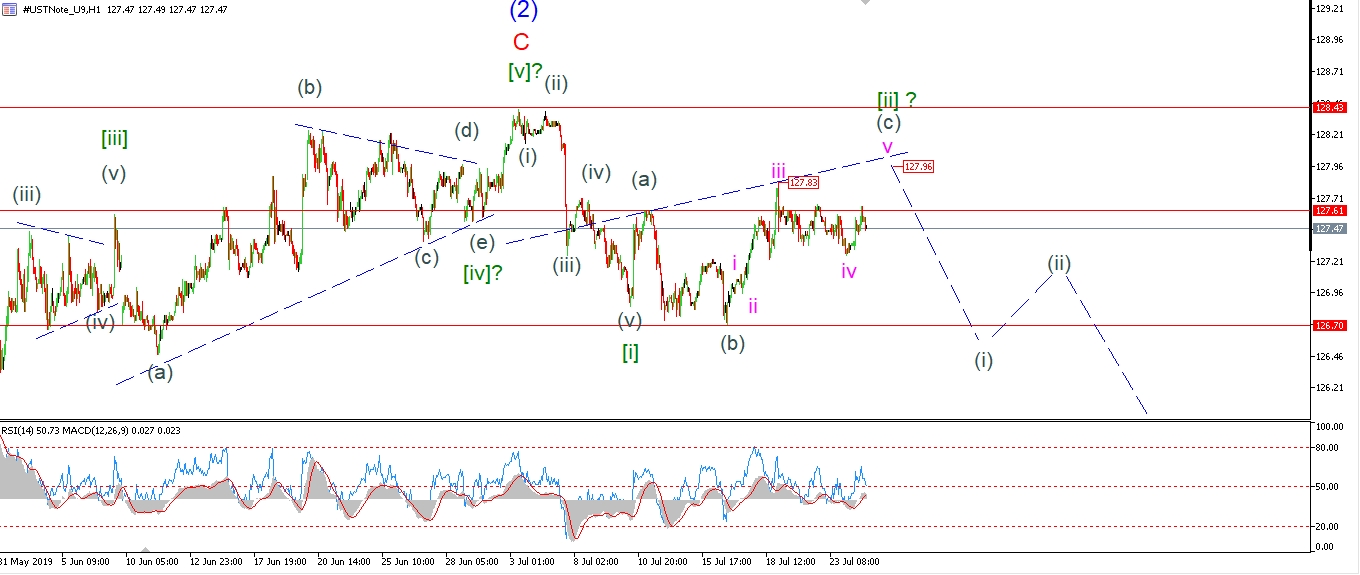 [/vc_column_text][/vc_column][vc_column width=”1/3″][vc_custom_heading text=”4 Hours” use_theme_fonts=”yes”][vc_column_text]
 [/vc_column_text][vc_custom_heading text=”Daily” use_theme_fonts=”yes”][vc_column_text]
 [/vc_column_text][/vc_column][/vc_row]
[vc_row][vc_column][vc_column_text]
The price has corrected in three waves off the recent wave ‘iii’ high at 127.83.
this action suggests that wave (c) is still in force at the moment.
The price has risen off the lows created last night,
and this rise is labelled as the final rise in wave ‘v’ of (c).
Wave ‘v’ should break 127.96 and then turn lower to begin wave [iii] down.
Tomorrow;
Watch for wave ‘v’ of (c) to complete with a break of 127.83.
[/vc_column_text][/vc_column][/vc_row]
[vc_row][vc_column][vc_separator border_width=”5″][/vc_column][/vc_row][vc_row][vc_column][vc_column_text]
SILVER
[/vc_column_text][/vc_column][/vc_row][vc_row][vc_column][vc_separator border_width=”5″][/vc_column][/vc_row][vc_row][vc_column width=”2/3″][vc_custom_heading text=”1 hr” use_theme_fonts=”yes”][vc_column_text]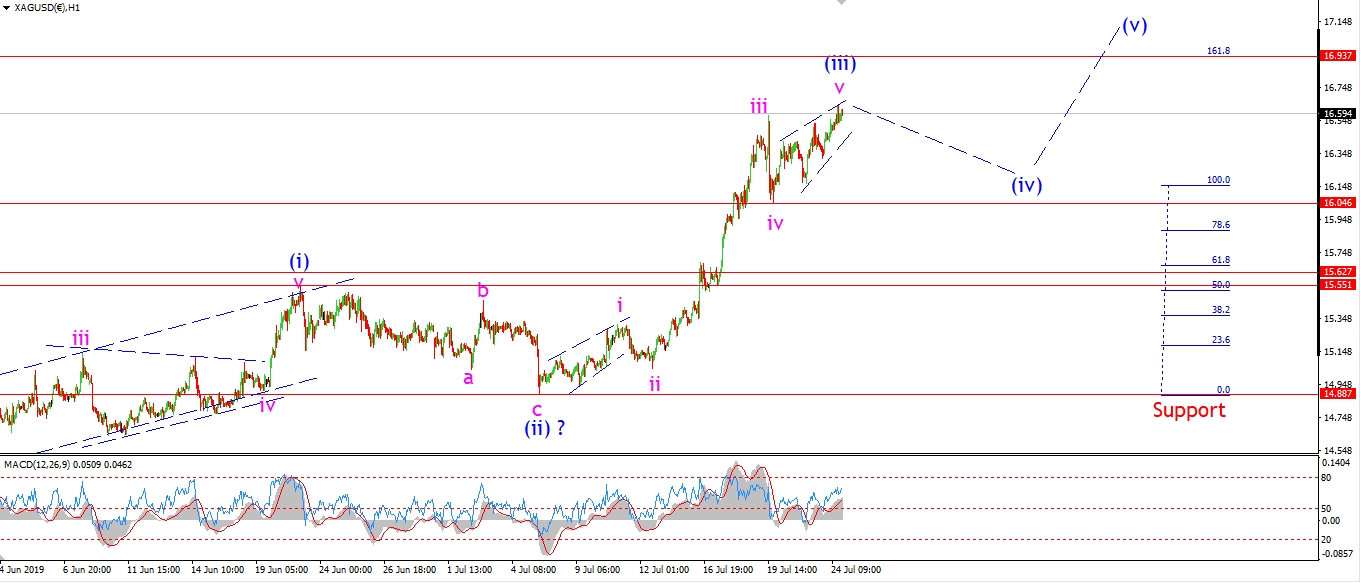 [/vc_column_text][/vc_column][vc_column width=”1/3″][vc_custom_heading text=”4 Hours” use_theme_fonts=”yes”][vc_column_text]
 [/vc_column_text][vc_custom_heading text=”Daily” use_theme_fonts=”yes”][vc_column_text]
 [/vc_column_text][/vc_column][/vc_row]
[vc_row][vc_column][vc_column_text]
Silver hit a new high today which has changed things on the short term count slightly.
The rising price has created a wedge shape into todays highs,
this suggests an ending diagonal wave is in play now.
I have labelled this as wave ‘v’ of (iii),
If we see a drop back towards 16.00 again by the end of the week,
that will signal that wave (iv) has begun.
Wave (iv) should be a holding pattern though,
and I don’t expect any major decline in that wave.
Tomorrow;
Watch for wave ‘v’ of (iii) to top out soon.
Wave ‘a’ of (iv) is set to begin soon with a drop into the 16.00 level.
[/vc_column_text][/vc_column][/vc_row]
[vc_row][vc_column][vc_separator border_width=”5″][/vc_column][/vc_row][vc_row][vc_column][vc_column_text]
S&P 500.
[/vc_column_text][/vc_column][/vc_row][vc_row][vc_column][vc_separator border_width=”5″][/vc_column][/vc_row][vc_row][vc_column width=”2/3″][vc_custom_heading text=”1 hr” use_theme_fonts=”yes”][vc_column_text]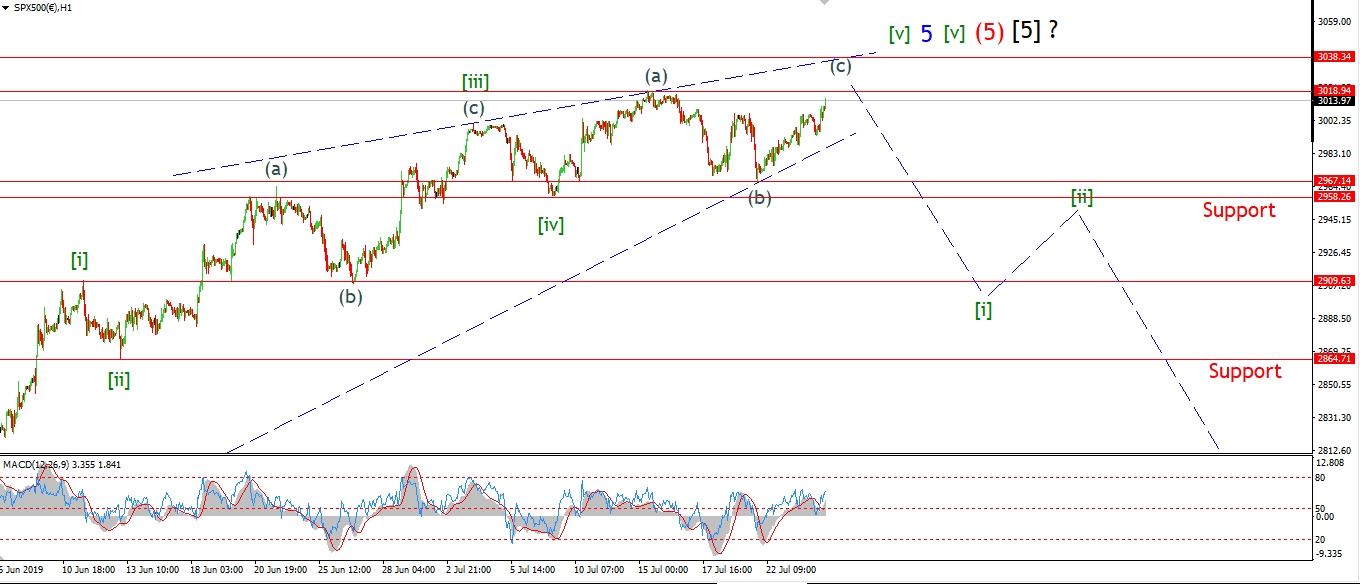 [/vc_column_text][/vc_column][vc_column width=”1/3″][vc_custom_heading text=”4 Hours” use_theme_fonts=”yes”][vc_column_text]
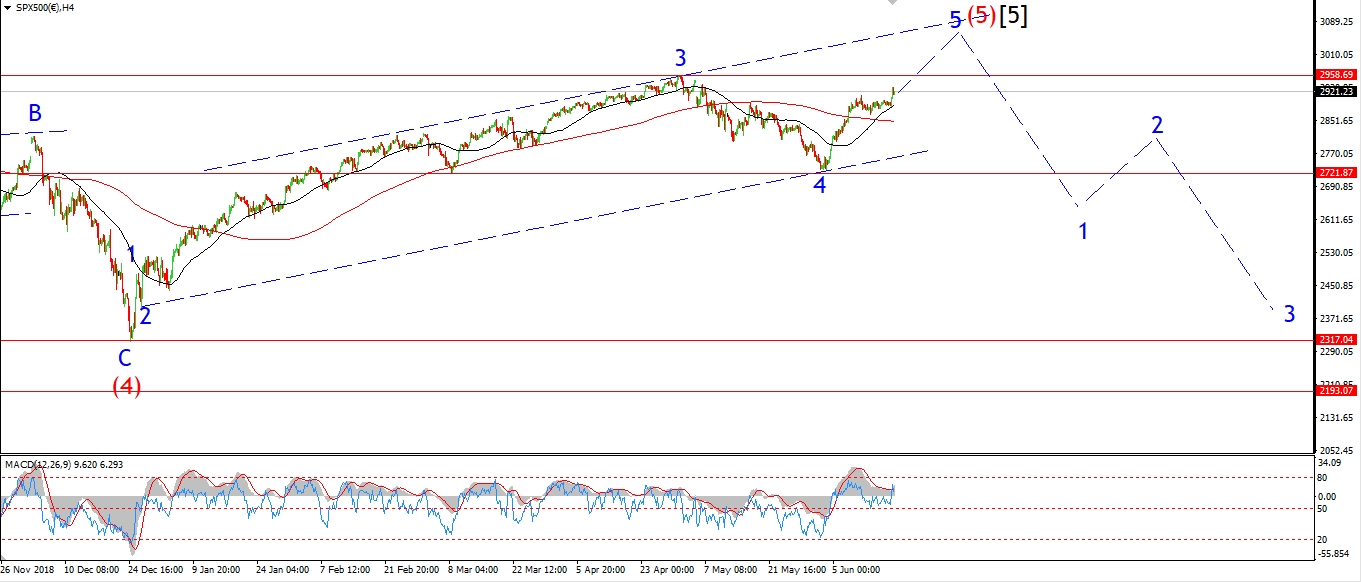 [/vc_column_text][vc_custom_heading text=”Daily” use_theme_fonts=”yes”][vc_column_text]
 [/vc_column_text][/vc_column][/vc_row]
[vc_row][vc_column][vc_column_text]
The S&P is looking for one more all time high for the road!
The rally today is near to that goal as we come to the close this evening.
This rally will not extend much further though,
as the wave short term count is now in wave (c) of [v] of ‘5’.
And the upper target for this rally lies at the rising trend line.
Price will hit this trend line at about 3040,
and then we should begin the long hard road into a new bearmarket.
I really think we are that close now,
so it is time to sober up and get out before things get ugly!
Tomorrow;
Watch for wave (c) to push up to the target area to complete wave [v].
Wave [i] down may well begin before the end of Fridays session.
[/vc_column_text][/vc_column][/vc_row]
[vc_row][vc_column][vc_separator border_width=”5″][/vc_column][/vc_row]