
[vc_row][vc_column][vc_separator border_width=”5″][/vc_column][/vc_row]
[vc_row][vc_column][vc_column_text]
Good evening everyone,
No video tonight as I just can’t manage it when I’m away from home!
We are sailing back home to Ireland on Tuesday night next week.
This will prevent me from doing a Tuesday night upload,
but all will be back to normal on Wednesday,
and I will be back to the weekend videos next week again.
Ok,
down to business.
[/vc_column_text][/vc_column][/vc_row]
[vc_row][vc_column][vc_separator border_width=”5″][/vc_column][/vc_row]
[vc_row][vc_column][vc_column_text]
EURUSD
[/vc_column_text][/vc_column][/vc_row]
[vc_row][vc_column][vc_separator border_width=”5″][/vc_column][/vc_row][vc_row][vc_column width=”2/3″][vc_custom_heading text=”1 hr” use_theme_fonts=”yes”][vc_column_text]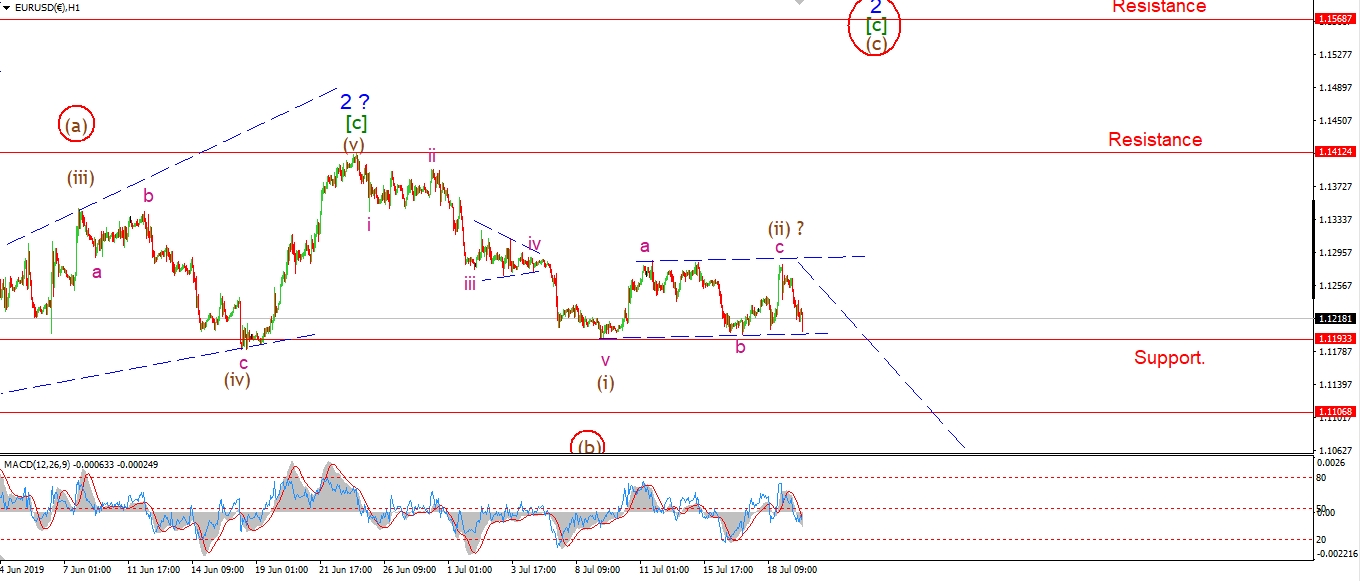 [/vc_column_text][/vc_column][vc_column width=”1/3″][vc_custom_heading text=”4 Hours” use_theme_fonts=”yes”][vc_column_text]
 [/vc_column_text][vc_custom_heading text=”Daily” use_theme_fonts=”yes”][vc_column_text]
 [/vc_column_text][/vc_column][/vc_row]
[vc_row][vc_column][vc_column_text]
I cannot be sure that wave (ii) is yet complete this evening,
even after the rally into the high late last night.
The rally in wave ‘c’ did not make a new high above wave ‘a’ at 1.1286.
the high reached 1.1282.
Its only 4 pips,
Close but no cigar as they say!
We could have a running flat correction in wave (ii),
in that case wave ‘c’ will fail to break the wave ‘a’ high.
Or wave ‘b’ of (ii) is still underway.
We should know early Monday which interpretation is correct.
Monday;
If the price continues to decline in line with wave (iii) and breaks 1.1193 in a five wave form,
then wave (iii) will be underway.
watch for wave 1.1282 to hold from here.
[/vc_column_text][/vc_column][/vc_row]
[vc_row][vc_column][vc_separator border_width=”5″][/vc_column][/vc_row][vc_row][vc_column][vc_column_text]
GBPUSD
[/vc_column_text][/vc_column][/vc_row][vc_row][vc_column][vc_separator border_width=”5″][/vc_column][/vc_row][vc_row][vc_column width=”2/3″][vc_custom_heading text=”1 hr” use_theme_fonts=”yes”][vc_column_text]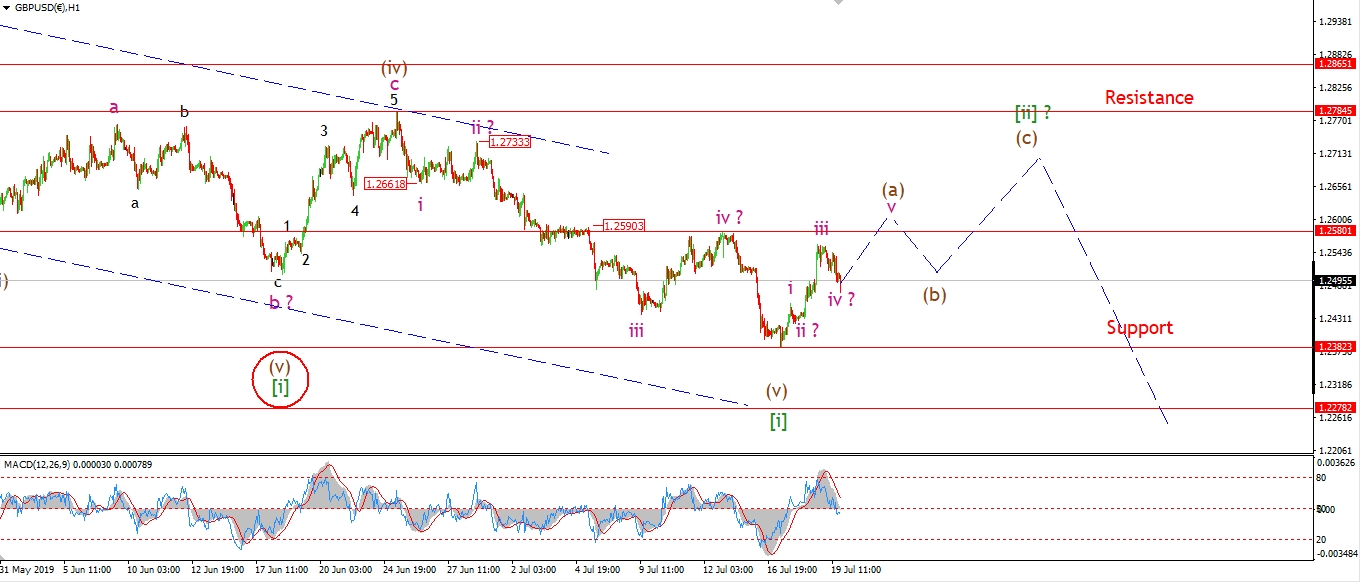 [/vc_column_text][/vc_column][vc_column width=”1/3″][vc_custom_heading text=”4 Hours” use_theme_fonts=”yes”][vc_column_text]
 [/vc_column_text][vc_custom_heading text=”Daily” use_theme_fonts=”yes”][vc_column_text]
 [/vc_column_text][/vc_column][/vc_row]
[vc_row][vc_column][vc_column_text]
I have shown a possible five wave form rising off the recent low at wave [i] green.
If this play out on Monday,
it will confirm wave [ii] as a zigzag 5,3,5 correction.
This rally should break 1.2580 and confirm the correction is underway.
Todays slight decline is viewed as wave ‘iv’ of (a),
with wave ‘v’ left to complete the first leg up in wave (a).
Monday;
Whatever the pattern in wave [ii] does take,
we should see a continuation to the corrective rally early next week.
Watch for wave (a) to break 1.2580 before wave (b) begins.
[/vc_column_text][/vc_column][/vc_row]
[vc_row][vc_column][vc_separator border_width=”5″][/vc_column][/vc_row][vc_row][vc_column][vc_column_text]
USDJPY
[/vc_column_text][/vc_column][/vc_row][vc_row][vc_column][vc_separator border_width=”5″][/vc_column][/vc_row][vc_row][vc_column width=”2/3″][vc_custom_heading text=”1 hr” use_theme_fonts=”yes”][vc_column_text]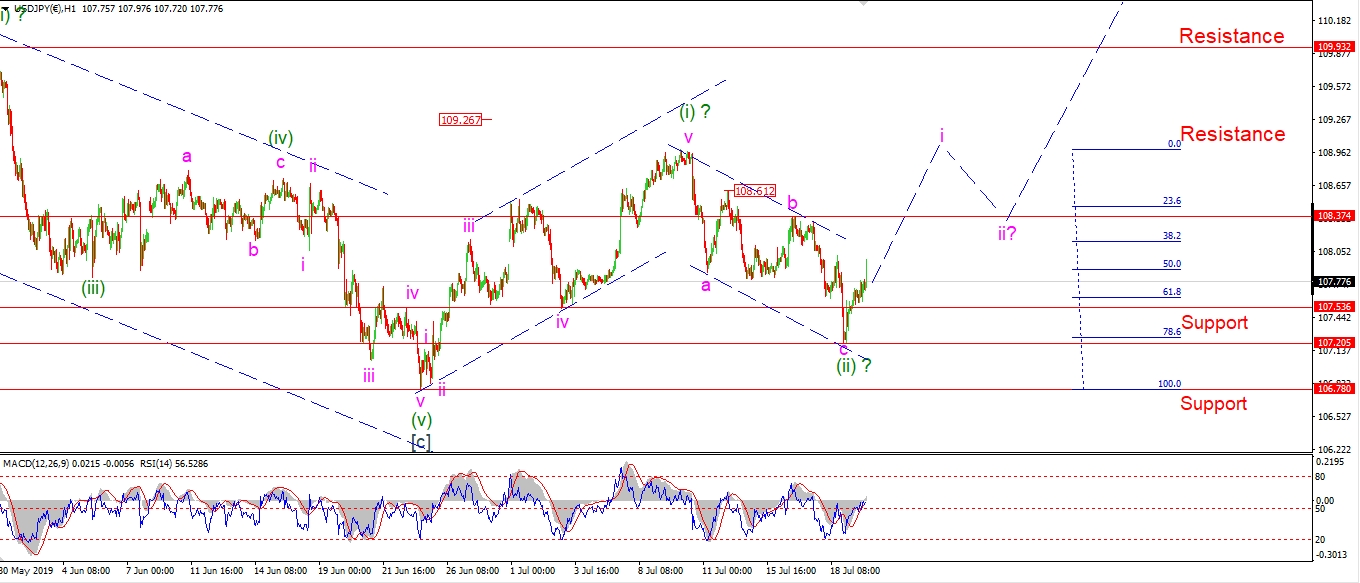 [/vc_column_text][/vc_column][vc_column width=”1/3″][vc_custom_heading text=”4 Hours” use_theme_fonts=”yes”][vc_column_text]
 [/vc_column_text][vc_custom_heading text=”Daily” use_theme_fonts=”yes”][vc_column_text]
 [/vc_column_text][/vc_column][/vc_row]
[vc_row][vc_column][vc_column_text]
It’s not pretty,
but USDJPY is going the right way again!
The price hit the lower trend channel line late late night,
and then rallied off that level today.
The low just breached the 78.6% retracement level before turning higher.
It is now imperative that price holds above 107.21
and we get an impulsive rally to begin wave (iii) up.
Next week will be critical in USDJPY.
Monday;
watch for wave ‘i’ of (iii) to rise above 108.37 to signal wave (iii) has begun.
[/vc_column_text][/vc_column][/vc_row]
[vc_row][vc_column][vc_separator border_width=”5″][/vc_column][/vc_row][vc_row][vc_column][vc_column_text]
DOW JONES INDUSTRIALS
[/vc_column_text][/vc_column][/vc_row][vc_row][vc_column][vc_separator border_width=”5″][/vc_column][/vc_row][vc_row][vc_column width=”2/3″][vc_custom_heading text=”1 hr” use_theme_fonts=”yes”][vc_column_text]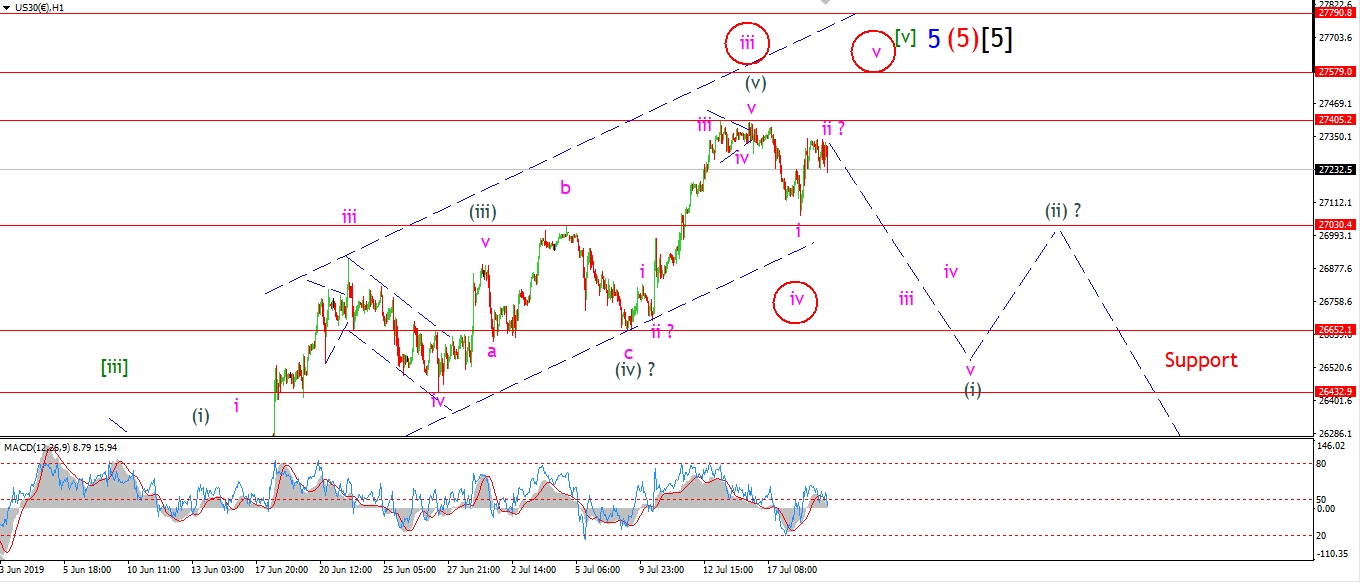 [/vc_column_text][/vc_column][vc_column width=”1/3″][vc_custom_heading text=”4 Hours” use_theme_fonts=”yes”][vc_column_text]
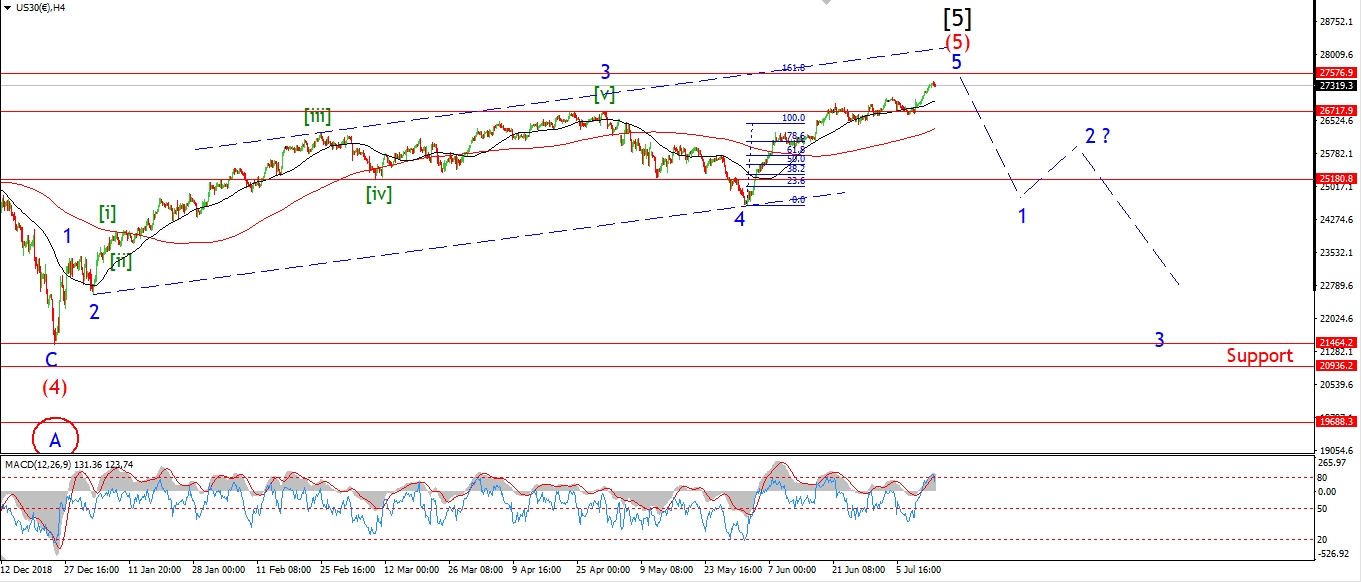 [/vc_column_text][vc_custom_heading text=”Daily” use_theme_fonts=”yes”][vc_column_text]
 [/vc_column_text][/vc_column][/vc_row]
[vc_row][vc_column][vc_column_text]
There was a solid rally today off Thursdays lows.
This leaves open the possibility that wave (v) is still underway.
The price did not break out to a new high,
but the rally could be the beginning of wave ‘v’.
I have remained with the bearish count for the moment,
but we will know Monday which count is correct.
If the price continues higher Monday,
that will signal wave ‘v’ of (v) is still in force.
However,
a breakdown on Monday that brings price back below 27000 again will favor the bearish count.
We are near to the turn now in either interpretation,
and from now on,
I am looking for a large bearish signal to form off the eventual high
to point the way for the foreseeable future.
Monday;
Watch for the recent high to hold and wave ‘iii’ of (i) to carry price back below 27000.
[/vc_column_text][/vc_column][/vc_row]
[vc_row][vc_column][vc_separator border_width=”5″][/vc_column][/vc_row][vc_row][vc_column][vc_column_text]
GOLD
[/vc_column_text][/vc_column][/vc_row][vc_row][vc_column][vc_separator border_width=”5″][/vc_column][/vc_row][vc_row][vc_column width=”2/3″][vc_custom_heading text=”1 hr” use_theme_fonts=”yes”][vc_column_text]
 [/vc_column_text][/vc_column][vc_column width=”1/3″][vc_custom_heading text=”4 Hours” use_theme_fonts=”yes”][vc_column_text]
 [/vc_column_text][vc_custom_heading text=”Daily” use_theme_fonts=”yes”][vc_column_text]
 [/vc_column_text][/vc_column][/vc_row]
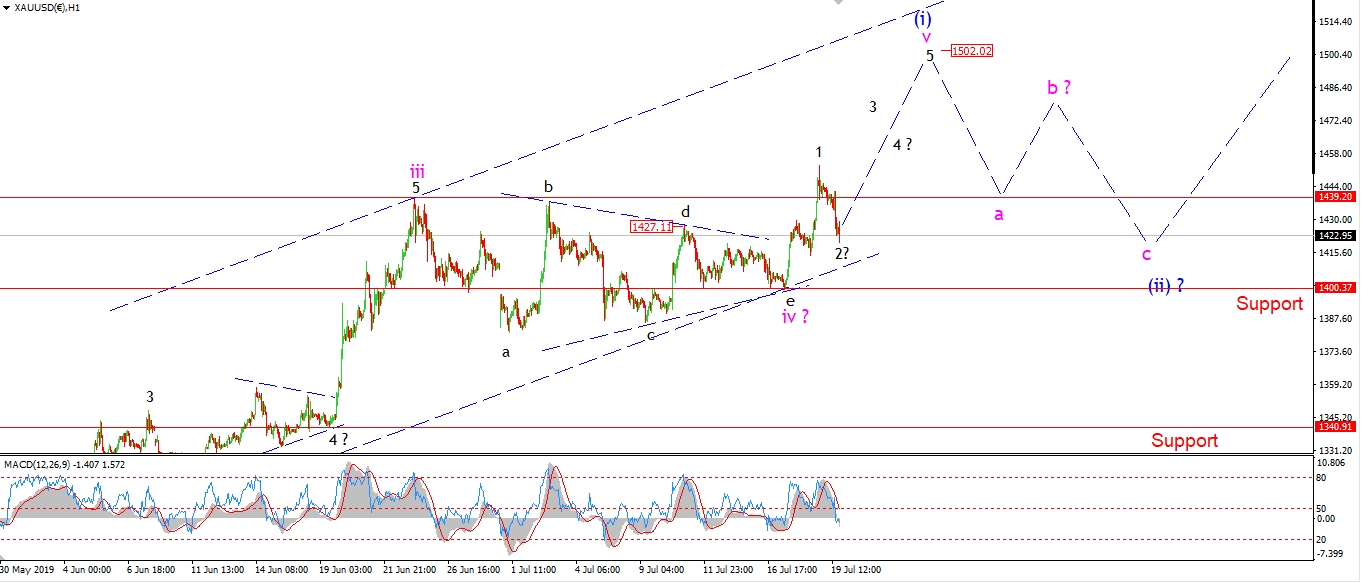
[vc_row][vc_column][vc_column_text]
Gold corrected in a possible wave ‘2’ of ‘v’ today
and so far the the price has held above the previous fourth wave at 1400.
A break of that 1400 level will call an end to wave (i) blue at the recent high.
And we can then concentrate on the correction in wave (ii).
For the moment,
I am willing to allow for wave ‘v’ to continue higher as shown.
Monday;
Watch for wave ‘v’ to hold above 1400 and continue higher towards 1500 and the upper trend channel line.
It looks likely that wave (i) will complete next week.
And then we will have to work through another correction for a while.
[/vc_column_text][/vc_column][/vc_row]
[vc_row][vc_column][vc_separator border_width=”5″][/vc_column][/vc_row][vc_row][vc_column][vc_column_text]
U.S CRUDE OIL
[/vc_column_text][/vc_column][/vc_row][vc_row][vc_column][vc_separator border_width=”5″][/vc_column][/vc_row][vc_row][vc_column width=”2/3″][vc_custom_heading text=”1 hr” use_theme_fonts=”yes”][vc_column_text]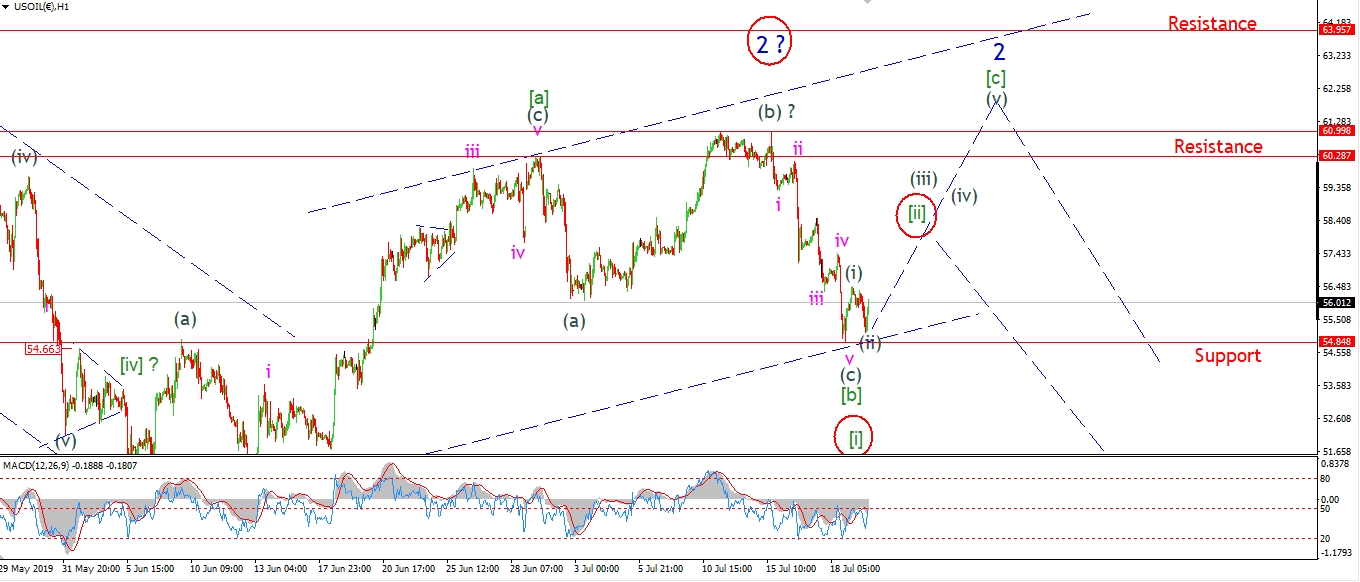 [/vc_column_text][/vc_column][vc_column width=”1/3″][vc_custom_heading text=”4 Hours” use_theme_fonts=”yes”][vc_column_text]
 [/vc_column_text][vc_custom_heading text=”Daily” use_theme_fonts=”yes”][vc_column_text]
 [/vc_column_text][/vc_column][/vc_row]
[vc_row][vc_column][vc_column_text]
The decline seems to have halted today with an impulsive move off the low.
Today’s rise does not clear up the question of whether this is an impulsive rally in wave [c] as shown,
or a corrective rally in wave [ii] as per the alternate count.
If the stock market has already topped out,
then the alternate count is more likely,
and crude oil is only correcting higher in wave [ii] green.
And as with stocks,
we will know soon enough.
Monday;
Watch for crude to continue higher in at least a three wave correction to about 58.00 next week.
[/vc_column_text][/vc_column][/vc_row]
[vc_row][vc_column][vc_separator border_width=”5″][/vc_column][/vc_row][vc_row][vc_column][vc_column_text]
US 10 yr Treasuries.
[/vc_column_text][/vc_column][/vc_row][vc_row][vc_column][vc_separator border_width=”5″][/vc_column][/vc_row][vc_row][vc_column width=”2/3″][vc_custom_heading text=”1 hr” use_theme_fonts=”yes”][vc_column_text] [/vc_column_text][/vc_column][vc_column width=”1/3″][vc_custom_heading text=”4 Hours” use_theme_fonts=”yes”][vc_column_text]
 [/vc_column_text][vc_custom_heading text=”Daily” use_theme_fonts=”yes”][vc_column_text]
 [/vc_column_text][/vc_column][/vc_row]
[vc_row][vc_column][vc_column_text]
The 10yr has dropped off the highs today,
but the decline must now develop in five waves to the downside in order to call a top in place at wave [ii].
If we see a break of 126.70 early next week that will signal wave [iii] has begun.
Monday;
Watch for wave (i) of [iii] to continue lower.
126.70 is the key level from here.
[/vc_column_text][/vc_column][/vc_row]
[vc_row][vc_column][vc_separator border_width=”5″][/vc_column][/vc_row][vc_row][vc_column][vc_column_text]
SILVER
[/vc_column_text][/vc_column][/vc_row][vc_row][vc_column][vc_separator border_width=”5″][/vc_column][/vc_row][vc_row][vc_column width=”2/3″][vc_custom_heading text=”1 hr” use_theme_fonts=”yes”][vc_column_text]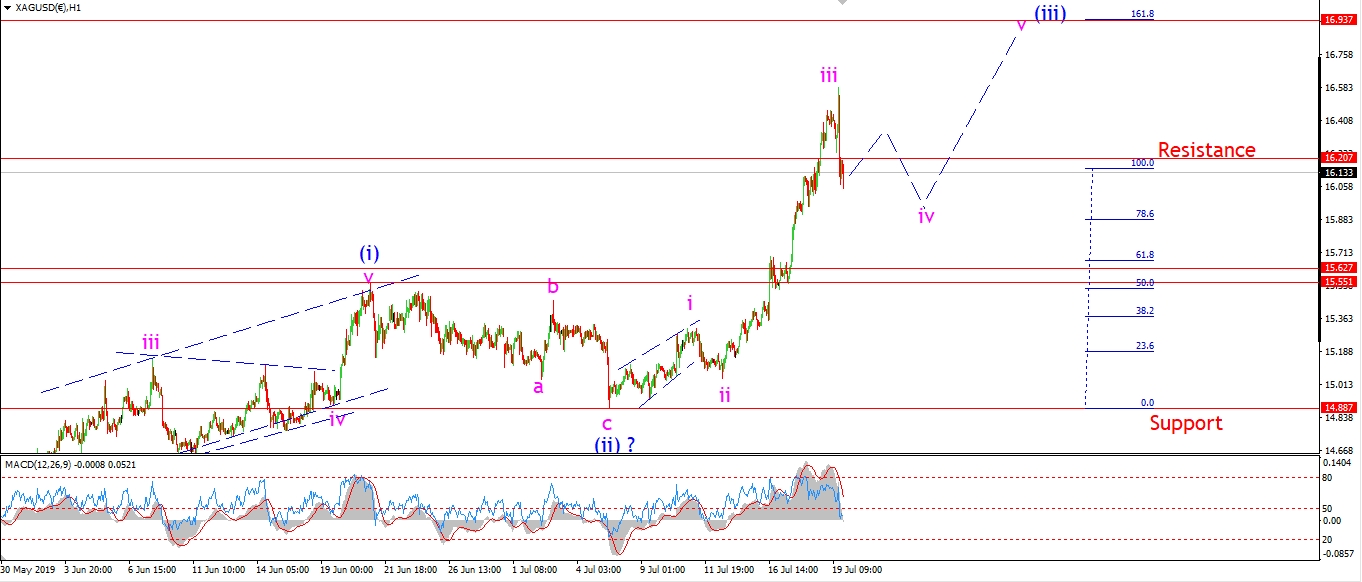 [/vc_column_text][/vc_column][vc_column width=”1/3″][vc_custom_heading text=”4 Hours” use_theme_fonts=”yes”][vc_column_text]
 [/vc_column_text][vc_custom_heading text=”Daily” use_theme_fonts=”yes”][vc_column_text]
 [/vc_column_text][/vc_column][/vc_row]
[vc_row][vc_column][vc_column_text]
Silver reached 13.58 today which marks the high of wave ‘iii’.
The sharp move lower today should begin the correction in wave ‘iv’ pink.
This correction in wave ‘iv’ should complete above 15.50,
and then rally again in wave ‘v’ to complete the larger wave (iii).
Monday;
Wave ‘iv’ should correct in three waves at a minimum next week.
And wave (iii) should resume by the end of the week.
[/vc_column_text][/vc_column][/vc_row]
[vc_row][vc_column][vc_separator border_width=”5″][/vc_column][/vc_row][vc_row][vc_column][vc_column_text]
S&P 500.
[/vc_column_text][/vc_column][/vc_row][vc_row][vc_column][vc_separator border_width=”5″][/vc_column][/vc_row][vc_row][vc_column width=”2/3″][vc_custom_heading text=”1 hr” use_theme_fonts=”yes”][vc_column_text]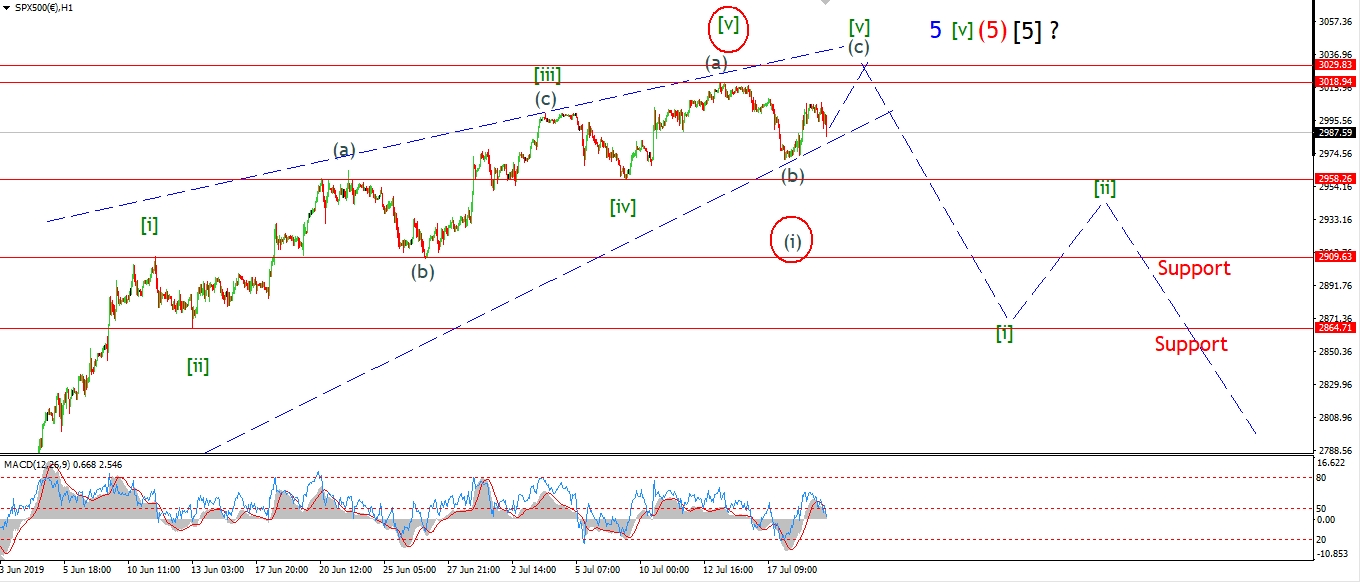 [/vc_column_text][/vc_column][vc_column width=”1/3″][vc_custom_heading text=”4 Hours” use_theme_fonts=”yes”][vc_column_text]
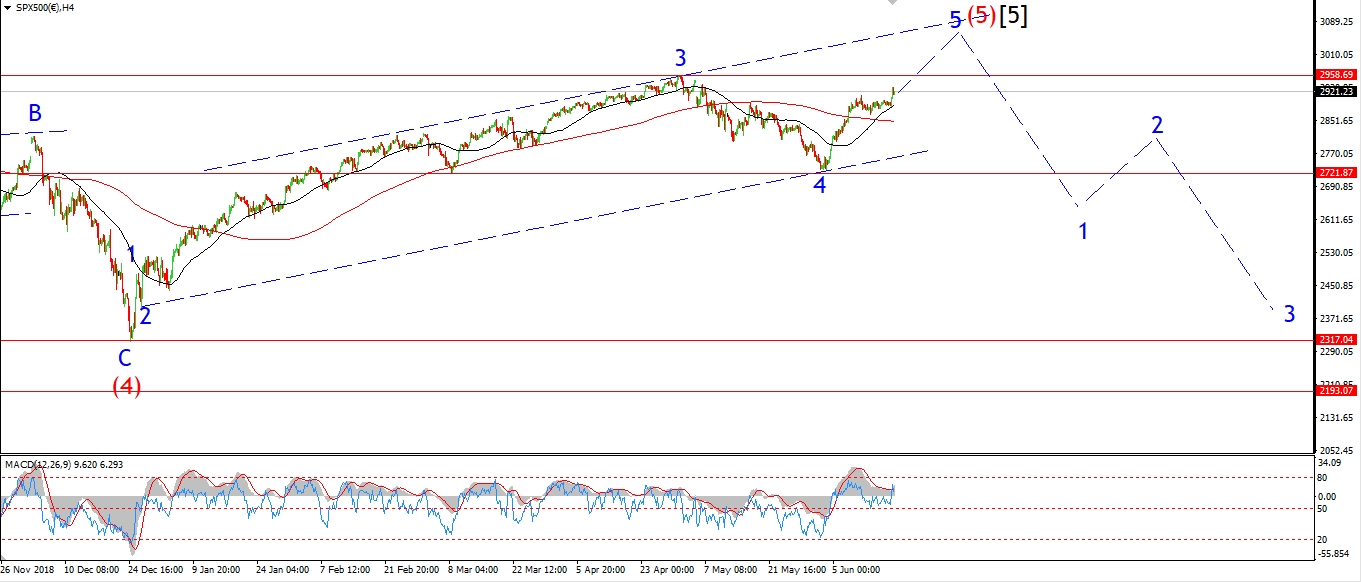 [/vc_column_text][vc_custom_heading text=”Daily” use_theme_fonts=”yes”][vc_column_text]
 [/vc_column_text][/vc_column][/vc_row]
[vc_row][vc_column][vc_column_text]
The S&P has created a lower high today in a possible wave (b) of [v].
The main wave count allows for one more rally in wave (c)
to complete a three wave rise in wave [v].
And with that action,
complete an ending diagonal in wave ‘5’ blue.
The end is near for the S&P there is now doubt there.
As for the alternate count,
this also calls for a lower high today,
so this interpretation is still in play right now.
Monday;
Watch for wave (c) of [v] to push above 3020 again to finish the pattern.
however;
If the price falls from here and breaks 2958,
that will favor the alternate bearish count.
Have a great weekend everyone,
See you again monday,
God bless,
Enda.
[/vc_column_text][/vc_column][/vc_row]
[vc_row][vc_column][vc_separator border_width=”5″][/vc_column][/vc_row]