
[vc_row][vc_column][vc_separator border_width=”5″][/vc_column][/vc_row]
[vc_row][vc_column][vc_column_text]
Good evening dear souls!
Every month I point to John Hussmans latest piece,
this time I urge you to spare a few moments and take it in.
We are walking over a cliff edge into an abyss now,
[/vc_column_text][/vc_column][/vc_row]
[vc_row][vc_column][vc_separator border_width=”5″][/vc_column][/vc_row]
[vc_row][vc_column][vc_column_text]
EURUSD
[/vc_column_text][/vc_column][/vc_row]
[vc_row][vc_column][vc_separator border_width=”5″][/vc_column][/vc_row][vc_row][vc_column width=”2/3″][vc_custom_heading text=”1 hr” use_theme_fonts=”yes”][vc_column_text]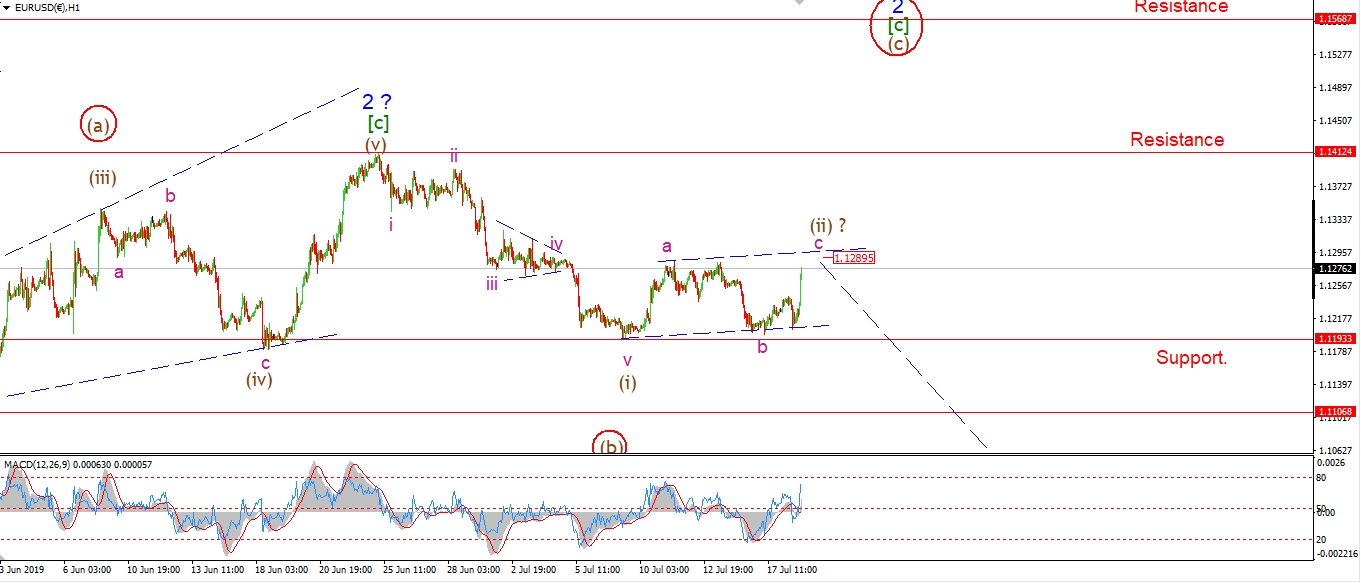 [/vc_column_text][/vc_column][vc_column width=”1/3″][vc_custom_heading text=”4 Hours” use_theme_fonts=”yes”][vc_column_text]
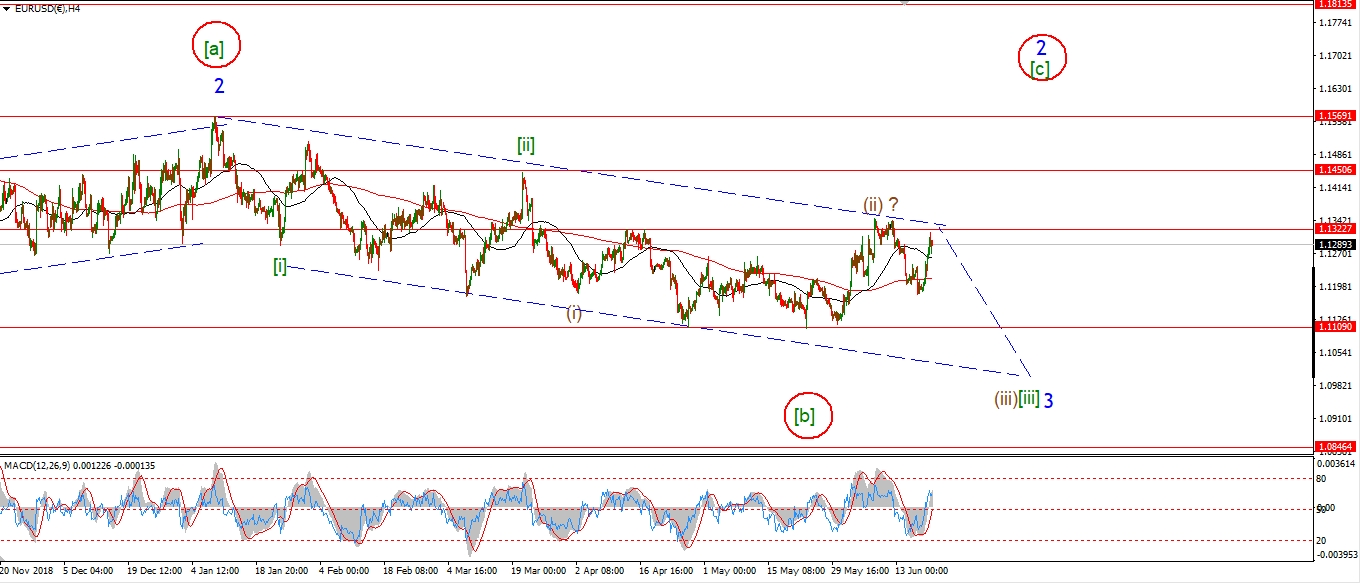 [/vc_column_text][vc_custom_heading text=”Daily” use_theme_fonts=”yes”][vc_column_text]
 [/vc_column_text][/vc_column][/vc_row]
[vc_row][vc_column][vc_column_text]
EURUSD is rising off the wave ‘b’ this evening with a vertical bar higher off the session lows.
This is viewed as wave ‘c’ of (ii)
and the rally should top out at the upper trend line at 1.1290 or there about.
once this three wave correction completes,
we will have a bearish impulse wave in place,
and wave (iii) will be ready to take us back down into trend again.
Tomorrow;
1.1412 must hold at the upper end.
Watch for wave ‘c’ of (ii) to complete early tomorrow adn turn down again to break support at 1.1193.
[/vc_column_text][/vc_column][/vc_row]
[vc_row][vc_column][vc_separator border_width=”5″][/vc_column][/vc_row][vc_row][vc_column][vc_column_text]
GBPUSD
[/vc_column_text][/vc_column][/vc_row][vc_row][vc_column][vc_separator border_width=”5″][/vc_column][/vc_row][vc_row][vc_column width=”2/3″][vc_custom_heading text=”1 hr” use_theme_fonts=”yes”][vc_column_text]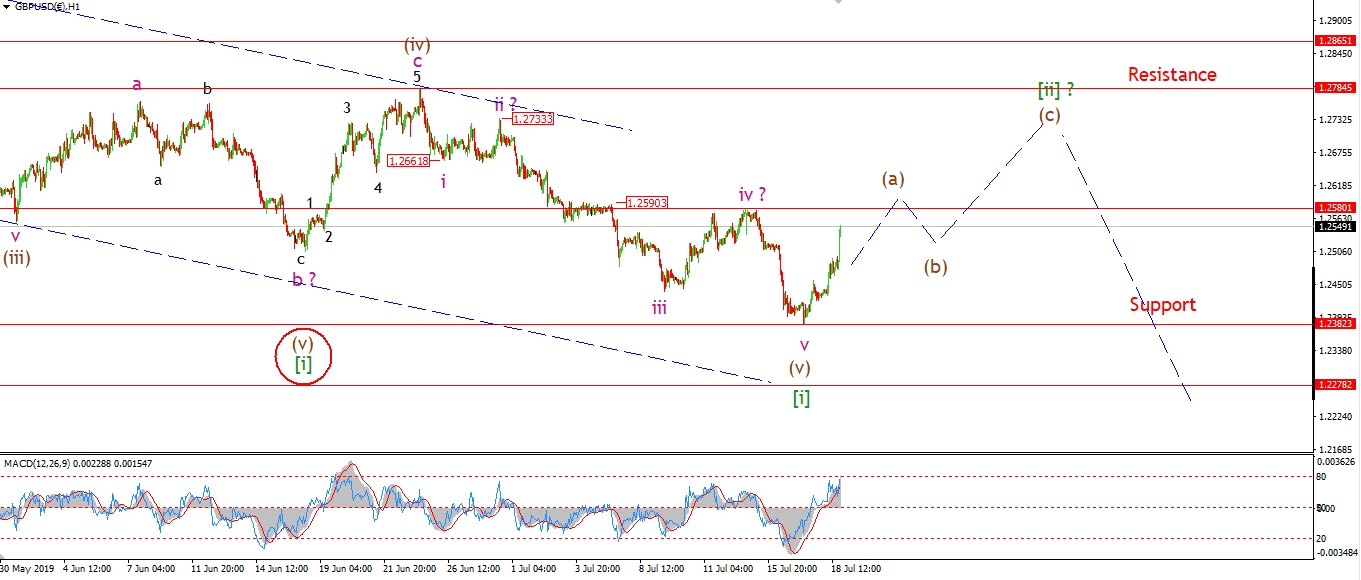 [/vc_column_text][/vc_column][vc_column width=”1/3″][vc_custom_heading text=”4 Hours” use_theme_fonts=”yes”][vc_column_text]
 [/vc_column_text][vc_custom_heading text=”Daily” use_theme_fonts=”yes”][vc_column_text]
 [/vc_column_text][/vc_column][/vc_row]
[vc_row][vc_column][vc_column_text]
Cable is rising in line with wave (a) today.
Given this action in place,
the correction in wave [ii] is now underway,
with an overall target at 1.2784 being the focus from here.
Wave (a) is likely to top out with a break of 1.2580 tomorrow,
and then price should turn lower in wave (b) early next week.
Tomorrow;
Watch for wave (a) to break initial resistance at 1.2580.
[/vc_column_text][/vc_column][/vc_row]
[vc_row][vc_column][vc_separator border_width=”5″][/vc_column][/vc_row][vc_row][vc_column][vc_column_text]
USDJPY
[/vc_column_text][/vc_column][/vc_row][vc_row][vc_column][vc_separator border_width=”5″][/vc_column][/vc_row][vc_row][vc_column width=”2/3″][vc_custom_heading text=”1 hr” use_theme_fonts=”yes”][vc_column_text]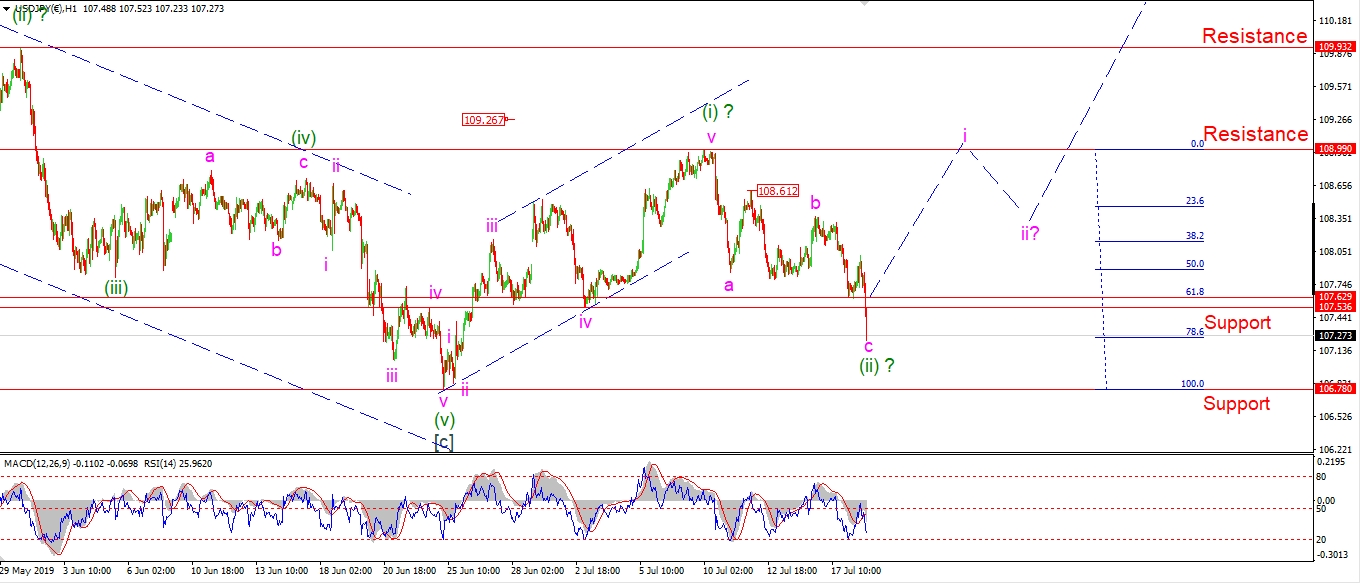 [/vc_column_text][/vc_column][vc_column width=”1/3″][vc_custom_heading text=”4 Hours” use_theme_fonts=”yes”][vc_column_text]
 [/vc_column_text][vc_custom_heading text=”Daily” use_theme_fonts=”yes”][vc_column_text]
 [/vc_column_text][/vc_column][/vc_row]
[vc_row][vc_column][vc_column_text]
USDJPY is hitting into critical territory now.
A break of support today has triggered the alternate count,
The price has reached previous fourth wave support at 107.53,
and the 78% retracement level has also been met.
If we are to see a turn higher in wave (iii),
then now is the time.
Tomorrow;
watch for wave (ii) to find support above 106.78.
We should see a spike higher to begin wave ‘i’ by tomorrow evening.
[/vc_column_text][/vc_column][/vc_row]
[vc_row][vc_column][vc_separator border_width=”5″][/vc_column][/vc_row][vc_row][vc_column][vc_column_text]
DOW JONES INDUSTRIALS
[/vc_column_text][/vc_column][/vc_row][vc_row][vc_column][vc_separator border_width=”5″][/vc_column][/vc_row][vc_row][vc_column width=”2/3″][vc_custom_heading text=”1 hr” use_theme_fonts=”yes”][vc_column_text]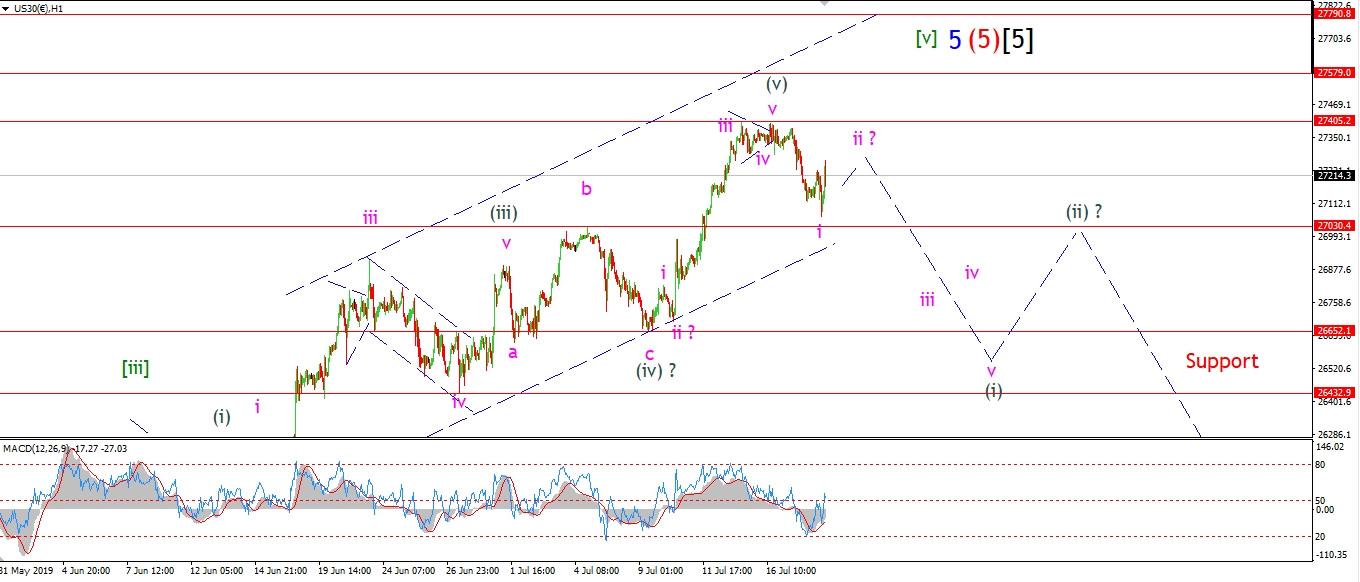 [/vc_column_text][/vc_column][vc_column width=”1/3″][vc_custom_heading text=”4 Hours” use_theme_fonts=”yes”][vc_column_text]
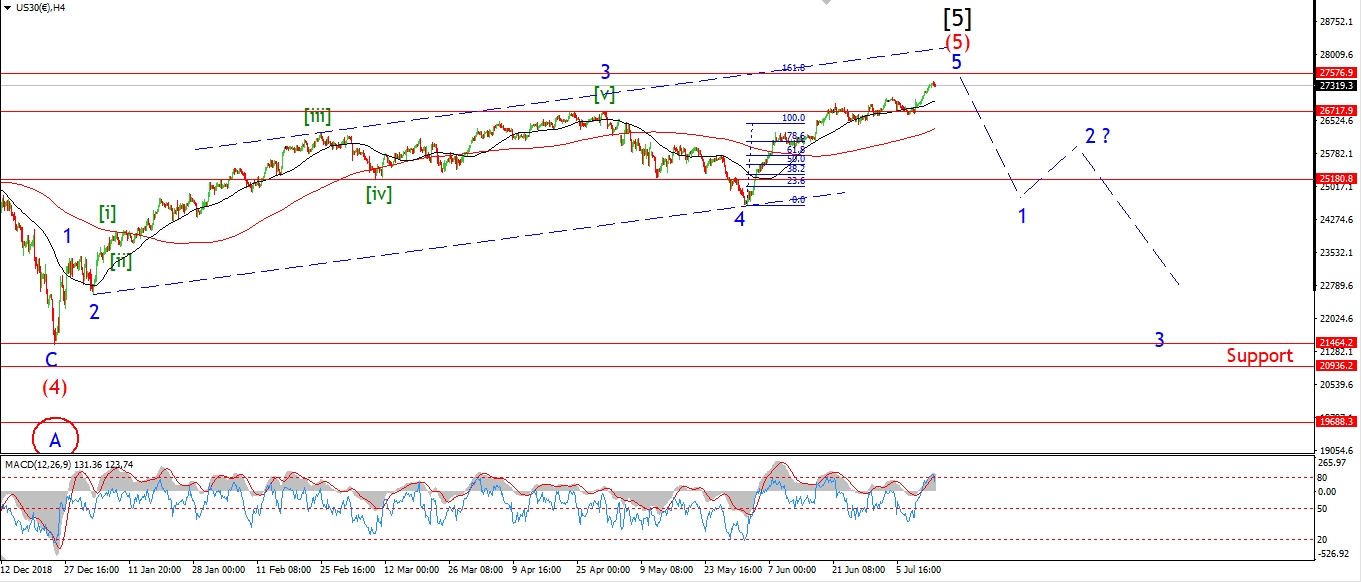 [/vc_column_text][vc_custom_heading text=”Daily” use_theme_fonts=”yes”][vc_column_text]
 [/vc_column_text][/vc_column][/vc_row]
[vc_row][vc_column][vc_column_text]
The Dow has broken out of the previous corrective pattern today.
As a result,
I am willing to consider the recent top as the final high for this rally.
A continued decline off the high pushed very close to the 27000 level at the lows.
And the decline off the high has traced out a reasonably clear five waves down.
I have labelled this as wave ‘i’ down.
The market has recovered this evening
so I am looking for a three wave correction in wave ‘ii’ to form now.
And then next week should bring further declines to form a larger bearish signal.
tomorrow;
watch for wave ‘ii’ to form a bearish lower high in three waves.
This should leave the door open for a sharp drop next week in wave ‘iii’ of (i).
[/vc_column_text][/vc_column][/vc_row]
[vc_row][vc_column][vc_separator border_width=”5″][/vc_column][/vc_row][vc_row][vc_column][vc_column_text]
GOLD
[/vc_column_text][/vc_column][/vc_row][vc_row][vc_column][vc_separator border_width=”5″][/vc_column][/vc_row][vc_row][vc_column width=”2/3″][vc_custom_heading text=”1 hr” use_theme_fonts=”yes”][vc_column_text]
 [/vc_column_text][/vc_column][vc_column width=”1/3″][vc_custom_heading text=”4 Hours” use_theme_fonts=”yes”][vc_column_text]
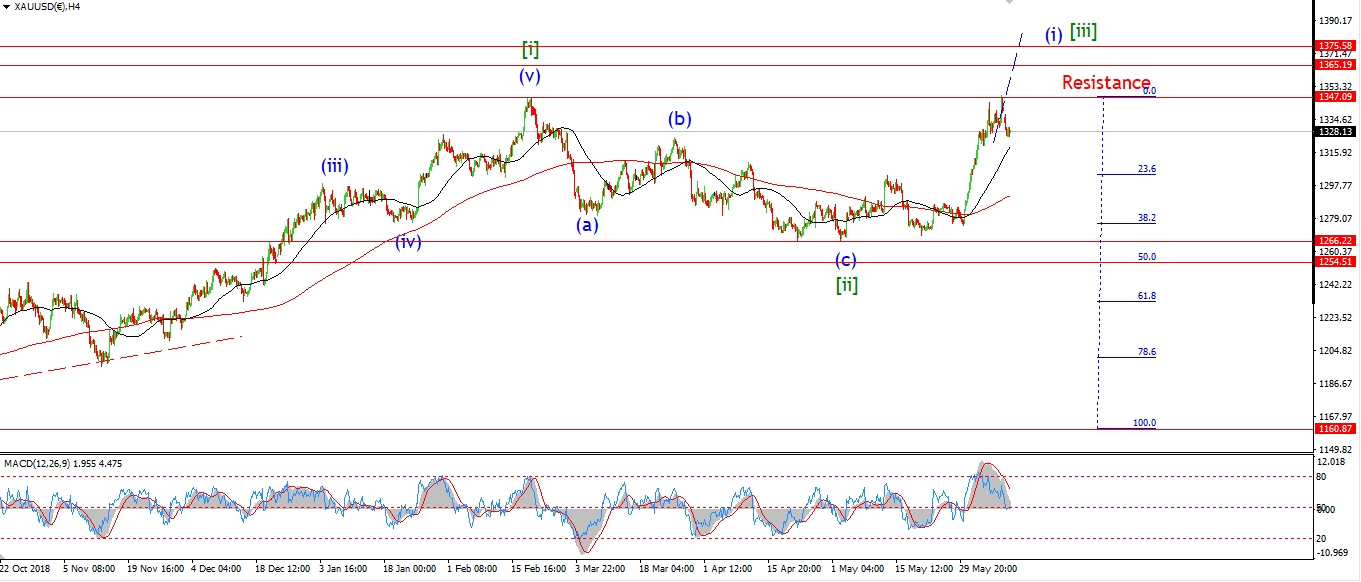 [/vc_column_text][vc_custom_heading text=”Daily” use_theme_fonts=”yes”][vc_column_text]
 [/vc_column_text][/vc_column][/vc_row]
[vc_row][vc_column][vc_column_text]
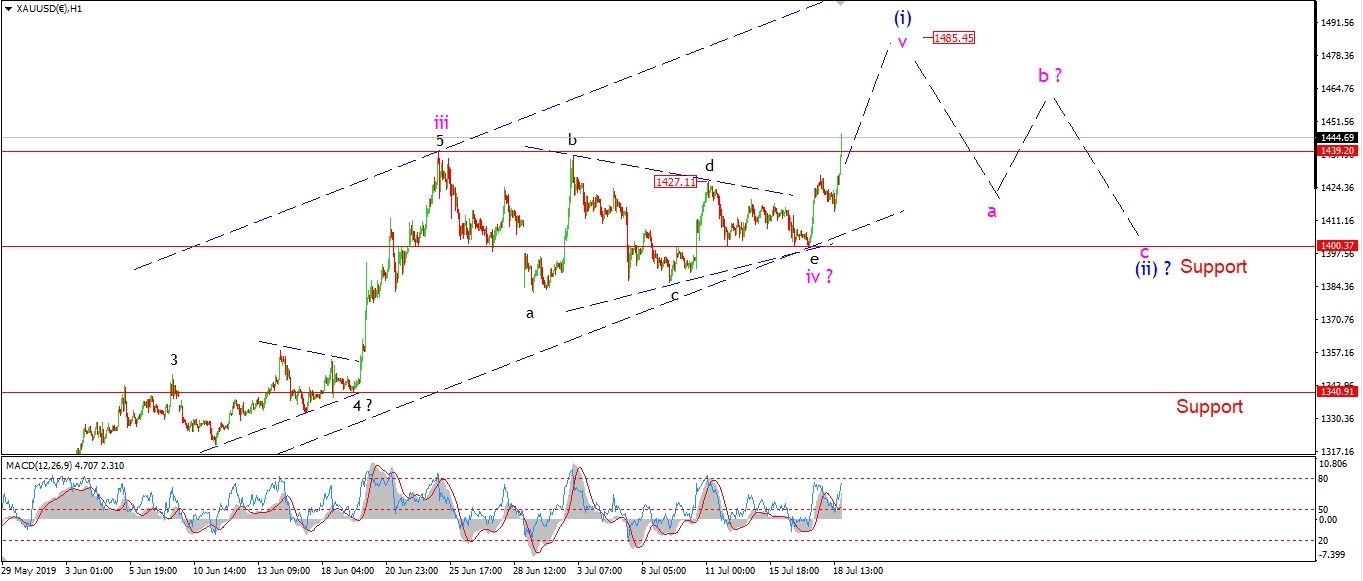
Gold is heading higher again today which confirms the new wave count.
The high of wave ‘iii’ is about to be broken at 1439 as I write.
A break of this level should lead to a rally towards the upper trend line again in wave ‘v’ of (i).
Wave (i) itself may even break the 1500 level before completing,
we will see next week!
If that does occur,
we will likely hit an over bullish extreme in Gold,
and then it will be time for a correction into wave (ii) blue to begin.
Tomorrow;
Watch for wave ‘v’ to continue higher for the next few days to break 1500 at the upper end.
[/vc_column_text][/vc_column][/vc_row]
[vc_row][vc_column][vc_separator border_width=”5″][/vc_column][/vc_row][vc_row][vc_column][vc_column_text]
U.S CRUDE OIL
[/vc_column_text][/vc_column][/vc_row][vc_row][vc_column][vc_separator border_width=”5″][/vc_column][/vc_row][vc_row][vc_column width=”2/3″][vc_custom_heading text=”1 hr” use_theme_fonts=”yes”][vc_column_text]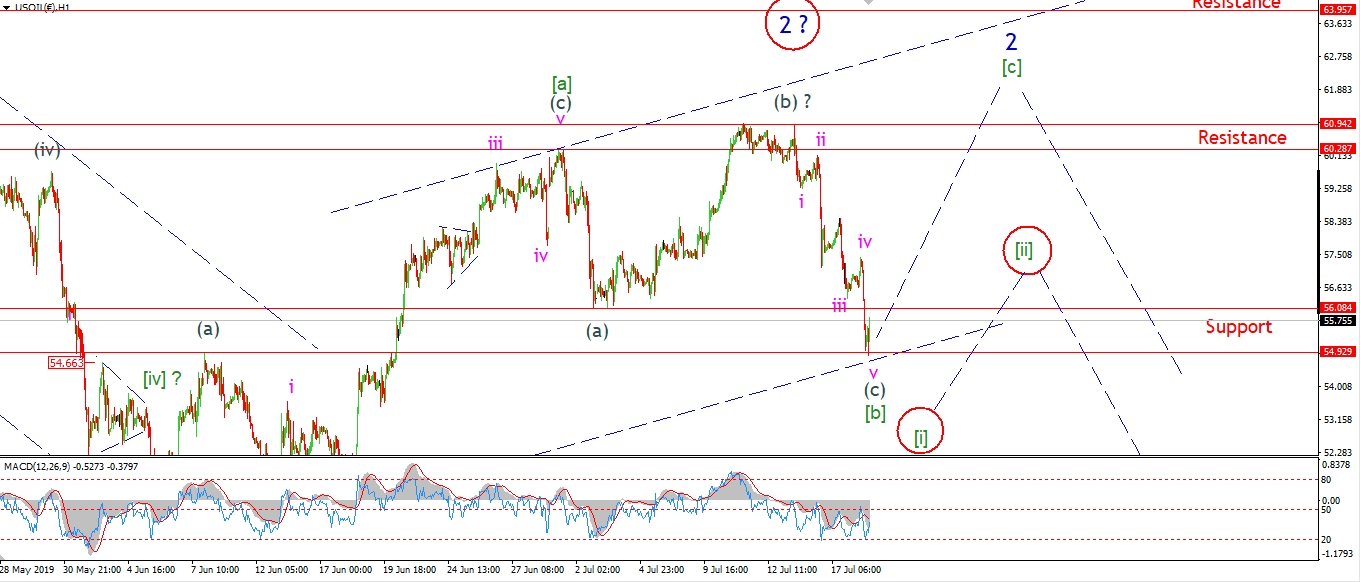 [/vc_column_text][/vc_column][vc_column width=”1/3″][vc_custom_heading text=”4 Hours” use_theme_fonts=”yes”][vc_column_text]
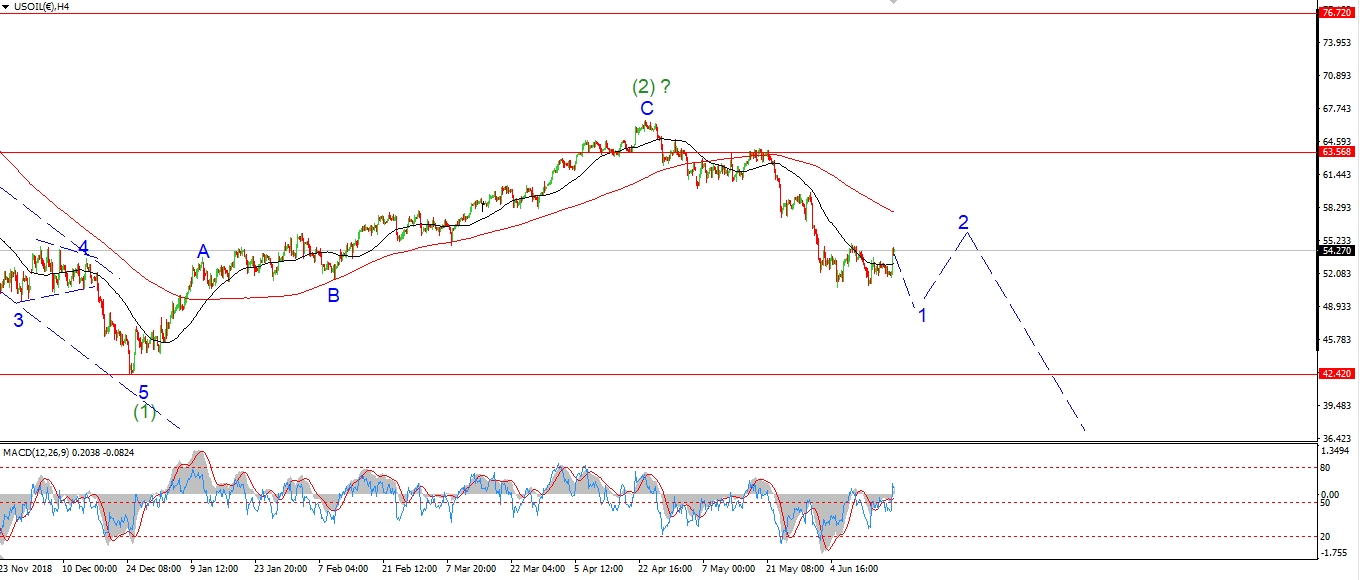 [/vc_column_text][vc_custom_heading text=”Daily” use_theme_fonts=”yes”][vc_column_text]
 [/vc_column_text][/vc_column][/vc_row]
[vc_row][vc_column][vc_column_text]
Crude is also leaning towards the bearish alternate count this evening after another sharp fall today.
The price is back to the lower support level this evening of wave (a),
and we have a nice five wave decline off the recent highs.
The bearish side of the equation is building thats for sure.
I have not switched to the alternate count just yet,
but,
if we see a three wave rally from here to another corrective lower high,
that action will trigger the bearish count.
Tomorrow;
Watch for this decline to complete at support,
and return higher again in wave [c] or [ii].
the action off this low will be the deciding factor for which count we use.
[/vc_column_text][/vc_column][/vc_row]
[vc_row][vc_column][vc_separator border_width=”5″][/vc_column][/vc_row][vc_row][vc_column][vc_column_text]
US 10 yr Treasuries.
[/vc_column_text][/vc_column][/vc_row][vc_row][vc_column][vc_separator border_width=”5″][/vc_column][/vc_row][vc_row][vc_column width=”2/3″][vc_custom_heading text=”1 hr” use_theme_fonts=”yes”][vc_column_text]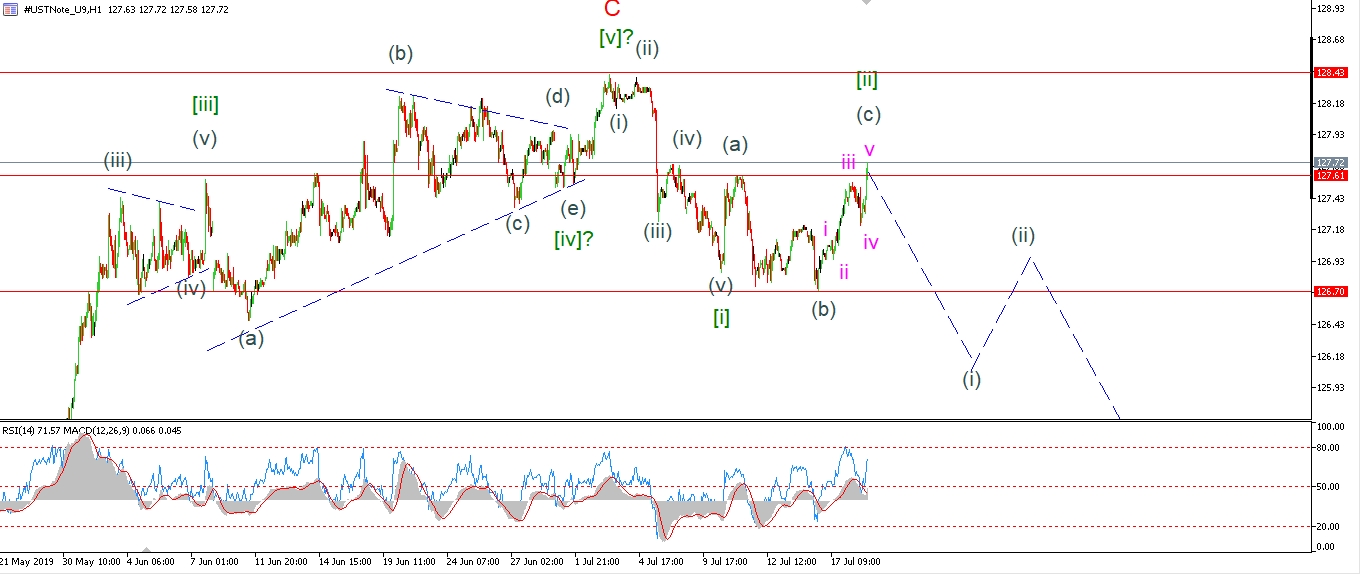 [/vc_column_text][/vc_column][vc_column width=”1/3″][vc_custom_heading text=”4 Hours” use_theme_fonts=”yes”][vc_column_text]
 [/vc_column_text][vc_custom_heading text=”Daily” use_theme_fonts=”yes”][vc_column_text]
 [/vc_column_text][/vc_column][/vc_row]
[vc_row][vc_column][vc_column_text]
The bond market has rallied with stocks all the way off the December lows, but this rally is ending.
And now bonds are ready to fall again along with all financial assets over the coming months as the new bear-market begins.
Bonds rallied today in a possible wave (c) of [ii].
the rally broke the minimum target at 127.61 at wave (a),
and the rally has traced out a five wave form in wave (c) also.
This all suggests a correction in wave [ii] is now coming to an end,
and the decline into wave [iii] is set to begin next week.
Tomorrow;
Watch for 128.43 to hold and wave [ii] to top out very soon.
A break of 126.70 next week will confirm wave [iii] has begun.
[/vc_column_text][/vc_column][/vc_row]
[vc_row][vc_column][vc_separator border_width=”5″][/vc_column][/vc_row][vc_row][vc_column][vc_column_text]
SILVER
[/vc_column_text][/vc_column][/vc_row][vc_row][vc_column][vc_separator border_width=”5″][/vc_column][/vc_row][vc_row][vc_column width=”2/3″][vc_custom_heading text=”1 hr” use_theme_fonts=”yes”][vc_column_text]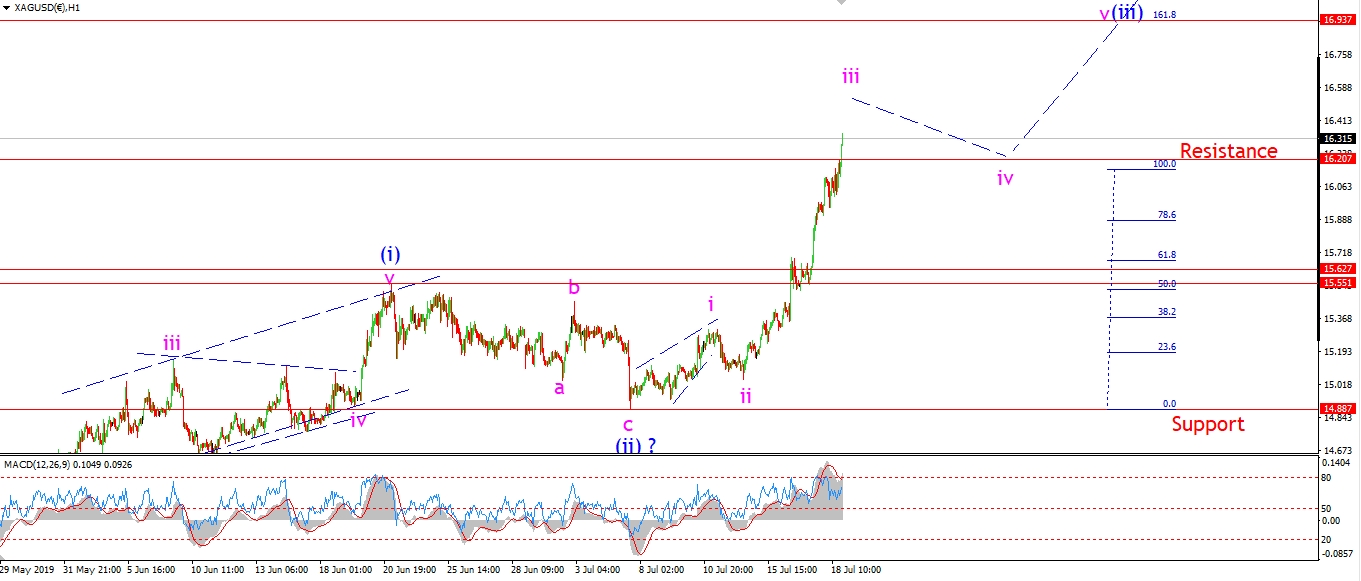 [/vc_column_text][/vc_column][vc_column width=”1/3″][vc_custom_heading text=”4 Hours” use_theme_fonts=”yes”][vc_column_text]
 [/vc_column_text][vc_custom_heading text=”Daily” use_theme_fonts=”yes”][vc_column_text]
 [/vc_column_text][/vc_column][/vc_row]
[vc_row][vc_column][vc_column_text]
Silver has found wings this week!
The price has rallied by 100 cents over in one week,
this is the sort of action that you might expect in a third of a third wave.
With that in mind,
I have changed the short term count to reflect the rally.
The rise this week is viewed as wave ‘iii’ of (iii).
And the target for wave (iii) is set at 16.93.
This level is where wave (iii) will reach 161.8% of wave (i) blue.
Tomorrow;
Wave ‘iii’ should find a top very soon,
and the price will likely correct off that high to begin wave ‘iv’ pink next week.
Watch for wave ‘iii’ to complete tomorrow.
[/vc_column_text][/vc_column][/vc_row]
[vc_row][vc_column][vc_separator border_width=”5″][/vc_column][/vc_row][vc_row][vc_column][vc_column_text]
S&P 500.
[/vc_column_text][/vc_column][/vc_row][vc_row][vc_column][vc_separator border_width=”5″][/vc_column][/vc_row][vc_row][vc_column width=”2/3″][vc_custom_heading text=”1 hr” use_theme_fonts=”yes”][vc_column_text]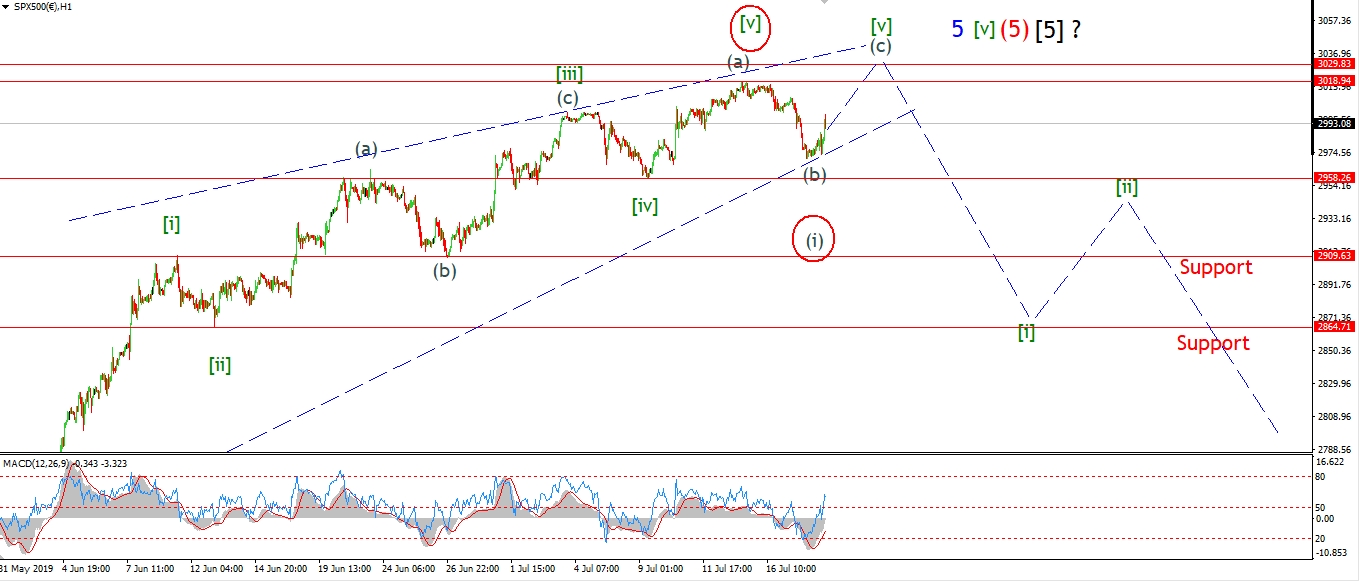 [/vc_column_text][/vc_column][vc_column width=”1/3″][vc_custom_heading text=”4 Hours” use_theme_fonts=”yes”][vc_column_text]
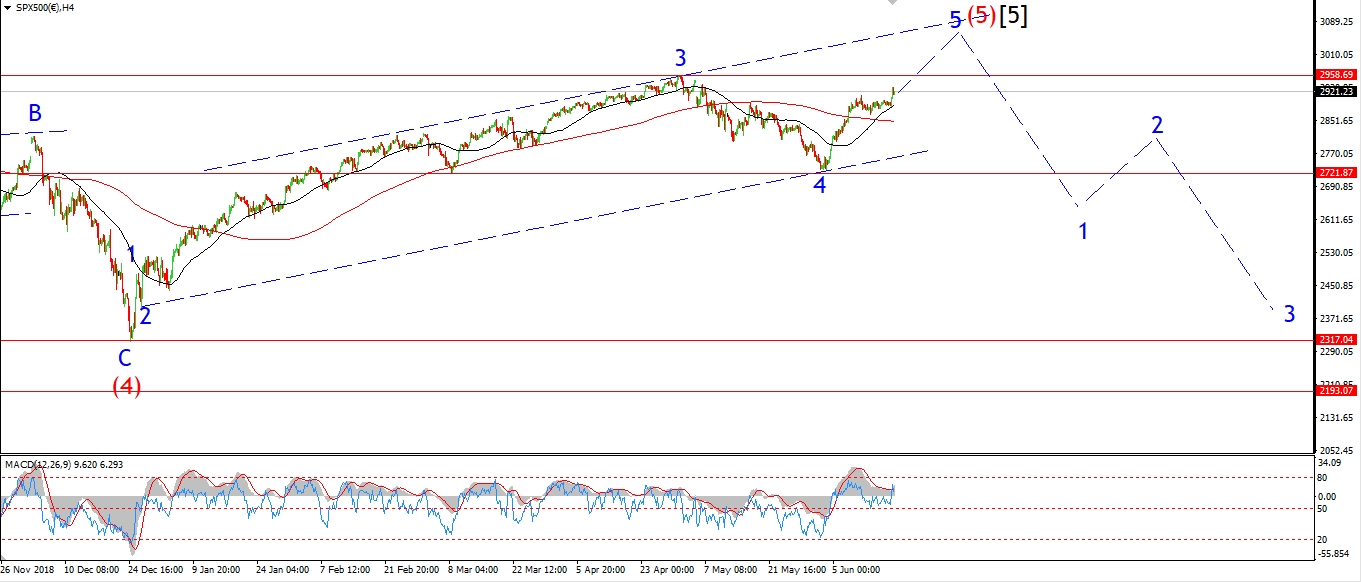 [/vc_column_text][vc_custom_heading text=”Daily” use_theme_fonts=”yes”][vc_column_text]
 [/vc_column_text][/vc_column][/vc_row]
[vc_row][vc_column][vc_column_text]
I have switched to the alternate count in the S&P this evening.
This involves an ending diagonal for wave 5 blue to complete the rally off the December lows.
The only question remaining now is this;
is wave [v] green complete at the recent high,
or do we have another high left in wave (c) of [v] to complete the ending diagonal.
If the rally is complete,
then todays decline will be wave (i) down with wave (ii) now underway.
And next week will begin with a bang with a decline in wave (iii).
Wave (iii) of the alternate count should break support at 2900.
Tomorrow;
A corrective rise to a lower high will favor the alternate count now.
And a fresh decline tomorrow below 2958 will seal the deal!
[/vc_column_text][/vc_column][/vc_row]
[vc_row][vc_column][vc_separator border_width=”5″][/vc_column][/vc_row]