
[vc_row][vc_column][vc_separator border_width=”5″][/vc_column][/vc_row]
[vc_row][vc_column][vc_column_text]
Hi there all.
[/vc_column_text][/vc_column][/vc_row]
[vc_row][vc_column][vc_separator border_width=”5″][/vc_column][/vc_row]
[vc_row][vc_column][vc_column_text]
EURUSD
[/vc_column_text][/vc_column][/vc_row]
[vc_row][vc_column][vc_separator border_width=”5″][/vc_column][/vc_row][vc_row][vc_column width=”2/3″][vc_custom_heading text=”1 hr” use_theme_fonts=”yes”][vc_column_text]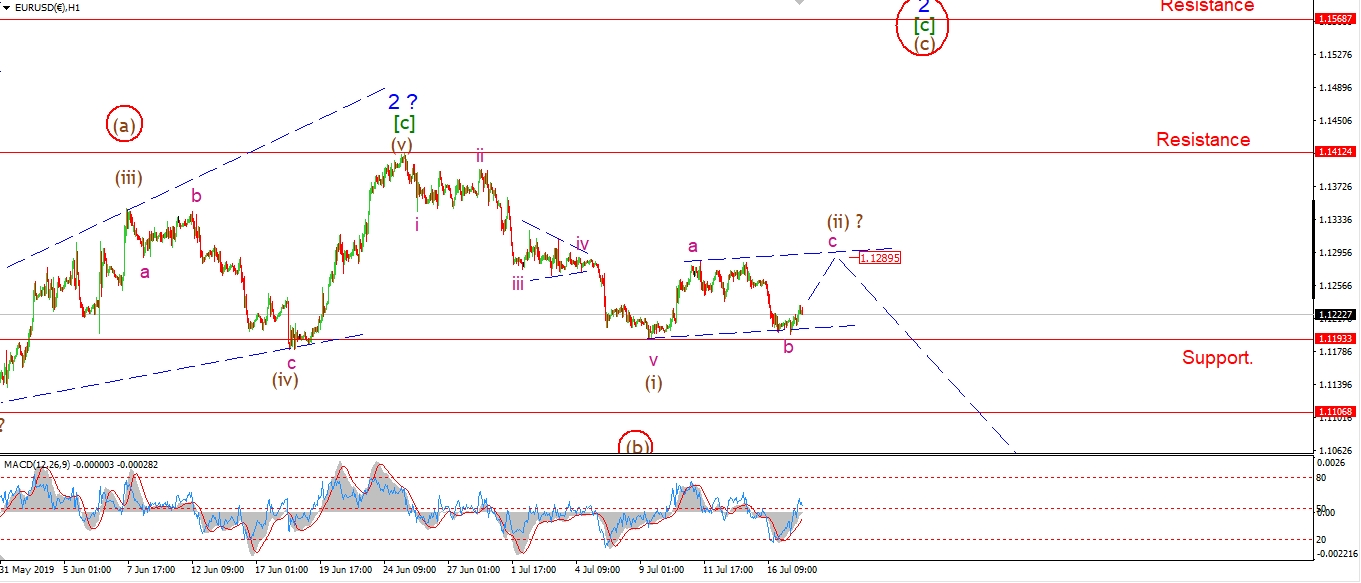 [/vc_column_text][/vc_column][vc_column width=”1/3″][vc_custom_heading text=”4 Hours” use_theme_fonts=”yes”][vc_column_text]
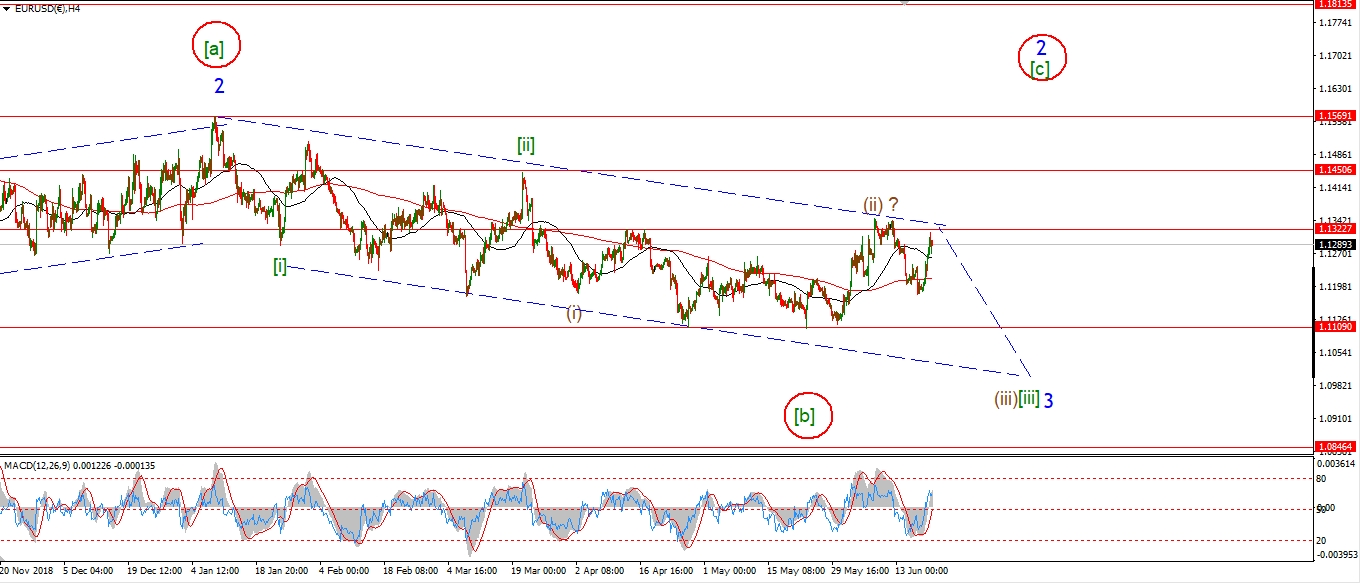 [/vc_column_text][vc_custom_heading text=”Daily” use_theme_fonts=”yes”][vc_column_text]
 [/vc_column_text][/vc_column][/vc_row]
[vc_row][vc_column][vc_column_text]
EURUSD seems to have found support above the recent low at wave (i).
Wave ‘b’ has a clear 3,3,5 internal structure which completed at a higher low.
And this confirms the idea that wave ‘b’ of (ii) traced out a flat correction.
The price is off the lows this evening,
which signals wave ‘c’ of (ii) is now underway.
The target for wave ‘c’ and wave (ii) to complete lies at 1.1290.
At that point we will have a bearish signal in place for EURUSD,
and wave (iii) down will be ready to go.
Tomorrow;
Watch for 1.1193 to hold and wave ‘c’ to continue higher to fill out the trend channel.
[/vc_column_text][/vc_column][/vc_row]
[vc_row][vc_column][vc_separator border_width=”5″][/vc_column][/vc_row][vc_row][vc_column][vc_column_text]
GBPUSD
[/vc_column_text][/vc_column][/vc_row][vc_row][vc_column][vc_separator border_width=”5″][/vc_column][/vc_row][vc_row][vc_column width=”2/3″][vc_custom_heading text=”1 hr” use_theme_fonts=”yes”][vc_column_text]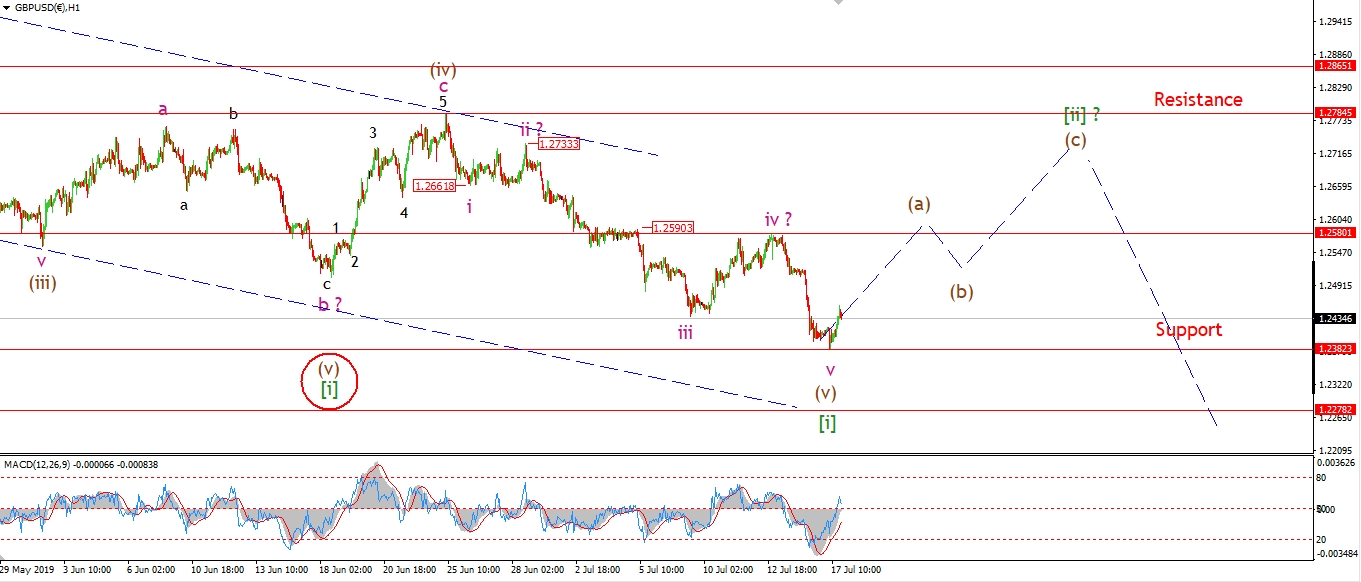 [/vc_column_text][/vc_column][vc_column width=”1/3″][vc_custom_heading text=”4 Hours” use_theme_fonts=”yes”][vc_column_text]
 [/vc_column_text][vc_custom_heading text=”Daily” use_theme_fonts=”yes”][vc_column_text]
 [/vc_column_text][/vc_column][/vc_row]
[vc_row][vc_column][vc_column_text]
I have changed the short term count this evening to account for Tuesdays sharp new low.
The drop off Fridays high is in five waves into 1.2382,
This is now viewed as the final low of wave (v) of [i].
And todays rally should be the beginning of a three wave correction in wave [ii].
The target for wave [ii] lies at 1.2784.
Tomorrow;
Watch for wave (a) to continue higher to the recent wave ‘iv’ at 1.2580
[/vc_column_text][/vc_column][/vc_row]
[vc_row][vc_column][vc_separator border_width=”5″][/vc_column][/vc_row][vc_row][vc_column][vc_column_text]
USDJPY
[/vc_column_text][/vc_column][/vc_row][vc_row][vc_column][vc_separator border_width=”5″][/vc_column][/vc_row][vc_row][vc_column width=”2/3″][vc_custom_heading text=”1 hr” use_theme_fonts=”yes”][vc_column_text]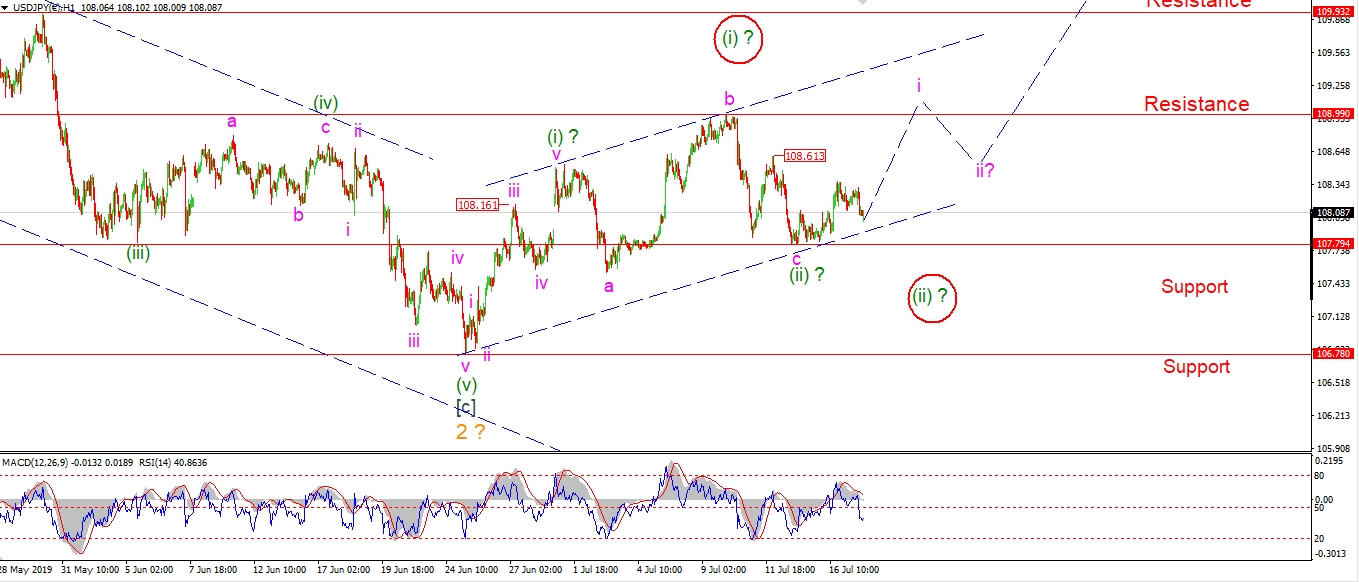 [/vc_column_text][/vc_column][vc_column width=”1/3″][vc_custom_heading text=”4 Hours” use_theme_fonts=”yes”][vc_column_text]
 [/vc_column_text][vc_custom_heading text=”Daily” use_theme_fonts=”yes”][vc_column_text]
 [/vc_column_text][/vc_column][/vc_row]
[vc_row][vc_column][vc_column_text]
USDJPY has not delivered the impulsive action that is expected to begin wave (iii) up.
The rise off 107.80 is beginning to look very corrective now,
So I am wondering if this rise is a correction higher.
with that in mind,
I must allow for the possibility that wave (i) and (ii) have taken a different configuration.
This possibility is shown in the alternate count circled in red.
The alternate count will be triggered of 107.79 is broken again.
Tomorrow;
There is still a chance that wave ‘i’ will rally tomorrow and affirm the current count.
If we see a rally above 108.60 that will favor the current bullish count.
[/vc_column_text][/vc_column][/vc_row]
[vc_row][vc_column][vc_separator border_width=”5″][/vc_column][/vc_row][vc_row][vc_column][vc_column_text]
DOW JONES INDUSTRIALS
[/vc_column_text][/vc_column][/vc_row][vc_row][vc_column][vc_separator border_width=”5″][/vc_column][/vc_row][vc_row][vc_column width=”2/3″][vc_custom_heading text=”1 hr” use_theme_fonts=”yes”][vc_column_text]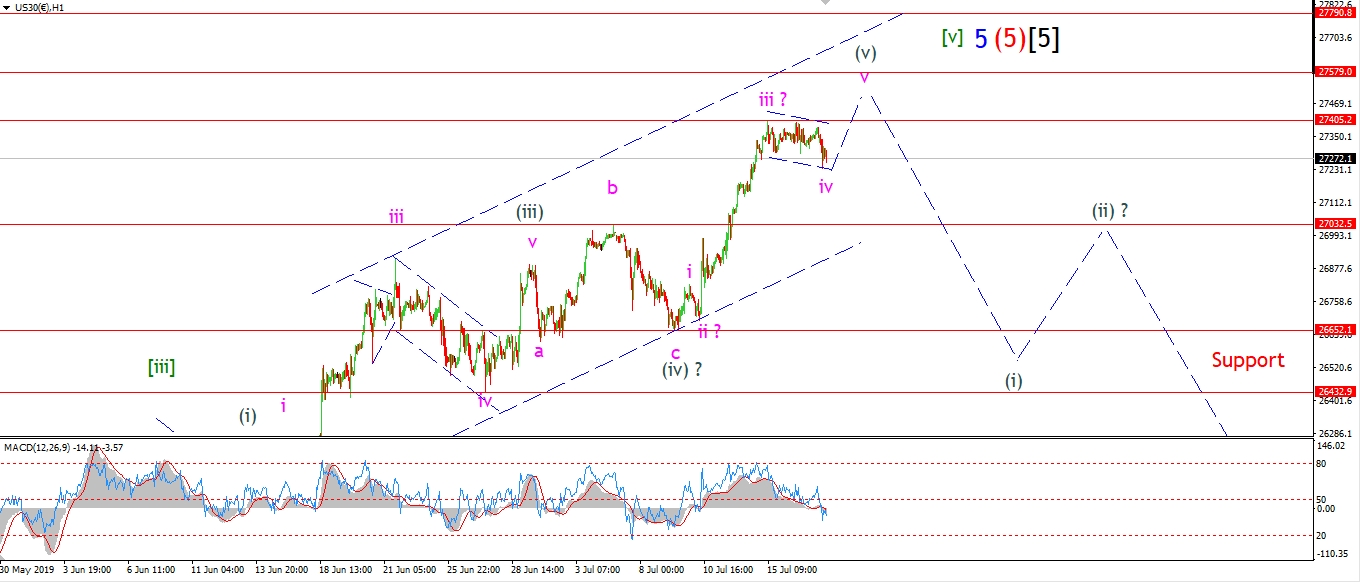 [/vc_column_text][/vc_column][vc_column width=”1/3″][vc_custom_heading text=”4 Hours” use_theme_fonts=”yes”][vc_column_text]
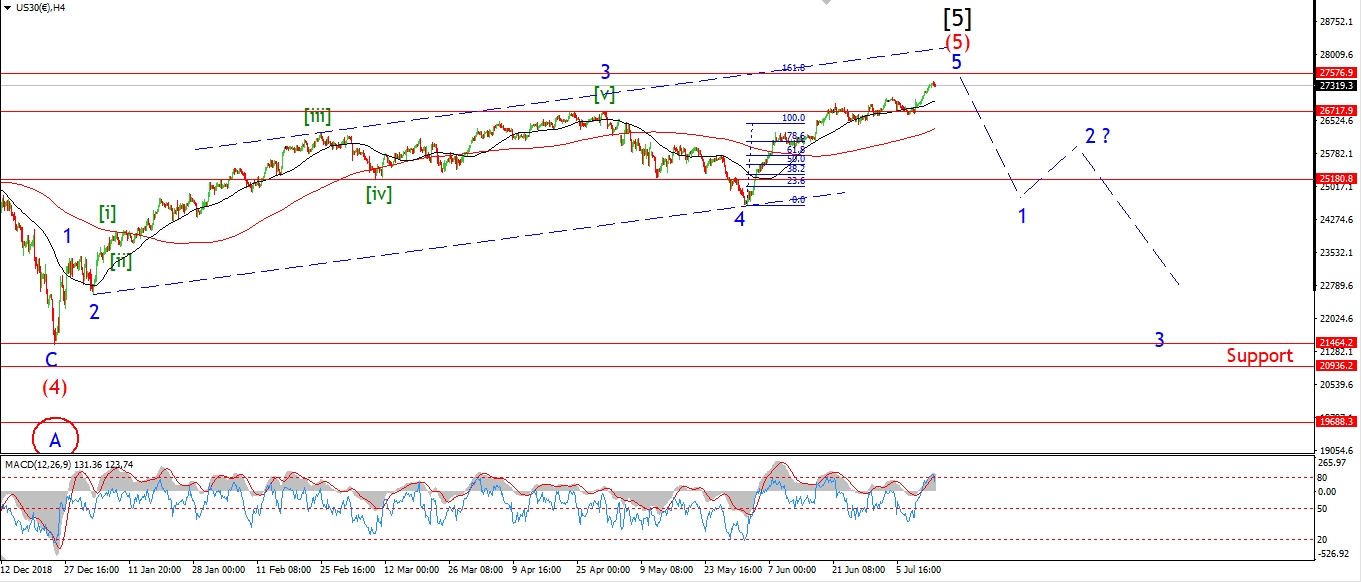 [/vc_column_text][vc_custom_heading text=”Daily” use_theme_fonts=”yes”][vc_column_text]
 [/vc_column_text][/vc_column][/vc_row]
[vc_row][vc_column][vc_column_text]
The DOW is still falling correctively off the recent all time high.
The price action fits within a trend channel quite well,
and this leads me to believe that this decline is wave ‘iv’ of (v)
with wave ‘v’ pink left to complete five waves up.
I would like to see wave ‘iv’ find a final low very soon without threatening 27000 again.
So the action tomorrow may prove critical in the short term.
Tomorrow:
Watch for wave ‘iv’ to complete above 27000 and then wave ‘v’ should break above 27500.
[/vc_column_text][/vc_column][/vc_row]
[vc_row][vc_column][vc_separator border_width=”5″][/vc_column][/vc_row][vc_row][vc_column][vc_column_text]
GOLD
[/vc_column_text][/vc_column][/vc_row][vc_row][vc_column][vc_separator border_width=”5″][/vc_column][/vc_row][vc_row][vc_column width=”2/3″][vc_custom_heading text=”1 hr” use_theme_fonts=”yes”][vc_column_text]
 [/vc_column_text][/vc_column][vc_column width=”1/3″][vc_custom_heading text=”4 Hours” use_theme_fonts=”yes”][vc_column_text]
 [/vc_column_text][vc_custom_heading text=”Daily” use_theme_fonts=”yes”][vc_column_text]
 [/vc_column_text][/vc_column][/vc_row]
[vc_row][vc_column][vc_column_text]
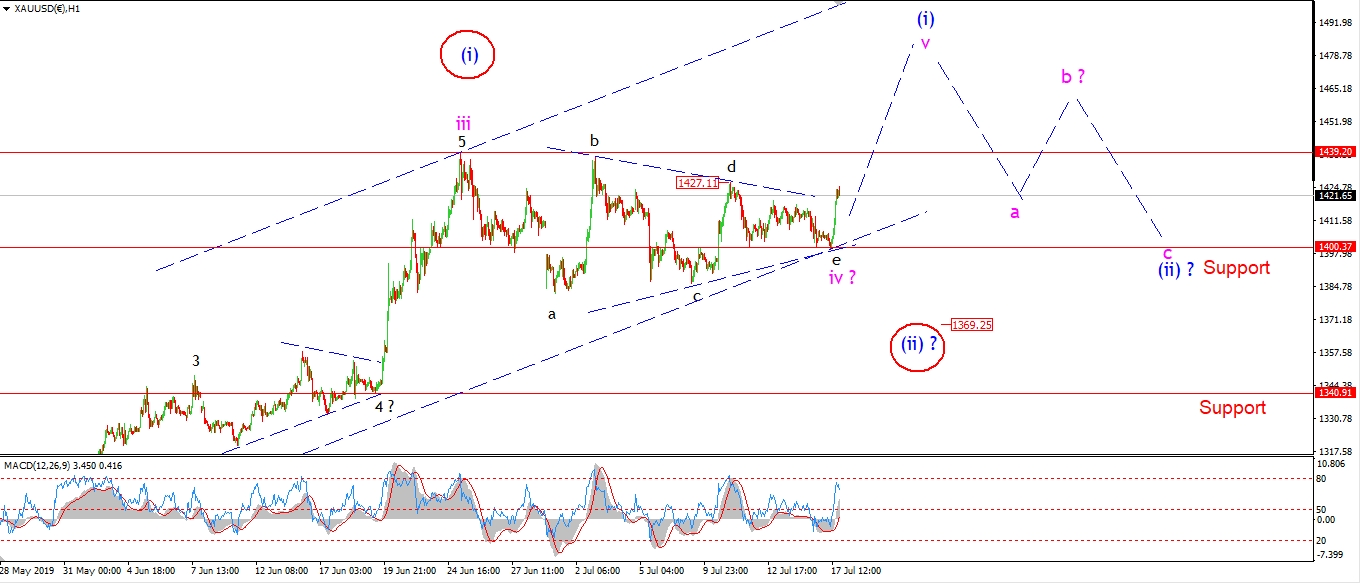
Gold did rally unexpectedly today,
without breaking the 1427 level to invalidate the triangle just yet.
The recent wave count is still possible,
But todays rally was sufficient to call into question the recent wave count in wave (ii) blue.
So I have switched to the next most likely count.
This shows the recent triangle as a correction in wave ‘iv’ pink.
And todays rally as the final ascent in wave ‘v’ of (i).
Wave do expect wave (ii) to correct soon enough,
but the wave count calls for another high in wave ‘v’ of (i) before wave (ii) begins.
Tomorrow;
Watch for 1437 to hold at wave ‘iv’ and a rally up towards 14.80 to compelte wave (i).
[/vc_column_text][/vc_column][/vc_row]
[vc_row][vc_column][vc_separator border_width=”5″][/vc_column][/vc_row][vc_row][vc_column][vc_column_text]
U.S CRUDE OIL
[/vc_column_text][/vc_column][/vc_row][vc_row][vc_column][vc_separator border_width=”5″][/vc_column][/vc_row][vc_row][vc_column width=”2/3″][vc_custom_heading text=”1 hr” use_theme_fonts=”yes”][vc_column_text]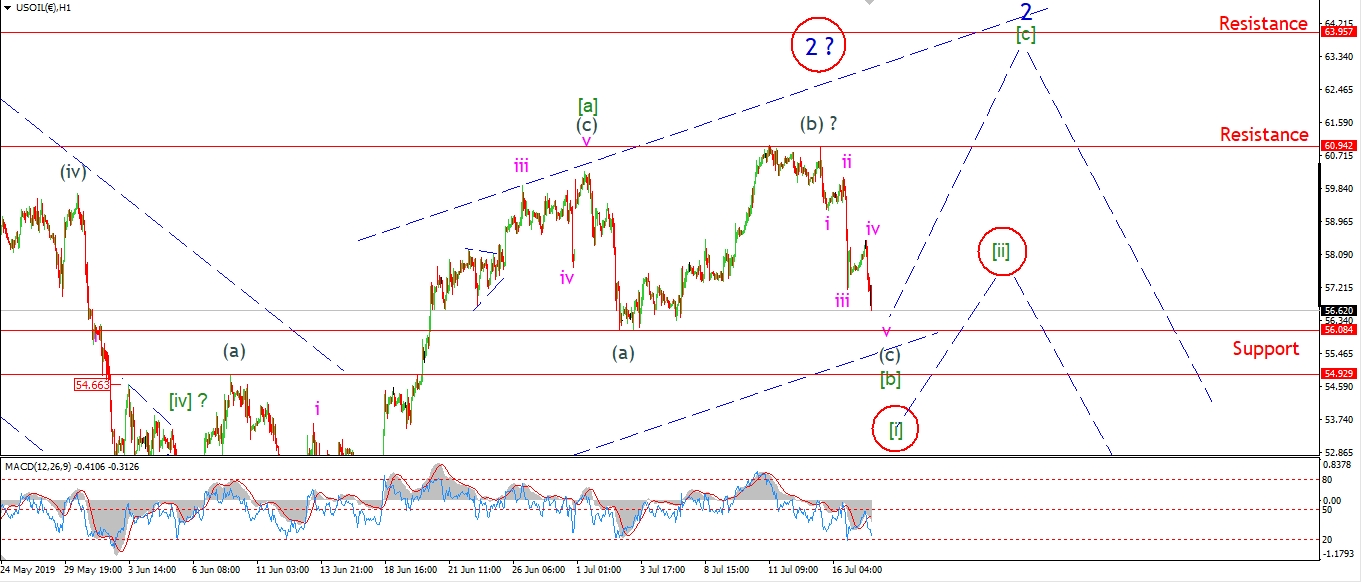 [/vc_column_text][/vc_column][vc_column width=”1/3″][vc_custom_heading text=”4 Hours” use_theme_fonts=”yes”][vc_column_text]
 [/vc_column_text][vc_custom_heading text=”Daily” use_theme_fonts=”yes”][vc_column_text]
 [/vc_column_text][/vc_column][/vc_row]
[vc_row][vc_column][vc_column_text]
The decline in crude continued with pace today.
If we take Mondays high as the top of wave (b),
then the structure off that top is a clear five wave pattern.
The target for wave (c) remains at 56.00 with a break of the wave (a) low.
That drop will complete wave [b] green,
and then wave [c] green should carry higher over the coming few weeks
to close out the whole corrective rally in wave ‘2’.
The alternate count is still viable,
we should know by early next week if this more bearish interpretation will stand or not.
Tomorrow;
Watch for wave (c) of [ii] to complete at 56.00 and then create a bullish higher low to begin wave [c].
[/vc_column_text][/vc_column][/vc_row]
[vc_row][vc_column][vc_separator border_width=”5″][/vc_column][/vc_row][vc_row][vc_column][vc_column_text]
US 10 yr Treasuries.
[/vc_column_text][/vc_column][/vc_row][vc_row][vc_column][vc_separator border_width=”5″][/vc_column][/vc_row][vc_row][vc_column width=”2/3″][vc_custom_heading text=”1 hr” use_theme_fonts=”yes”][vc_column_text]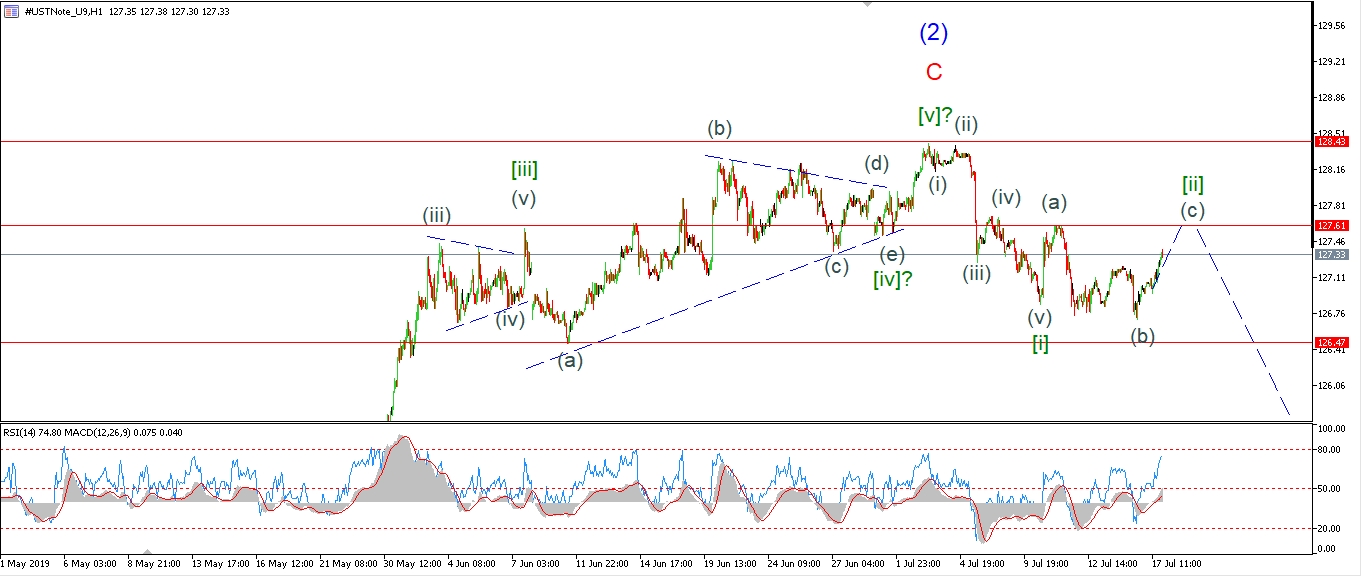 [/vc_column_text][/vc_column][vc_column width=”1/3″][vc_custom_heading text=”4 Hours” use_theme_fonts=”yes”][vc_column_text]
 [/vc_column_text][vc_custom_heading text=”Daily” use_theme_fonts=”yes”][vc_column_text]
 [/vc_column_text][/vc_column][/vc_row]
[vc_row][vc_column][vc_column_text]
Wave (c) of [ii] rallied today off the recent wave (b) low.
The price broke above 127.22 today,
and this signals the larger wave [ii] pattern is now in play.
Once wave (c) completes this week
then we will have a complete bearish impulse wave in place.
And a clear setup leading the way for wave [iii] down.
Tomorrow;
Watch for wave (c) to top out with a break of 127.60 and then begin to drop again in wave [iii].
[/vc_column_text][/vc_column][/vc_row]
[vc_row][vc_column][vc_separator border_width=”5″][/vc_column][/vc_row][vc_row][vc_column][vc_column_text]
SILVER
[/vc_column_text][/vc_column][/vc_row][vc_row][vc_column][vc_separator border_width=”5″][/vc_column][/vc_row][vc_row][vc_column width=”2/3″][vc_custom_heading text=”1 hr” use_theme_fonts=”yes”][vc_column_text]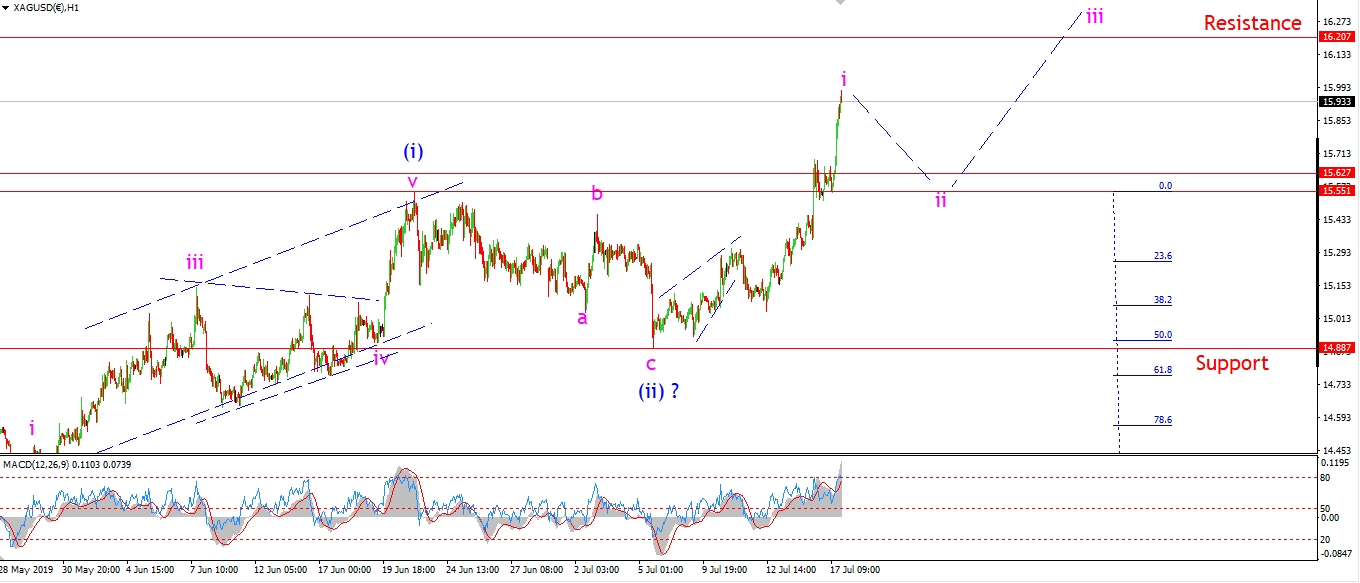 [/vc_column_text][/vc_column][vc_column width=”1/3″][vc_custom_heading text=”4 Hours” use_theme_fonts=”yes”][vc_column_text]
 [/vc_column_text][vc_custom_heading text=”Daily” use_theme_fonts=”yes”][vc_column_text]
 [/vc_column_text][/vc_column][/vc_row]
[vc_row][vc_column][vc_column_text]
Silver put in another strong day today after a brief correction yesterday.
Price is now on the verge of breaking that 16.00 level,
a price we have not seen since last December.
If this is in-fact wave ‘i’ of (iii) now underway,
then this rally in wave (iii) is only beginning
and should continue higher towards 18.00 before completing.
Before that happens,
we must see a correction in wave ‘ii’ complete before wave ‘iii’ of (iii) pushes higher.
Tomorrow;
Wave ‘i’ should compelte soon.
A break of 16.20 will strengthen the bullish case in the longer term.
but I would like to see a correction in three waves off that high soon.
[/vc_column_text][/vc_column][/vc_row]
[vc_row][vc_column][vc_separator border_width=”5″][/vc_column][/vc_row][vc_row][vc_column][vc_column_text]
S&P 500.
[/vc_column_text][/vc_column][/vc_row][vc_row][vc_column][vc_separator border_width=”5″][/vc_column][/vc_row][vc_row][vc_column width=”2/3″][vc_custom_heading text=”1 hr” use_theme_fonts=”yes”][vc_column_text]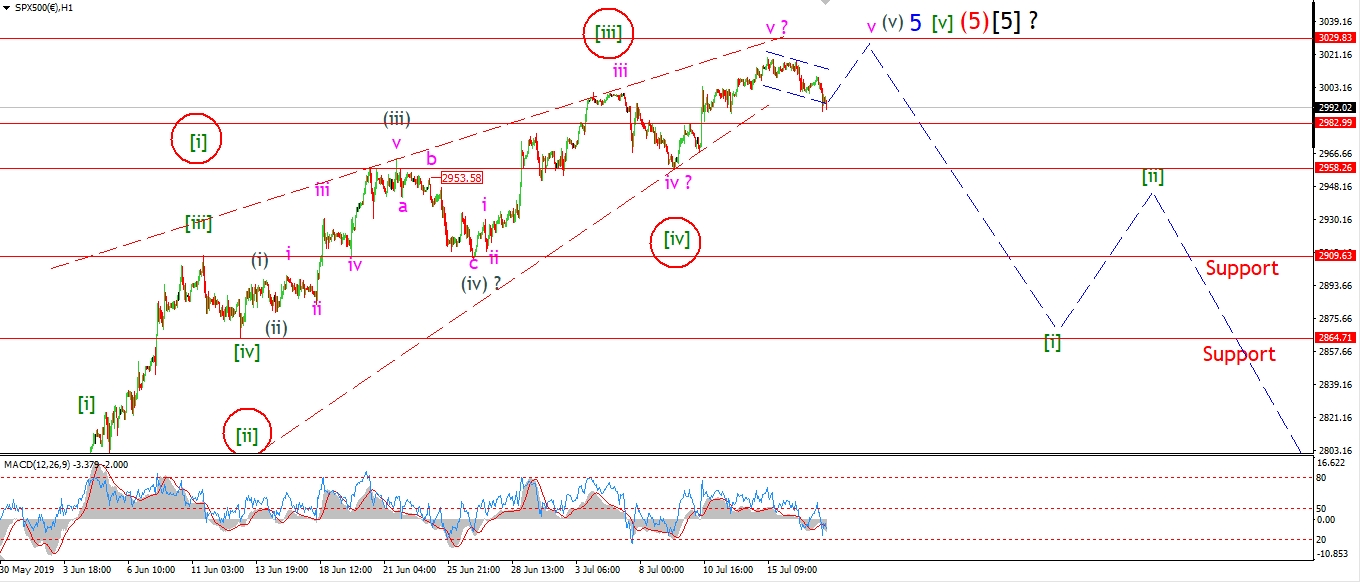 [/vc_column_text][/vc_column][vc_column width=”1/3″][vc_custom_heading text=”4 Hours” use_theme_fonts=”yes”][vc_column_text]
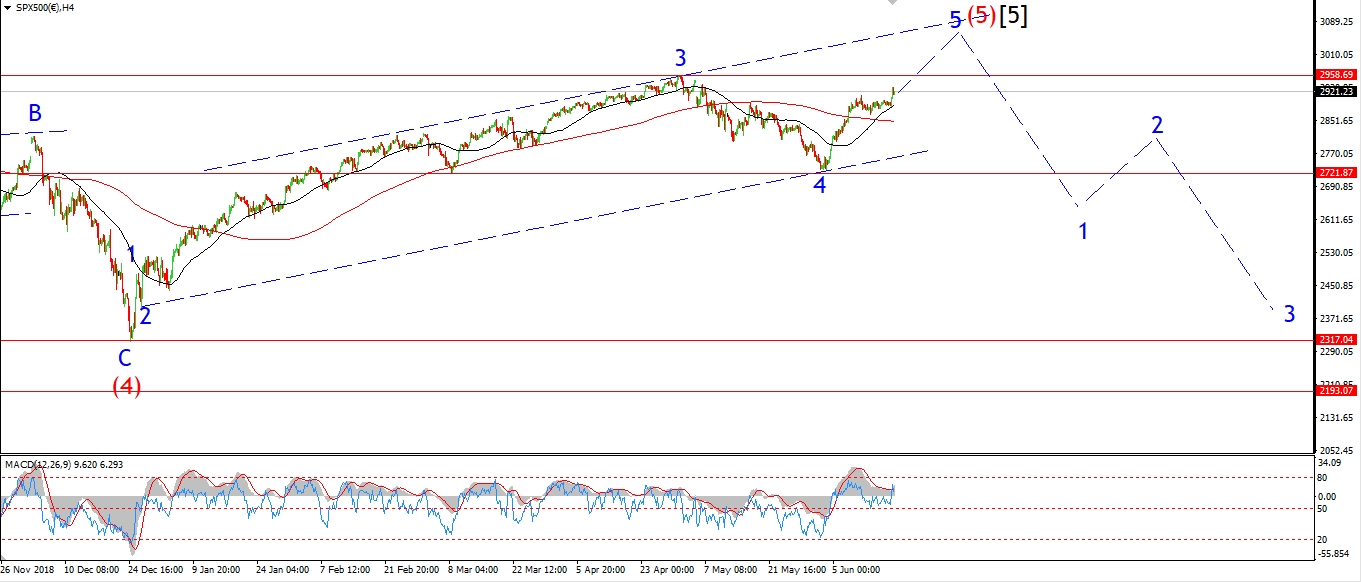 [/vc_column_text][vc_custom_heading text=”Daily” use_theme_fonts=”yes”][vc_column_text]
 [/vc_column_text][/vc_column][/vc_row]
[vc_row][vc_column][vc_column_text]
Although the S&P did get close to that 2982 level at todays lows,
but I still prefer this decline as a correction for the moment.
If the decline picks up pace tomorrow and breaks 2958,
then we can likely call a top in wave (v) grey.
And then begin to work on a bearish signal off that level as illustrated on the short term chart.
The alternate count shown circled in red
will also allow for another new high to complete an ending diagonal wave [v].
Which ever way you slice it,
this rally is now ending and will give way to a very big decline.
The decline to come has a minimum target of 2300 to match the December 2018 lows.
Tomorrow;
Watch for wave ‘iv’ to complete above 2892 and one last rally in wave ‘v’ of (v).
[/vc_column_text][/vc_column][/vc_row]
[vc_row][vc_column][vc_separator border_width=”5″][/vc_column][/vc_row]