
[vc_row][vc_column][vc_separator border_width=”5″][/vc_column][/vc_row]
[vc_row][vc_column][vc_column_text]
Hello all,
welcome back to a new week.
I wanted to show a chart I have been watching for a while now.
Its a long term chart showing the various Libor maturities together.
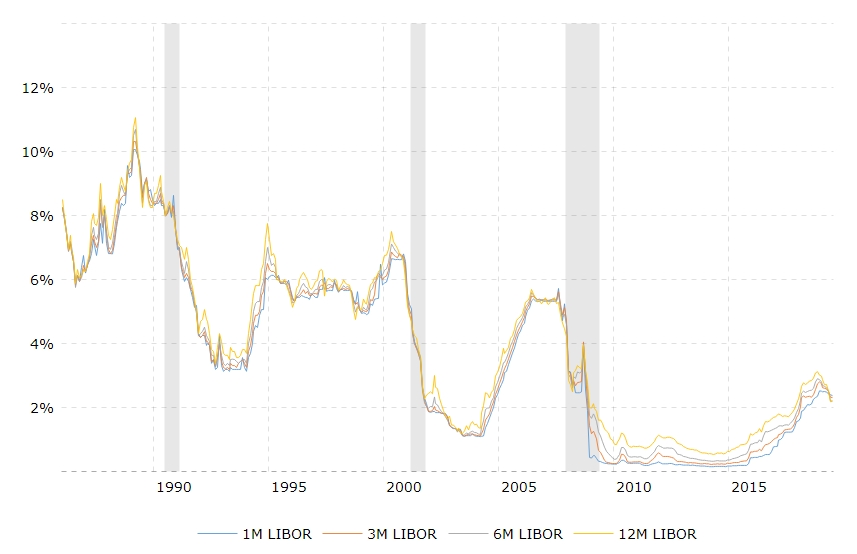
This chart has just registered a major long term sell signal as the 12m libor rate has inverted below the other three.
This chart is signalling a return to harsh times ahead!
Just another in a long line of signals that are pointing in the wrong direction now!
Ok down to business.
[/vc_column_text][/vc_column][/vc_row]
[vc_row][vc_column][vc_separator border_width=”5″][/vc_column][/vc_row]
[vc_row][vc_column][vc_column_text]
EURUSD
[/vc_column_text][/vc_column][/vc_row]
[vc_row][vc_column][vc_separator border_width=”5″][/vc_column][/vc_row][vc_row][vc_column width=”2/3″][vc_custom_heading text=”1 hr” use_theme_fonts=”yes”][vc_column_text] [/vc_column_text][/vc_column][vc_column width=”1/3″][vc_custom_heading text=”4 Hours” use_theme_fonts=”yes”][vc_column_text]
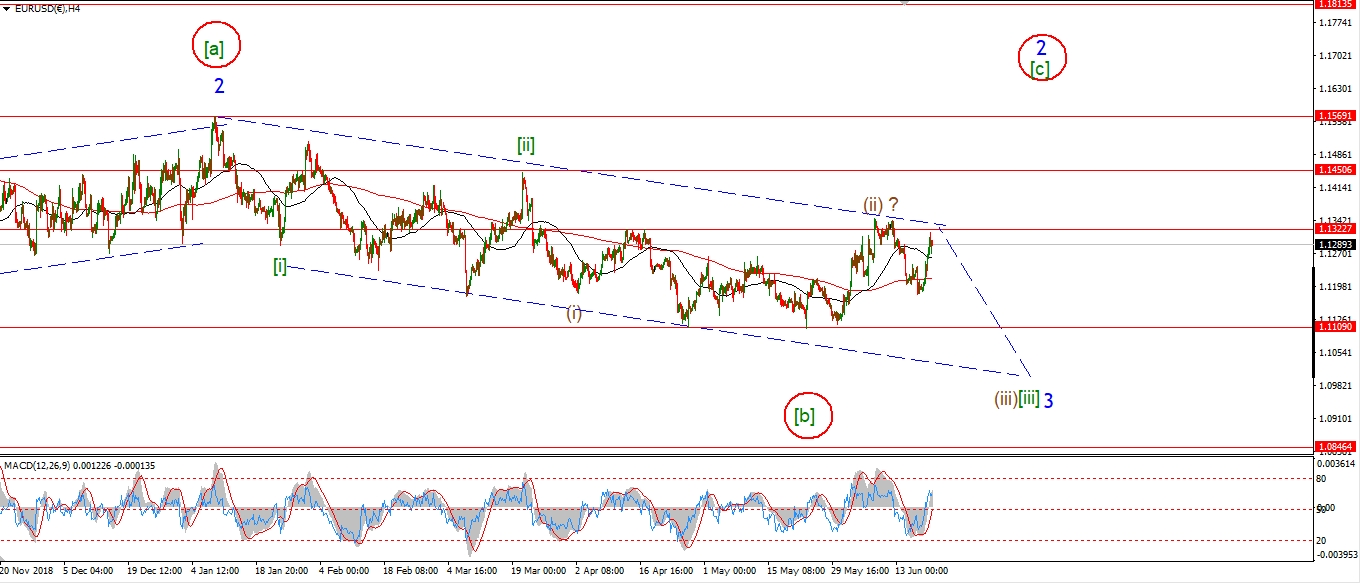 [/vc_column_text][vc_custom_heading text=”Daily” use_theme_fonts=”yes”][vc_column_text]
 [/vc_column_text][/vc_column][/vc_row]
[vc_row][vc_column][vc_column_text]
After falling in three waves on Friday,
EURUSD rose out of the wave ‘b’ low today,
and so far the price has held above that wave ‘b’ low this evening.
It is now likely that wave (ii) is underway off 1.1236,
and this wave should carry higher towards the upper trend line at about 1.1328.
All going to plan,
Wave (ii) should complete by tomorrow evening and hold below resistance at 1.1412.
And then we can work on identifying wave (iii) down.
Tomorrow;
Watch for wave ‘c’ to continue to the target at 1.1330.
[/vc_column_text][/vc_column][/vc_row]
[vc_row][vc_column][vc_separator border_width=”5″][/vc_column][/vc_row][vc_row][vc_column][vc_column_text]
GBPUSD
[/vc_column_text][/vc_column][/vc_row][vc_row][vc_column][vc_separator border_width=”5″][/vc_column][/vc_row][vc_row][vc_column width=”2/3″][vc_custom_heading text=”1 hr” use_theme_fonts=”yes”][vc_column_text]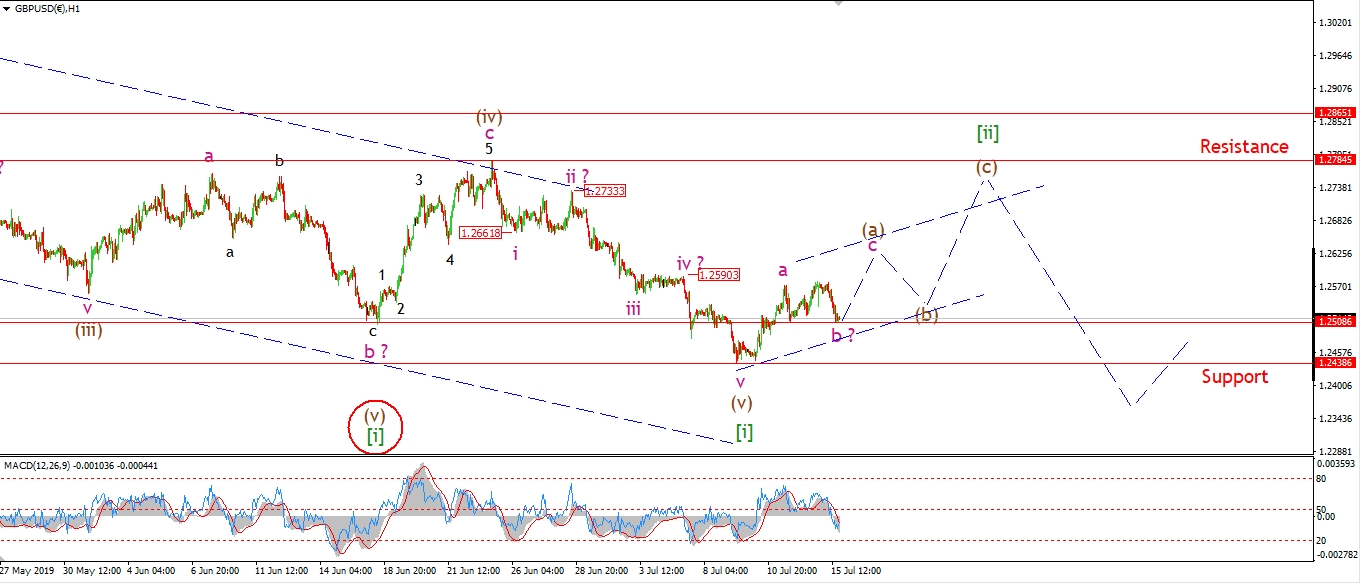 [/vc_column_text][/vc_column][vc_column width=”1/3″][vc_custom_heading text=”4 Hours” use_theme_fonts=”yes”][vc_column_text]
 [/vc_column_text][vc_custom_heading text=”Daily” use_theme_fonts=”yes”][vc_column_text]
 [/vc_column_text][/vc_column][/vc_row]
[vc_row][vc_column][vc_column_text]
Cable has now traced out a three wave flat correction in wave ‘b’ at this evenings lows.
The price has met the recent low at 1.2508 again,
and this is the minimum target for wave ‘b’ pink to complete.
So,
we should now expect a turn higher in wave ‘c’ pink to close out the larger wave (a).
Wave ‘c’ should get started overnight.
Support at 1.2438 must hold from here as this larger correction plays out over the next week or so.
And once wave [ii] completes,
I will be looking for another large decline in GBPUSD to begin in wave [iii].
Tomorrow;
Watch for wave ‘b’ to complete soon and wave ‘c’ to rise above 1.26 tomorrow.
[/vc_column_text][/vc_column][/vc_row]
[vc_row][vc_column][vc_separator border_width=”5″][/vc_column][/vc_row][vc_row][vc_column][vc_column_text]
USDJPY
[/vc_column_text][/vc_column][/vc_row][vc_row][vc_column][vc_separator border_width=”5″][/vc_column][/vc_row][vc_row][vc_column width=”2/3″][vc_custom_heading text=”1 hr” use_theme_fonts=”yes”][vc_column_text]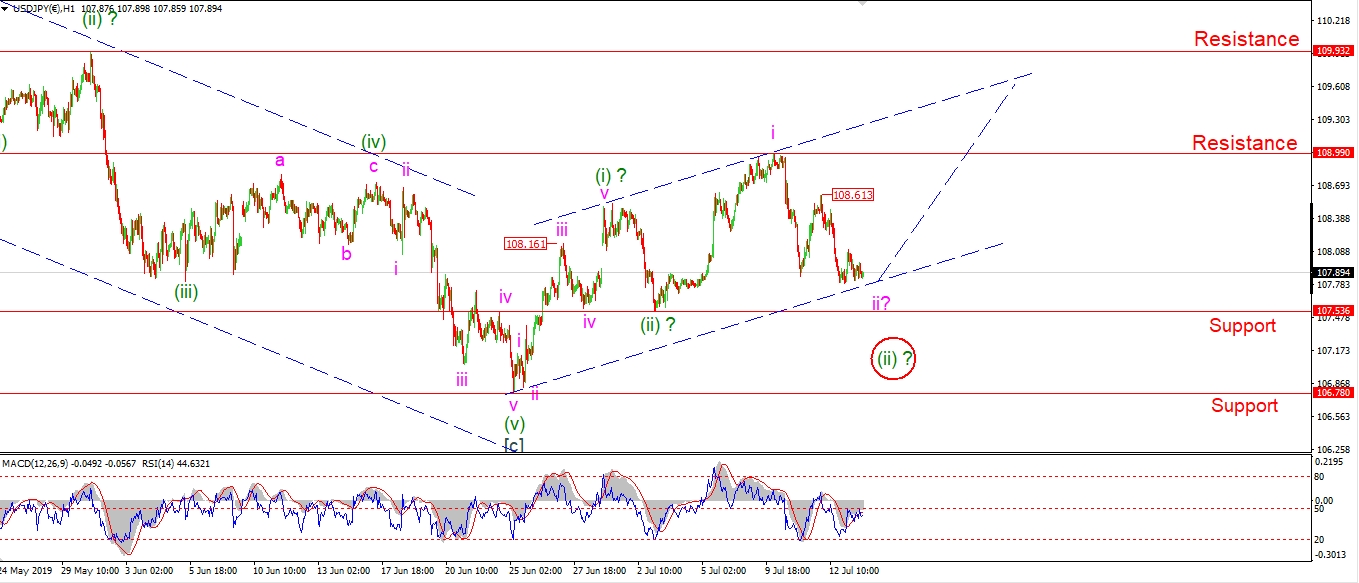 [/vc_column_text][/vc_column][vc_column width=”1/3″][vc_custom_heading text=”4 Hours” use_theme_fonts=”yes”][vc_column_text]
 [/vc_column_text][vc_custom_heading text=”Daily” use_theme_fonts=”yes”][vc_column_text]
 [/vc_column_text][/vc_column][/vc_row]
[vc_row][vc_column][vc_column_text]
No matter which short term count is actually in force at the moment.
I do think we are likely to see a turn higher in USDJPY begin this week.
The alternate count shown circled in red,
allows for one more break of 107.53 to complete wave (ii),
while the current operating wave count calls for wave ‘ii’ pink to complete above 107.53.
Both interpretations call for wave (iii) to rally soon.
This wave count will be confirmed with a break of 108.99 at the wave ‘i’ high.
Tomorrow;
Watch for wave ‘ii’ to complete above 107.53 and wave ‘iii’ to begin.
If we see a push above 108.60 that will signal that the turn is beginning.
106.78 must hold from here.
[/vc_column_text][/vc_column][/vc_row]
[vc_row][vc_column][vc_separator border_width=”5″][/vc_column][/vc_row][vc_row][vc_column][vc_column_text]
DOW JONES INDUSTRIALS
[/vc_column_text][/vc_column][/vc_row][vc_row][vc_column][vc_separator border_width=”5″][/vc_column][/vc_row][vc_row][vc_column width=”2/3″][vc_custom_heading text=”1 hr” use_theme_fonts=”yes”][vc_column_text]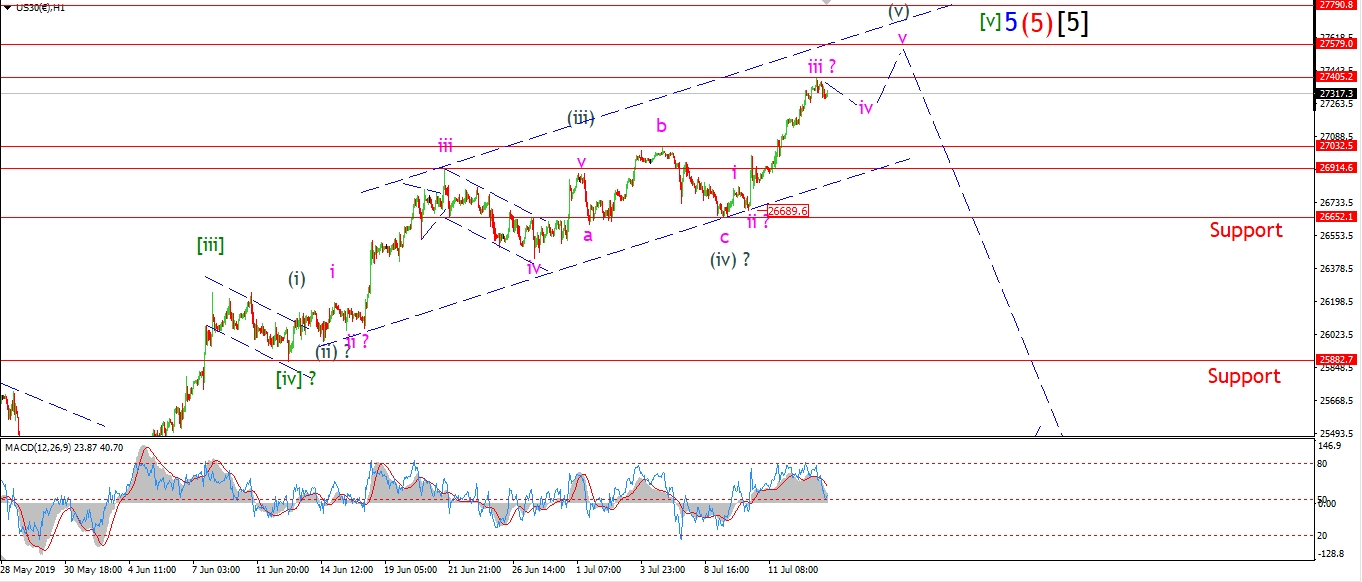 [/vc_column_text][/vc_column][vc_column width=”1/3″][vc_custom_heading text=”4 Hours” use_theme_fonts=”yes”][vc_column_text]
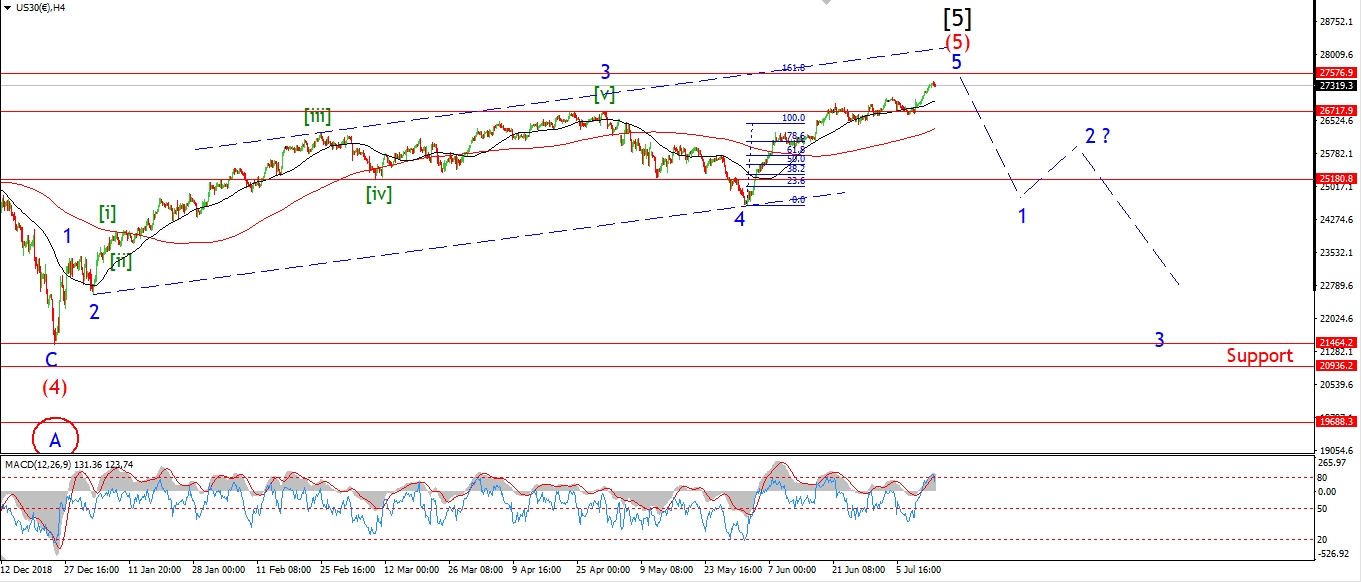 [/vc_column_text][vc_custom_heading text=”Daily” use_theme_fonts=”yes”][vc_column_text]
 [/vc_column_text][/vc_column][/vc_row]
[vc_row][vc_column][vc_column_text]
Ok now we are moving into a very dangerous territory for the DOW.
If you look at the 4hr chart,
you will see a new target high I have shown in the area of 27580.
this is where wave ‘5’ blue reaches 161.8% of wave ‘1’ blue.
This relationship with wave ‘1’ is the most common when a fifth wave extends.
Todays high reached 27400,
so we are only a whisper away from that target as I write.
If wave (v) grey is correct as I have it labelled it,
then todays high was the top of wave ‘iii’ of (v).
Wave ‘iv’ and ‘v’ should be enough to carry us to that target.
Tomorrow;
I have written these words before, I know.
But it is now time to prepare for a big downturn in stocks to begin very soon.
I believe that we are on the brink of a market collapse.
But even if this is only a fourth wave correction,
we should easily take out the December lows in this next decline anyway.
Every time we have reached a point like the present over the last 18 months,
it has resulted in a huge setback in stocks.
So, prepare now!
In the short term,
the wave count is pointing to one more slight new high by the end of this week in wave ‘v’ pink.
Watch for 27000 to hold for now and wave (v) to complete at 27580.
[/vc_column_text][/vc_column][/vc_row]
[vc_row][vc_column][vc_separator border_width=”5″][/vc_column][/vc_row][vc_row][vc_column][vc_column_text]
GOLD
[/vc_column_text][/vc_column][/vc_row][vc_row][vc_column][vc_separator border_width=”5″][/vc_column][/vc_row][vc_row][vc_column width=”2/3″][vc_custom_heading text=”1 hr” use_theme_fonts=”yes”][vc_column_text]
 [/vc_column_text][/vc_column][vc_column width=”1/3″][vc_custom_heading text=”4 Hours” use_theme_fonts=”yes”][vc_column_text]
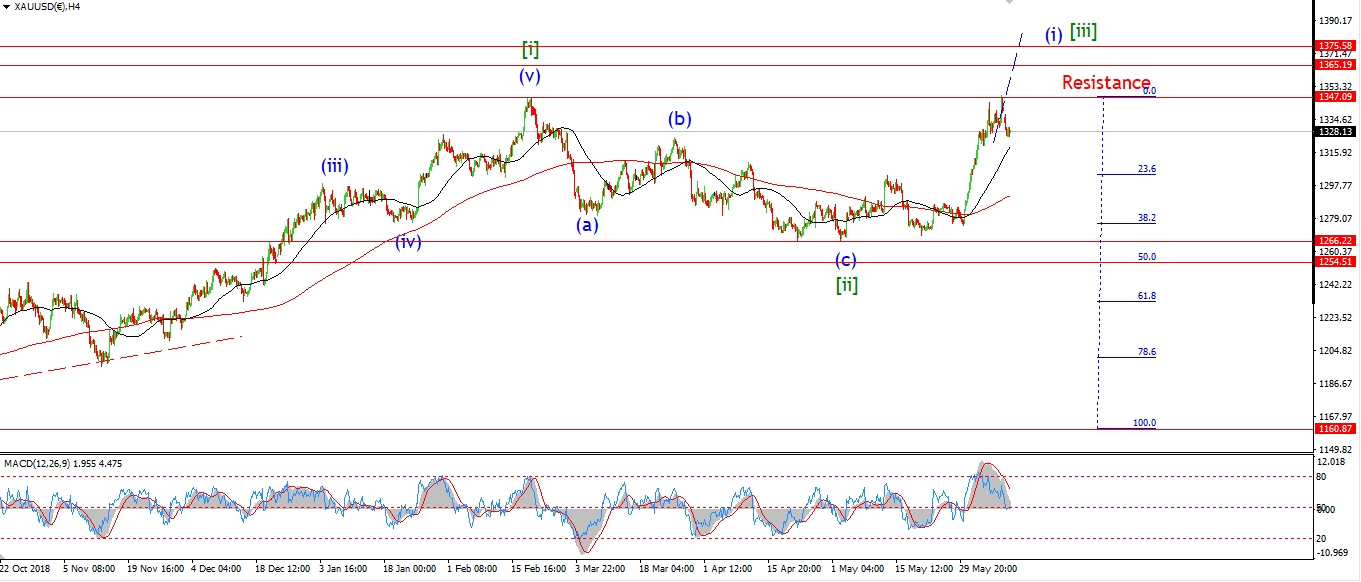 [/vc_column_text][vc_custom_heading text=”Daily” use_theme_fonts=”yes”][vc_column_text]
 [/vc_column_text][/vc_column][/vc_row]
[vc_row][vc_column][vc_column_text]
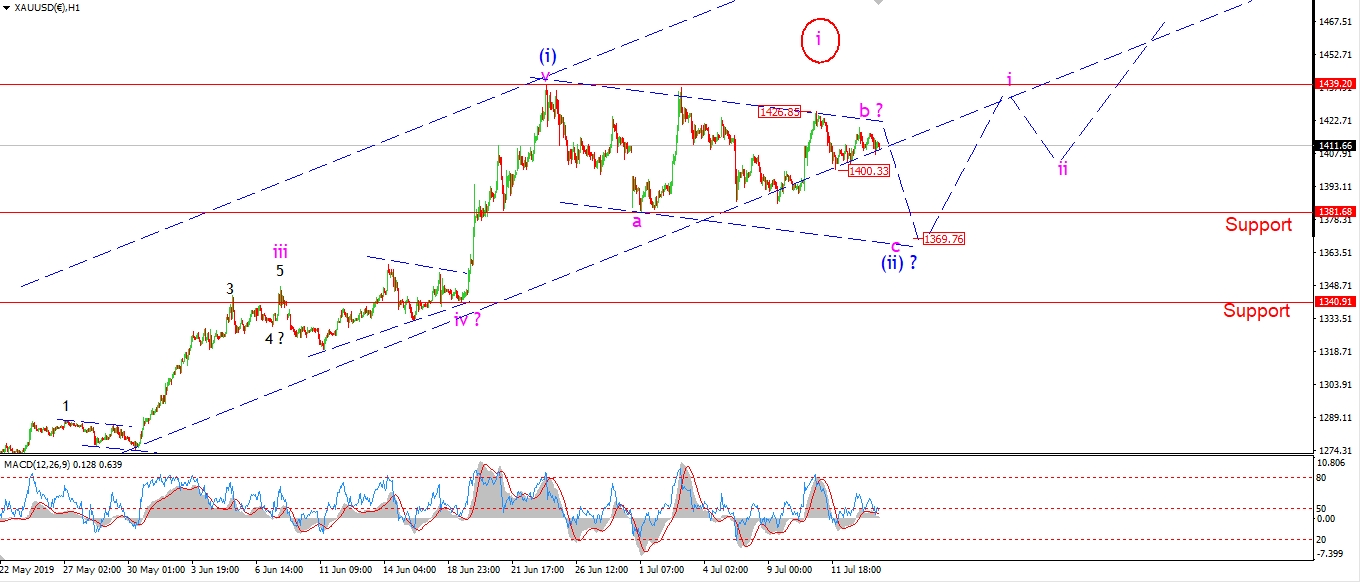
GOLD is all but flat today after a dead trade!
The triangle idea for wave ‘b’ still holds,
and given that the price range has contracted even more today,
then a triangle for wave ‘b’ is the most likely interpretation.
We should expect wave ‘c’ down to begin tomorrow with a break of 1400.
the target for wave ‘c’ remains at 1370 to complete wave (ii).
And then wave (iii) up will get underway off that level.
Tomorrow;
Watch for 1426 to hold and wave ‘c’ down to begin with a break of 1400.
[/vc_column_text][/vc_column][/vc_row]
[vc_row][vc_column][vc_separator border_width=”5″][/vc_column][/vc_row][vc_row][vc_column][vc_column_text]
U.S CRUDE OIL
[/vc_column_text][/vc_column][/vc_row][vc_row][vc_column][vc_separator border_width=”5″][/vc_column][/vc_row][vc_row][vc_column width=”2/3″][vc_custom_heading text=”1 hr” use_theme_fonts=”yes”][vc_column_text]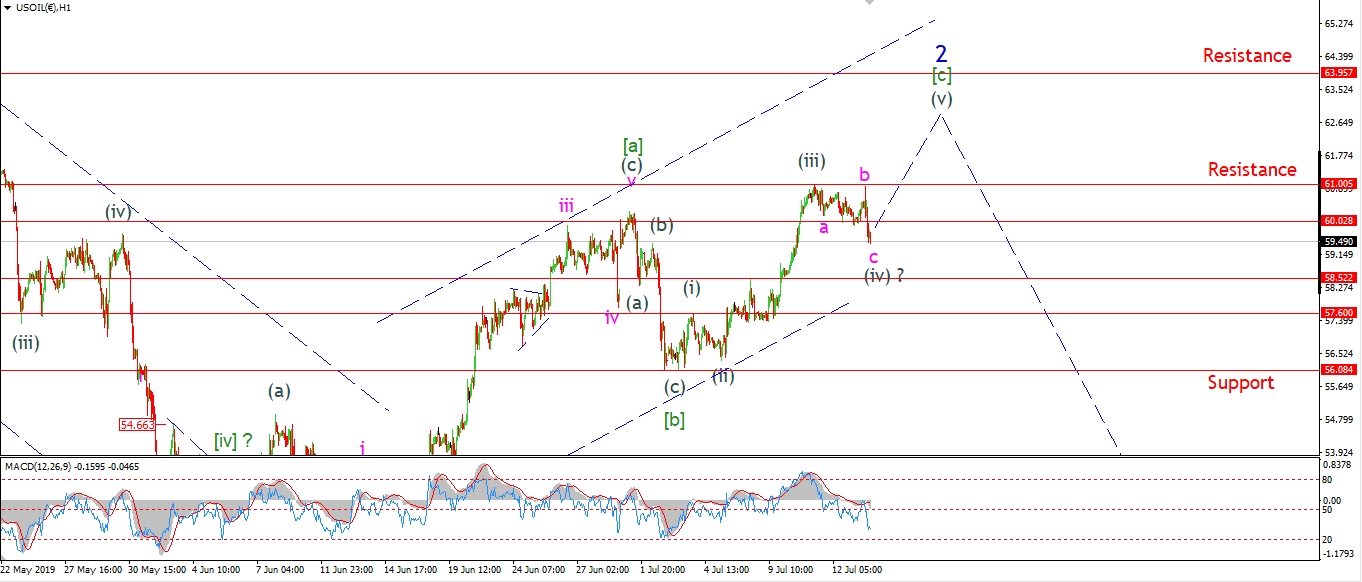 [/vc_column_text][/vc_column][vc_column width=”1/3″][vc_custom_heading text=”4 Hours” use_theme_fonts=”yes”][vc_column_text]
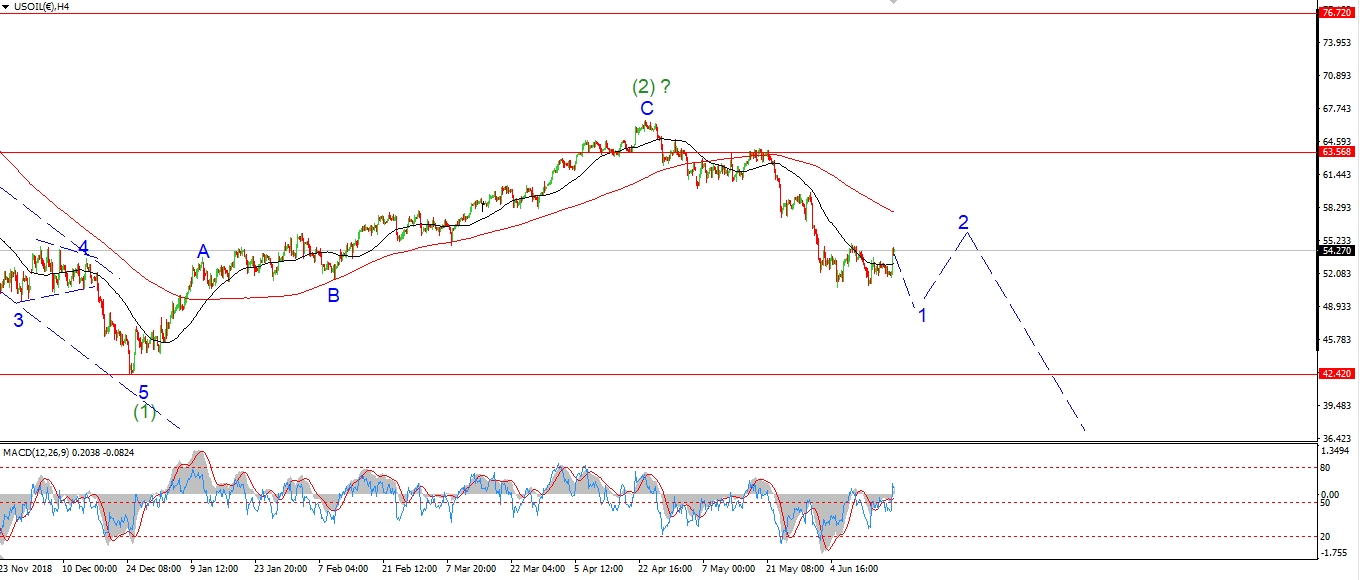 [/vc_column_text][vc_custom_heading text=”Daily” use_theme_fonts=”yes”][vc_column_text]
 [/vc_column_text][/vc_column][/vc_row]
[vc_row][vc_column][vc_column_text]
We are also at a critical point in Crude oil these days
as the market prepares to plunge again into a large degree third wave.
Wave (iv) continued today with another leg down forming this afternoon.
The price created a double top this morning in wave ‘b’ pink.
This evenings decline is viewed as wave ‘c’ of (iv).
Wave ‘c’ should find support above 58.52 and then turn higher into wave (v).
Wave (iv) must hold above 57.60 at wave (i).
If that level breaks,
that will signal that crude is turning down again to begin wave ‘3’ blue.
Tomorrow;
Watch for wave (iv) to find a final low.
Wave (v) will be confirmed with a break above 61.00 again.
[/vc_column_text][/vc_column][/vc_row]
[vc_row][vc_column][vc_separator border_width=”5″][/vc_column][/vc_row][vc_row][vc_column][vc_column_text]
US 10 yr Treasuries.
[/vc_column_text][/vc_column][/vc_row][vc_row][vc_column][vc_separator border_width=”5″][/vc_column][/vc_row][vc_row][vc_column width=”2/3″][vc_custom_heading text=”1 hr” use_theme_fonts=”yes”][vc_column_text]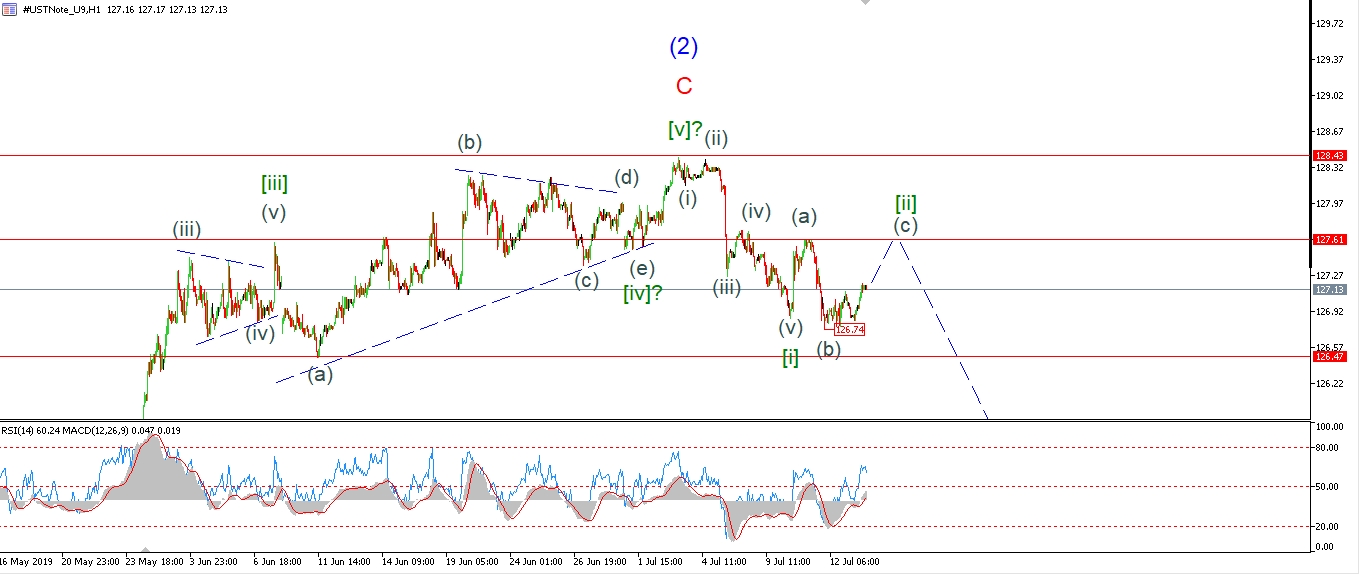 [/vc_column_text][/vc_column][vc_column width=”1/3″][vc_custom_heading text=”4 Hours” use_theme_fonts=”yes”][vc_column_text]
 [/vc_column_text][vc_custom_heading text=”Daily” use_theme_fonts=”yes”][vc_column_text]
 [/vc_column_text][/vc_column][/vc_row]
[vc_row][vc_column][vc_column_text]
Bonds turned higher off Fridays low today.
The rise so far is in three waves at a minor degree.
But I think this rise will extend higher this week
and create a five wave rally to complete wave (c) and wave [ii].
Tomorrow;
the recent low at wave (b) came in at 126.74,
wave (c) should continue higher off that level
and break 127.61 at a minimum, to complete an expanded flat wave [ii].
Wave [iii] down is just around the corner.
[/vc_column_text][/vc_column][/vc_row]
[vc_row][vc_column][vc_separator border_width=”5″][/vc_column][/vc_row][vc_row][vc_column][vc_column_text]
SILVER
[/vc_column_text][/vc_column][/vc_row][vc_row][vc_column][vc_separator border_width=”5″][/vc_column][/vc_row][vc_row][vc_column width=”2/3″][vc_custom_heading text=”1 hr” use_theme_fonts=”yes”][vc_column_text]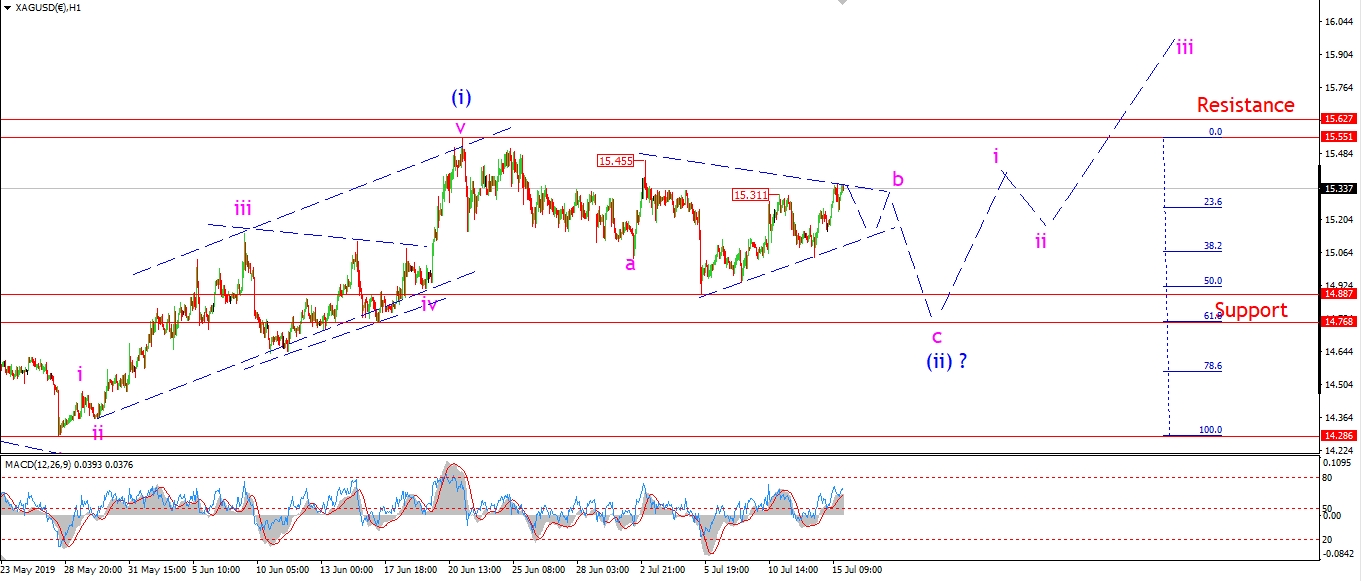 [/vc_column_text][/vc_column][vc_column width=”1/3″][vc_custom_heading text=”4 Hours” use_theme_fonts=”yes”][vc_column_text]
 [/vc_column_text][vc_custom_heading text=”Daily” use_theme_fonts=”yes”][vc_column_text]
 [/vc_column_text][/vc_column][/vc_row]
[vc_row][vc_column][vc_column_text]
Silver has pushed a little higher today to break the previous interim high at 15.31.
but I think that wave ‘b’ is still tracing out a triangle,
and we should see one more low in wave ‘c’ this week,
before the correction completes in wave (ii) blue as shown.
Tomorrow;
Watch for wave ‘b’ to hold below 15.45 and the price range to continue to contract.
Wave ‘c’ should hit 14.88 at a minimum.
[/vc_column_text][/vc_column][/vc_row]
[vc_row][vc_column][vc_separator border_width=”5″][/vc_column][/vc_row][vc_row][vc_column][vc_column_text]
S&P 500.
[/vc_column_text][/vc_column][/vc_row][vc_row][vc_column][vc_separator border_width=”5″][/vc_column][/vc_row][vc_row][vc_column width=”2/3″][vc_custom_heading text=”1 hr” use_theme_fonts=”yes”][vc_column_text]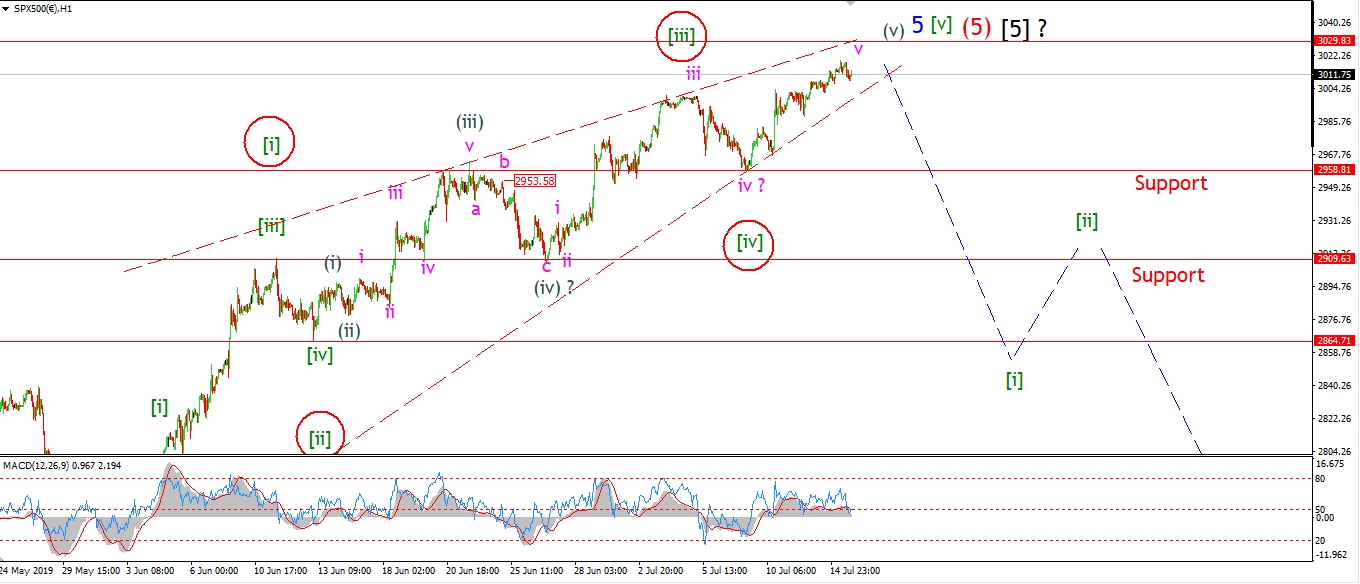 [/vc_column_text][/vc_column][vc_column width=”1/3″][vc_custom_heading text=”4 Hours” use_theme_fonts=”yes”][vc_column_text]
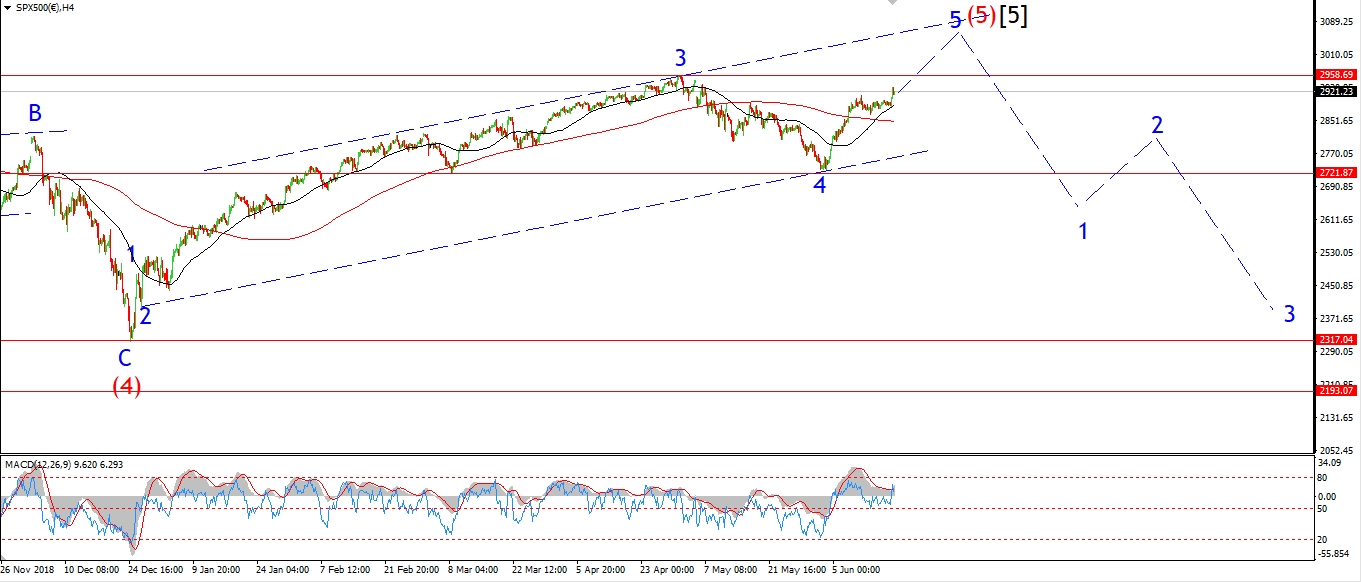 [/vc_column_text][vc_custom_heading text=”Daily” use_theme_fonts=”yes”][vc_column_text]
 [/vc_column_text][/vc_column][/vc_row]
[vc_row][vc_column][vc_column_text]
The S&P is limping higher towards the finish line in wave ‘5’ now!
the current wave count calls for wave ‘v’ of (v) of [v] of ‘5’ to complete this week.
A push up to 3030 would do it,
but that is not absolutely necessary either as the structure has met all the criteria of a complete wave at this point.
So an impulsive decline off these levels will signal that the turn is beginning.
The final leg up in wave ‘5’ blue can also be viewed as an ending diagonal wave.
This is outlined by the red trendlines on the hourly chart.
If that interpretation is correct,
then the final high in wave [v] should top out at about 3030 also.
Tomorrow;
Watch for wave ‘v’ to complete with a push up to 3030.
If the price touches the upper trend line and then drops impulsively off that level.
that will be our first signal that the top is in.
[/vc_column_text][/vc_column][/vc_row]
[vc_row][vc_column][vc_separator border_width=”5″][/vc_column][/vc_row]