
[vc_row][vc_column][vc_separator border_width=”5″][/vc_column][/vc_row]
[vc_row][vc_column][vc_column_text]
Hi everyone.
I have been on the road all day today, so I am way behind on email as a result!
If you have emailed me,
I will get back to you tomorrow without a doubt!
Ok here we go.
[/vc_column_text][/vc_column][/vc_row]
[vc_row][vc_column][vc_separator border_width=”5″][/vc_column][/vc_row]
[vc_row][vc_column][vc_column_text]
EURUSD
[/vc_column_text][/vc_column][/vc_row]
[vc_row][vc_column][vc_separator border_width=”5″][/vc_column][/vc_row][vc_row][vc_column width=”2/3″][vc_custom_heading text=”1 hr” use_theme_fonts=”yes”][vc_column_text]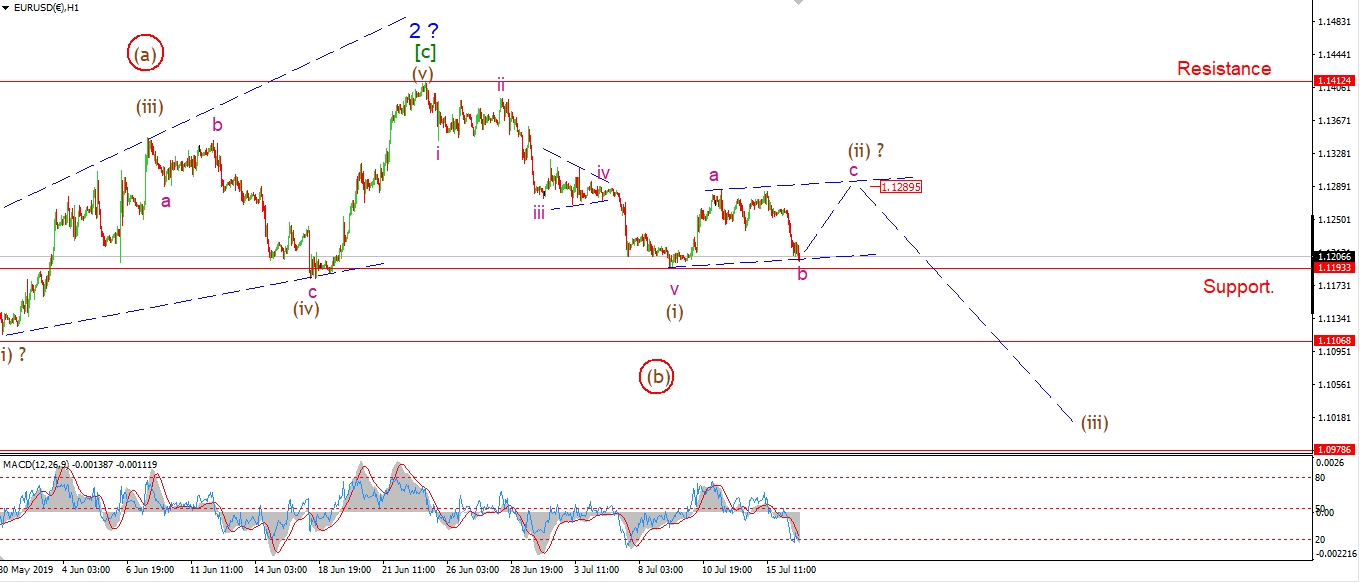 [/vc_column_text][/vc_column][vc_column width=”1/3″][vc_custom_heading text=”4 Hours” use_theme_fonts=”yes”][vc_column_text]
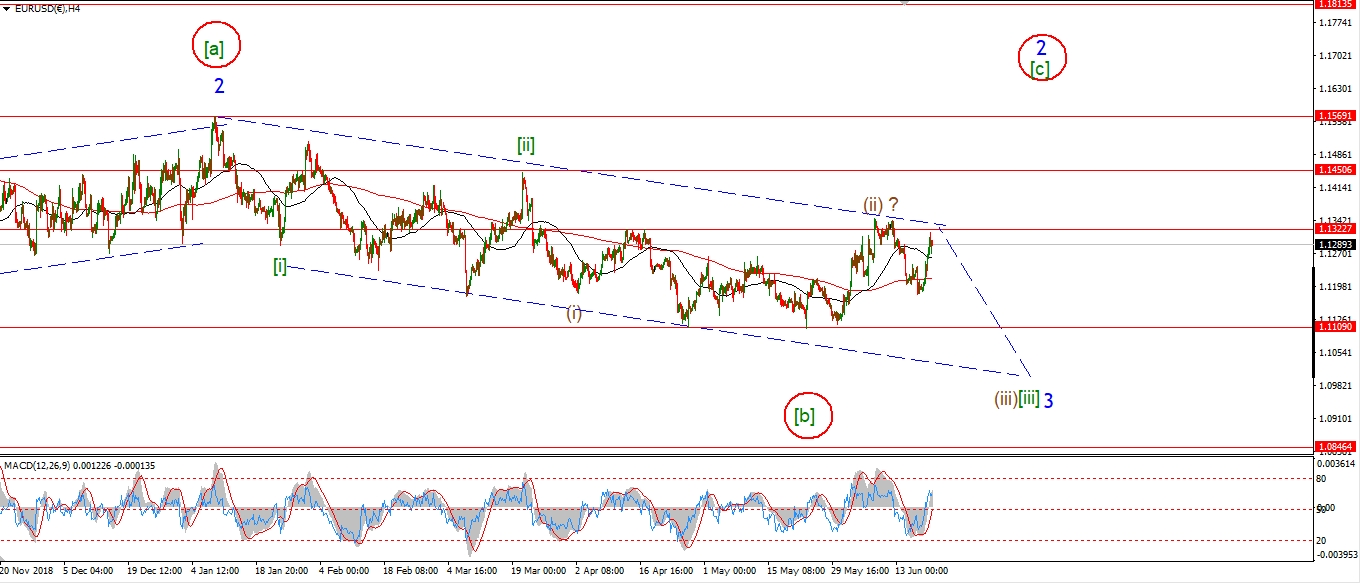 [/vc_column_text][vc_custom_heading text=”Daily” use_theme_fonts=”yes”][vc_column_text]
 [/vc_column_text][/vc_column][/vc_row]
[vc_row][vc_column][vc_column_text]
EURUSD fell further today to break out of the previous three wave pattern.
I still think this decline is part of wave ‘b’ within in wave (ii).
That count suggests a further rise back up to 1.1290 now
to fill the trend channel again in wave ‘c’.
And this will create a larger three wave pattern in wave (ii).
If we see a continued decline that breaks 1.1106,
that will signal that wave (iii) was underway.
For now,
we need to see a three wave counter trend correction complete before looking for wave (iii) to begin.
Tomorrow;
Watch for wave ‘c’ of (ii) rise into 1.1290 to complete the correction.
[/vc_column_text][/vc_column][/vc_row]
[vc_row][vc_column][vc_separator border_width=”5″][/vc_column][/vc_row][vc_row][vc_column][vc_column_text]
GBPUSD
[/vc_column_text][/vc_column][/vc_row][vc_row][vc_column][vc_separator border_width=”5″][/vc_column][/vc_row][vc_row][vc_column width=”2/3″][vc_custom_heading text=”1 hr” use_theme_fonts=”yes”][vc_column_text] [/vc_column_text][/vc_column][vc_column width=”1/3″][vc_custom_heading text=”4 Hours” use_theme_fonts=”yes”][vc_column_text]
 [/vc_column_text][vc_custom_heading text=”Daily” use_theme_fonts=”yes”][vc_column_text]
 [/vc_column_text][/vc_column][/vc_row]
[vc_row][vc_column][vc_column_text]
Cable dropped also today which has ruled out the previous interpretation for wave [ii].
Even though todays decline is quite sharp,
I still think we need to see a larger corrective wave unfold in wave [ii]
before wave [iii] down begins.
The decline off wave (a) is in three waves so far,
this should be followed by a rise in five waves to complete wave (c) of [ii] over the coming days.
Tomorrow;
Watch for wave ‘c’ to begin and rally above 1.2580 to complete an expanded flat correction wave [ii].
Once wave [ii] is done,
then I will look for wave [iii] down to begin.
[/vc_column_text][/vc_column][/vc_row]
[vc_row][vc_column][vc_separator border_width=”5″][/vc_column][/vc_row][vc_row][vc_column][vc_column_text]
USDJPY
[/vc_column_text][/vc_column][/vc_row][vc_row][vc_column][vc_separator border_width=”5″][/vc_column][/vc_row][vc_row][vc_column width=”2/3″][vc_custom_heading text=”1 hr” use_theme_fonts=”yes”][vc_column_text]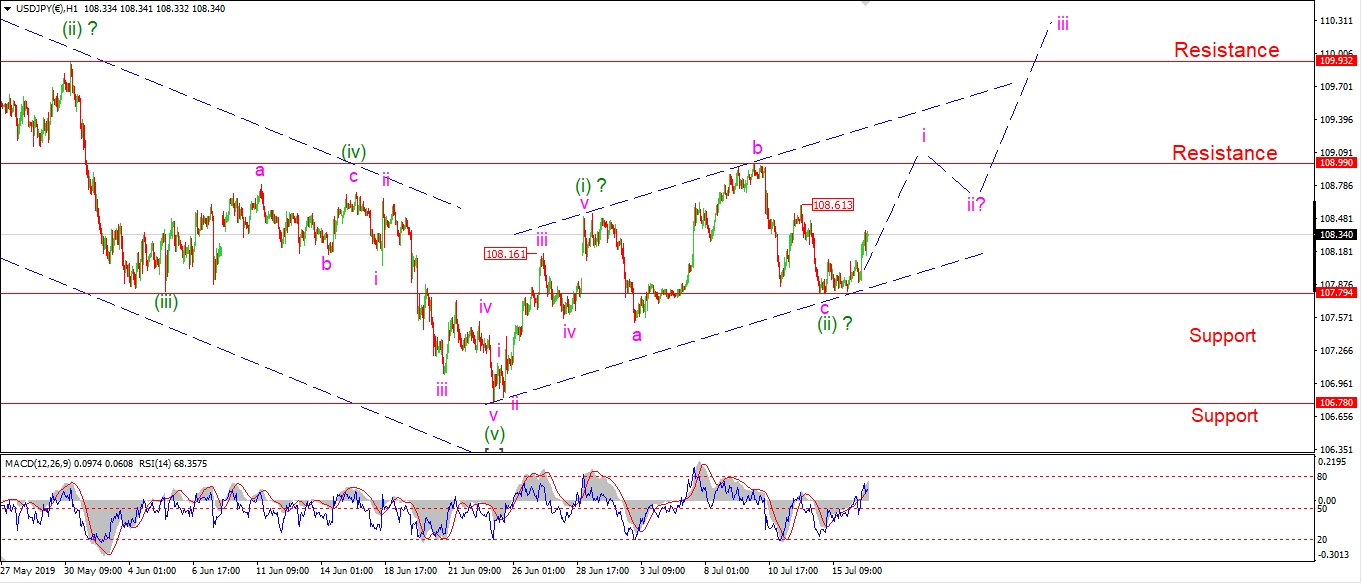 [/vc_column_text][/vc_column][vc_column width=”1/3″][vc_custom_heading text=”4 Hours” use_theme_fonts=”yes”][vc_column_text]
 [/vc_column_text][vc_custom_heading text=”Daily” use_theme_fonts=”yes”][vc_column_text]
 [/vc_column_text][/vc_column][/vc_row]
[vc_row][vc_column][vc_column_text]
USDJPY is rising today off the recent lows,
It is a bit early to say for sure,
but this may be the beginning of wave (iii) up.
I have changed to the alternate count this evening as it seems to fit the action a little better.
The rise today is viewed as wave ‘i’ of (iii).
From here,
we should look for an impulsive rise above 109.00
and then a correction to a higher low in wave ‘ii’ pink this week.
This action will create a bullish signal and set up for wave ‘iii’ of (iii).
Tomorrow;
Watch for wave ‘i’ to hold above 107.80 and rally towards resistance.
[/vc_column_text][/vc_column][/vc_row]
[vc_row][vc_column][vc_separator border_width=”5″][/vc_column][/vc_row][vc_row][vc_column][vc_column_text]
DOW JONES INDUSTRIALS
[/vc_column_text][/vc_column][/vc_row][vc_row][vc_column][vc_separator border_width=”5″][/vc_column][/vc_row][vc_row][vc_column width=”2/3″][vc_custom_heading text=”1 hr” use_theme_fonts=”yes”][vc_column_text]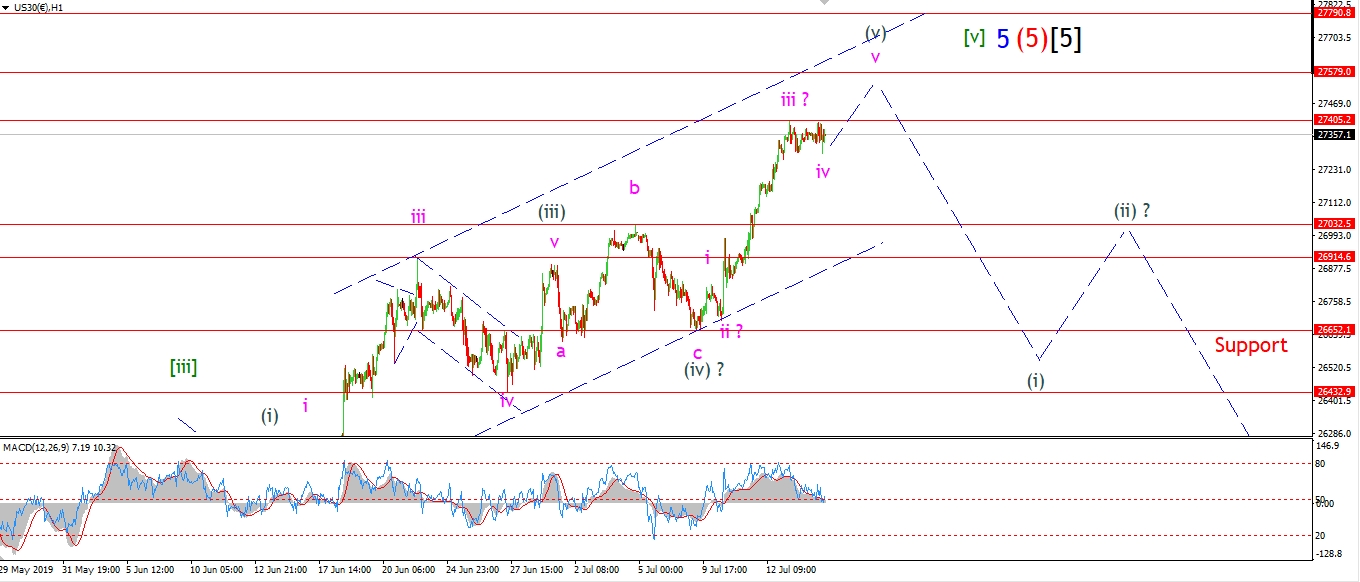 [/vc_column_text][/vc_column][vc_column width=”1/3″][vc_custom_heading text=”4 Hours” use_theme_fonts=”yes”][vc_column_text]
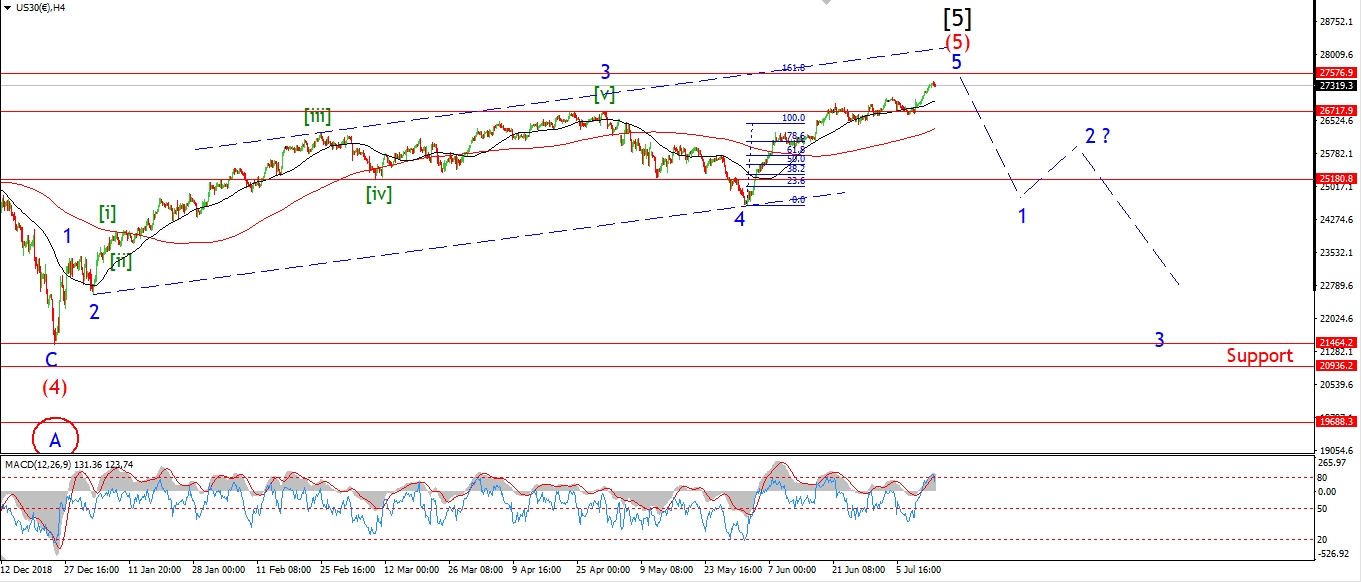 [/vc_column_text][vc_custom_heading text=”Daily” use_theme_fonts=”yes”][vc_column_text]
 [/vc_column_text][/vc_column][/vc_row]
[vc_row][vc_column][vc_column_text]
The DOW drifted sideways today in a possible fourth wave flat correction.
The fact that the market is hanging on at the highs this evening,
makes that upper target at 27580 even more likely now to complete wave (v).
Back to wave ‘iv’,
We may see a little more downside in wave ‘iv’ pink before rallying in wave ‘v’.
But wave ‘iv’ must hold above 27032 now.
I will just have to wait and see how it unfolds from here.
If we see a break above 27450,
that will signal wave ‘iv’ is done and wave ‘v’ is underway.
And then should finish wave (v) by the end of this week.
Tomorrow;
Watch for wave ‘iv’ to complete and an initial rise to begin wave ‘v’ of (v).
[/vc_column_text][/vc_column][/vc_row]
[vc_row][vc_column][vc_separator border_width=”5″][/vc_column][/vc_row][vc_row][vc_column][vc_column_text]
GOLD
[/vc_column_text][/vc_column][/vc_row][vc_row][vc_column][vc_separator border_width=”5″][/vc_column][/vc_row][vc_row][vc_column width=”2/3″][vc_custom_heading text=”1 hr” use_theme_fonts=”yes”][vc_column_text]
 [/vc_column_text][/vc_column][vc_column width=”1/3″][vc_custom_heading text=”4 Hours” use_theme_fonts=”yes”][vc_column_text]
 [/vc_column_text][vc_custom_heading text=”Daily” use_theme_fonts=”yes”][vc_column_text]
 [/vc_column_text][/vc_column][/vc_row]
[vc_row][vc_column][vc_column_text]
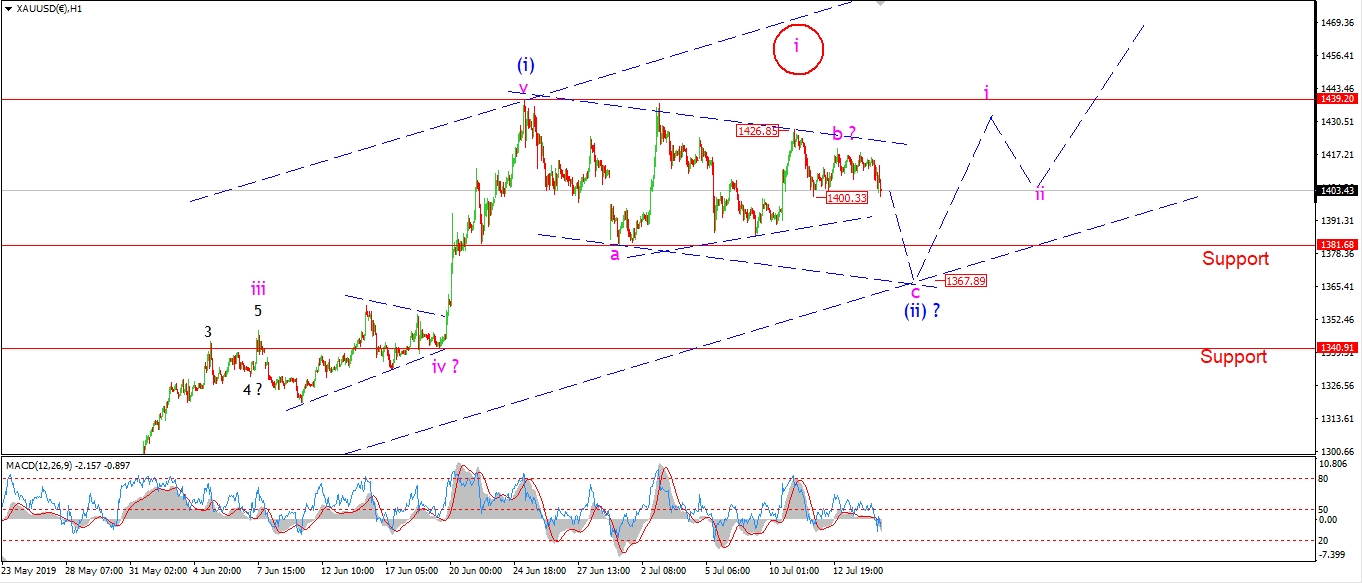
Gold is reluctantly dropping in wave ‘c’ this evening.
It is a very slow start to what should be a five wave structure,
but a break of 1400 should confirm wave ‘c’ has begun.
The minimum target for wave (ii) lies at 1381,
with the lower target at 1367 or so,
where the price will meet the trend channel again in wave ‘c’.
When this correction completes in that target range,
I will the be looking for wave (iii) up to begin.
Tomorrow;
watch for wave ‘c’ of (ii) to continue lower to the minimum target at 1381.
[/vc_column_text][/vc_column][/vc_row]
[vc_row][vc_column][vc_separator border_width=”5″][/vc_column][/vc_row][vc_row][vc_column][vc_column_text]
U.S CRUDE OIL
[/vc_column_text][/vc_column][/vc_row][vc_row][vc_column][vc_separator border_width=”5″][/vc_column][/vc_row][vc_row][vc_column width=”2/3″][vc_custom_heading text=”1 hr” use_theme_fonts=”yes”][vc_column_text]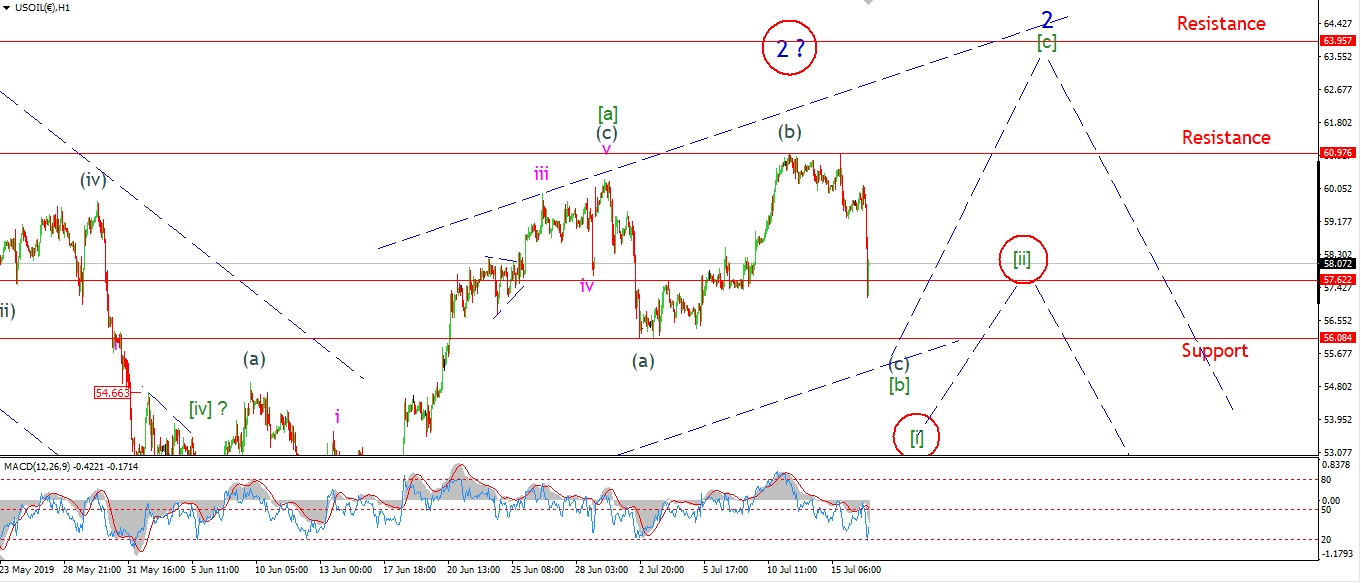 [/vc_column_text][/vc_column][vc_column width=”1/3″][vc_custom_heading text=”4 Hours” use_theme_fonts=”yes”][vc_column_text]
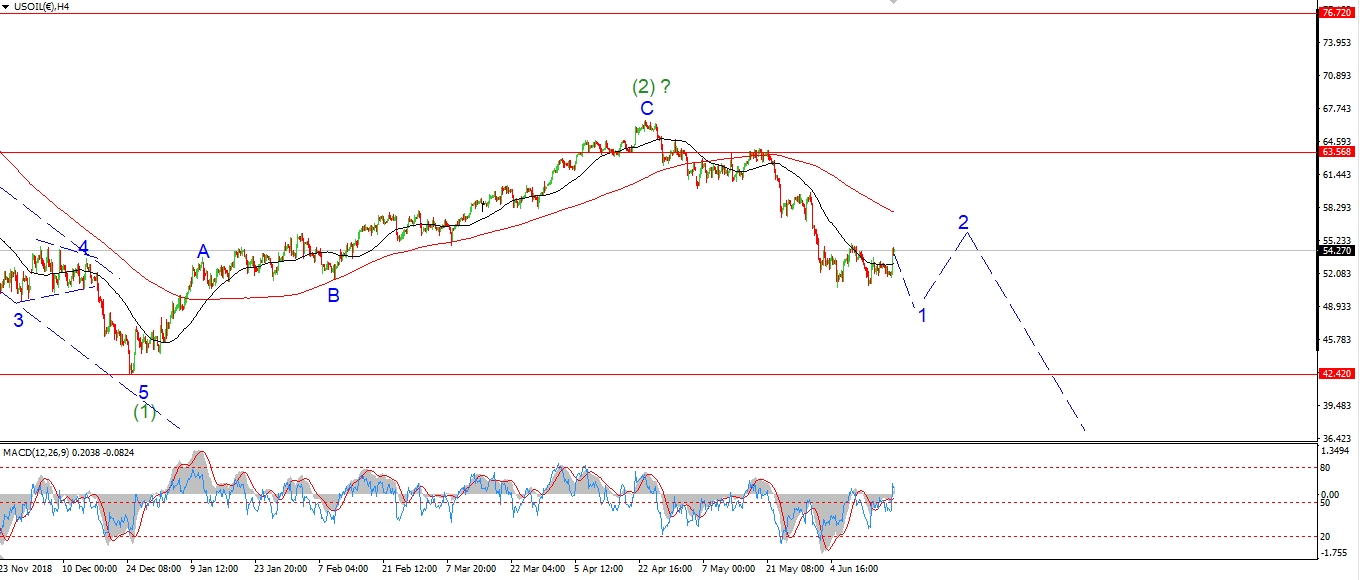 [/vc_column_text][vc_custom_heading text=”Daily” use_theme_fonts=”yes”][vc_column_text]
 [/vc_column_text][/vc_column][/vc_row]
[vc_row][vc_column][vc_column_text]
Is the the beginning of the end for crude oil?
The price dropped sharply and broke the invalidation line at 57.60 this evening.
It is definitely a possibility that wave ‘2’ has topped out at the recent high,
but it is not my favored count right now.
I have shown todays decline as wave (c) of the larger wave [b].
So the price should find support at about 56.00 and then turn up into wave [c].
So how will we know if the alternate count is correct then?
Well,
if the price continues lower in five waves,
and then corrects higher in three waves as shown.
That will create a bearish signal off the highs
and we can then prepare for the decline in wave ‘3’ to get underway.
I will be watching this alternate count closely.
Tomorrow;
Watch for wave (c) to find support at 56.00 and then rally back in five waves above 61.00 to complete wave [c] and wave ‘2’.
[/vc_column_text][/vc_column][/vc_row]
[vc_row][vc_column][vc_separator border_width=”5″][/vc_column][/vc_row][vc_row][vc_column][vc_column_text]
US 10 yr Treasuries.
[/vc_column_text][/vc_column][/vc_row][vc_row][vc_column][vc_separator border_width=”5″][/vc_column][/vc_row][vc_row][vc_column width=”2/3″][vc_custom_heading text=”1 hr” use_theme_fonts=”yes”][vc_column_text]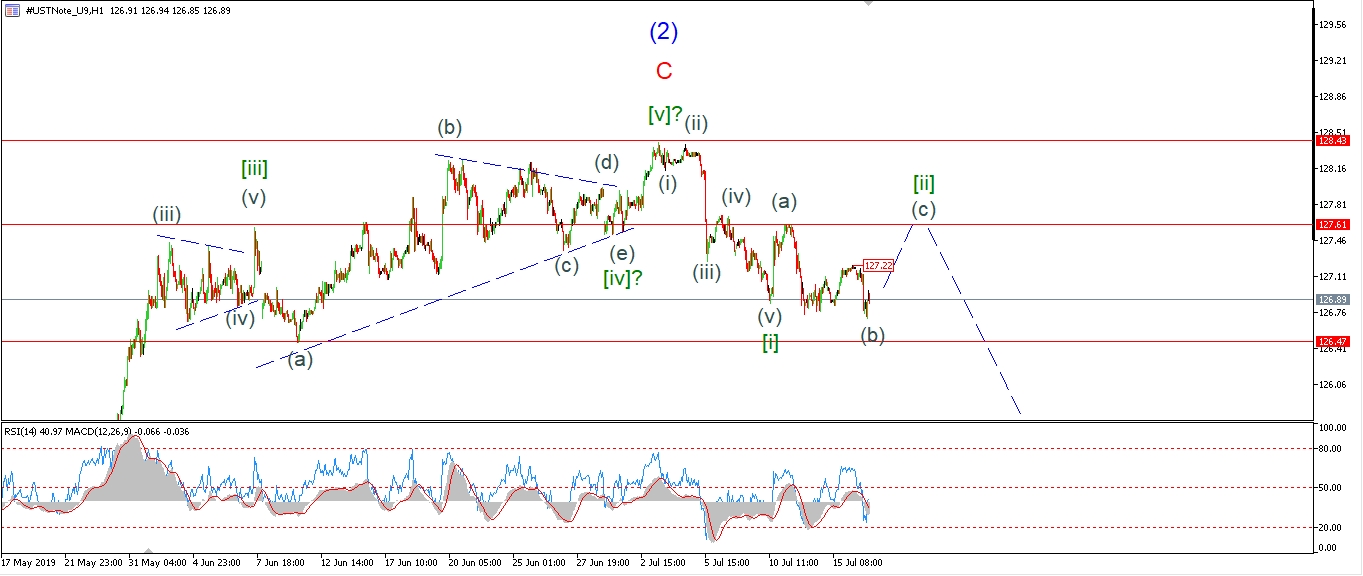 [/vc_column_text][/vc_column][vc_column width=”1/3″][vc_custom_heading text=”4 Hours” use_theme_fonts=”yes”][vc_column_text]
 [/vc_column_text][vc_custom_heading text=”Daily” use_theme_fonts=”yes”][vc_column_text]
 [/vc_column_text][/vc_column][/vc_row]
[vc_row][vc_column][vc_column_text]
Wave (b) broke to a slight new low today but the price has recovered this evening.
The drop off wave (a) is still a three wave form,
So I am counting this as wave (b) within the larger wave [ii].
Wave (c) of [ii] is still expected to rally back above 127.61.
Tomorrow;
A break of 127.22 will confirm wave (c) has begun.
But wave (c) should complete pretty soon.
[/vc_column_text][/vc_column][/vc_row]
[vc_row][vc_column][vc_separator border_width=”5″][/vc_column][/vc_row][vc_row][vc_column][vc_column_text]
SILVER
[/vc_column_text][/vc_column][/vc_row][vc_row][vc_column][vc_separator border_width=”5″][/vc_column][/vc_row][vc_row][vc_column width=”2/3″][vc_custom_heading text=”1 hr” use_theme_fonts=”yes”][vc_column_text]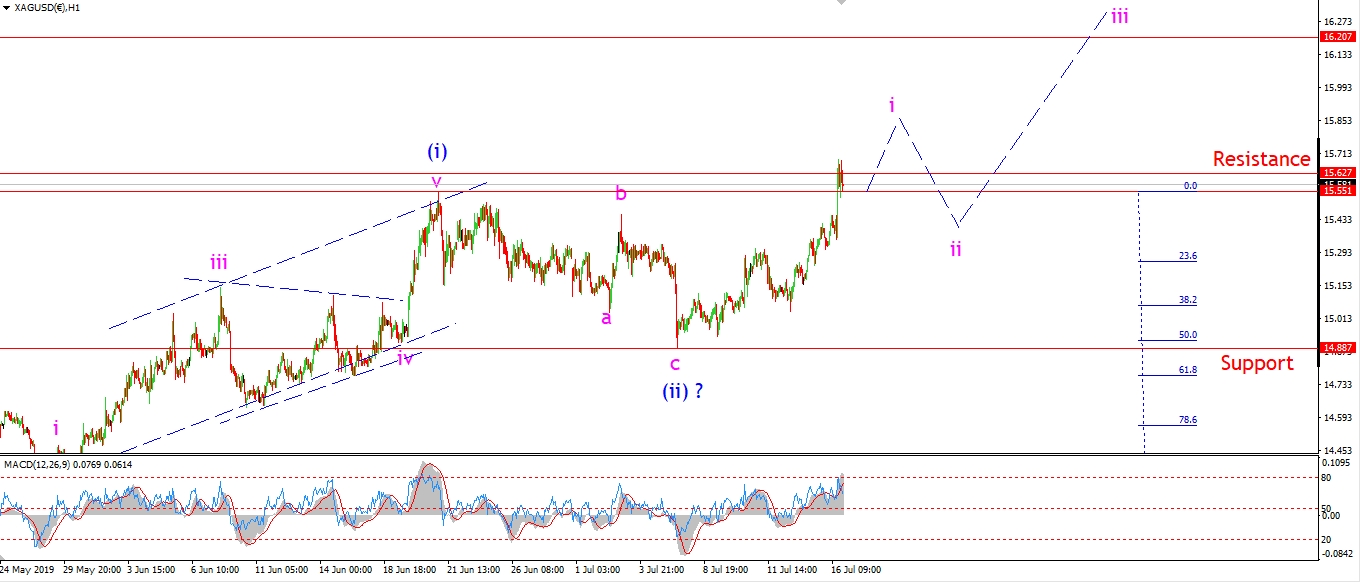 [/vc_column_text][/vc_column][vc_column width=”1/3″][vc_custom_heading text=”4 Hours” use_theme_fonts=”yes”][vc_column_text]
 [/vc_column_text][vc_custom_heading text=”Daily” use_theme_fonts=”yes”][vc_column_text]
 [/vc_column_text][/vc_column][/vc_row]
[vc_row][vc_column][vc_column_text]
Has wave (iii) finally begun?
The rise in Silver today does not count well as a five wave structure just yet.
But The fact that price pushed out above 15.60 again with ease today,
does suggest that wave ‘i’ of (iii) is now a possibility.
With that in mind,
I have switched back to the previous bullish count this evening.
This shows wave (ii) complete at 14.88,
and wave ‘i’ of (iii) now underway.
Tomorrow;
Watch for wave ‘i’ to continue higher and create a clear five wave rally off 14.88.
When wave ‘ii’ completes a higher low over the coming week,
that will create a bullish opportunity.
[/vc_column_text][/vc_column][/vc_row]
[vc_row][vc_column][vc_separator border_width=”5″][/vc_column][/vc_row][vc_row][vc_column][vc_column_text]
S&P 500.
[/vc_column_text][/vc_column][/vc_row][vc_row][vc_column][vc_separator border_width=”5″][/vc_column][/vc_row][vc_row][vc_column width=”2/3″][vc_custom_heading text=”1 hr” use_theme_fonts=”yes”][vc_column_text]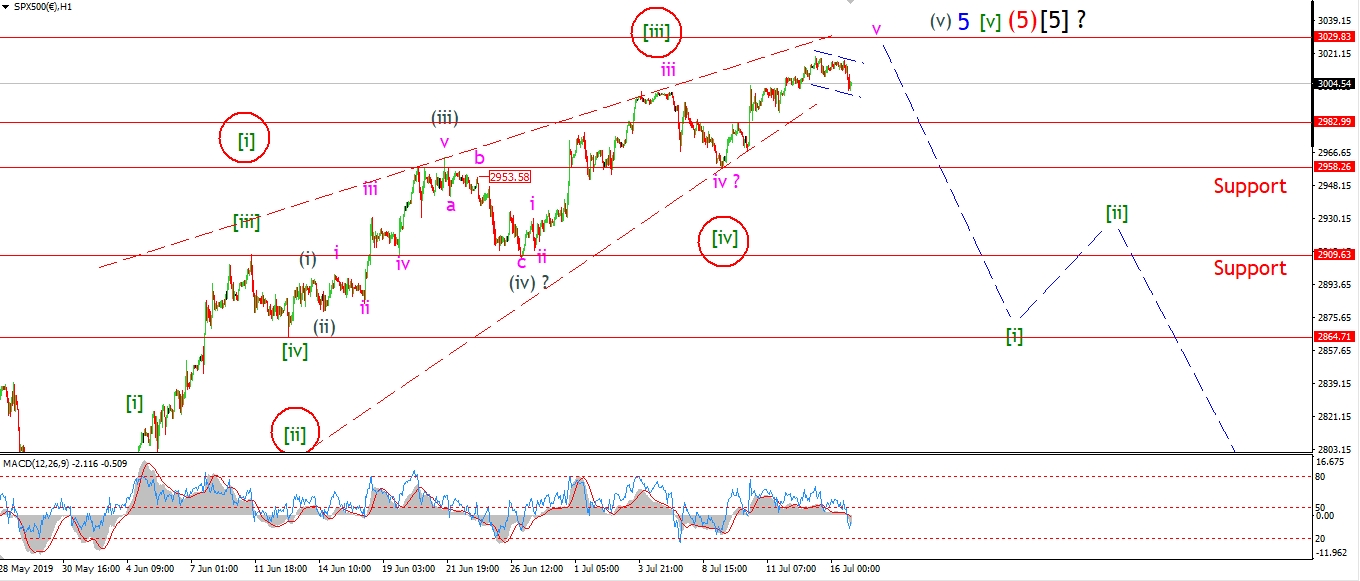 [/vc_column_text][/vc_column][vc_column width=”1/3″][vc_custom_heading text=”4 Hours” use_theme_fonts=”yes”][vc_column_text]
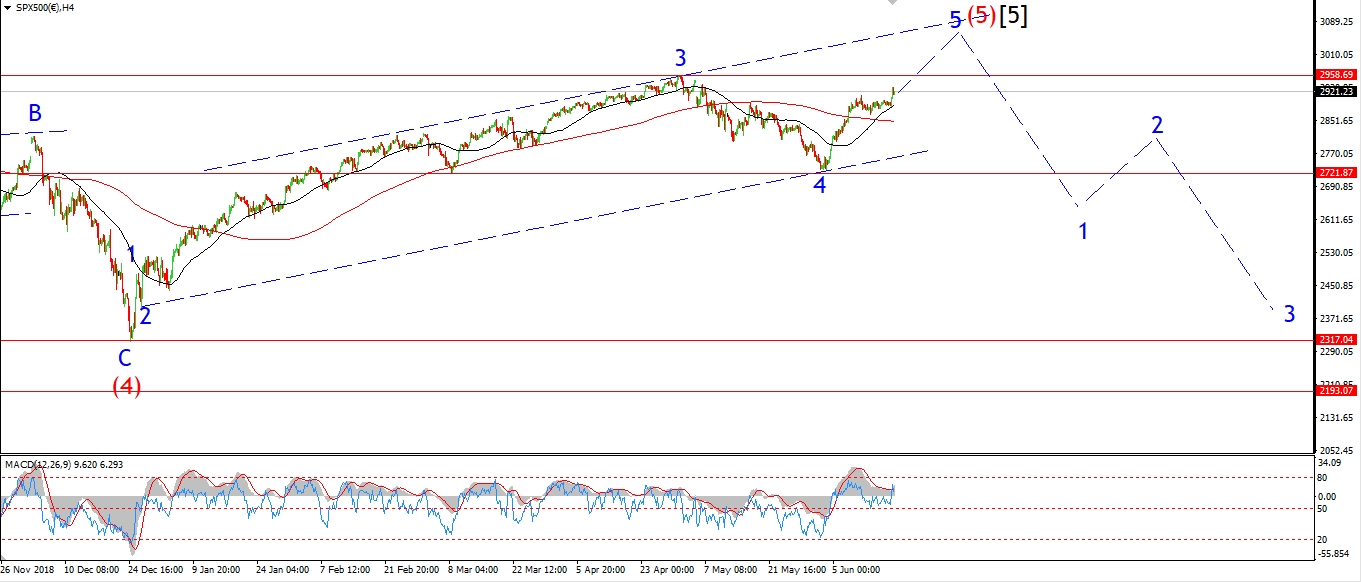 [/vc_column_text][vc_custom_heading text=”Daily” use_theme_fonts=”yes”][vc_column_text]
 [/vc_column_text][/vc_column][/vc_row]
[vc_row][vc_column][vc_column_text]
The S&P has dropped in three waves off the latest all time high.
This action suggests a correction within wave ‘v’ is now playing out.
And we should see another rally into about 303 to complete wave ‘v’ by the end of the week.
Only if price falls below 2958 in a clear five waves pattern,
will I then call the top for wave ‘v’ in place.
Tomorrow;
Watch for price to find support at 3000,
and then turn higher to complete a five wave pattern in wave ‘v’ of (v).
[/vc_column_text][/vc_column][/vc_row]
[vc_row][vc_column][vc_separator border_width=”5″][/vc_column][/vc_row]