
Good evening to you folks, and the Lord’s blessings to you all tonight.
Tonight’s update will be the final one this week as I will be on a ferry tomorrow evening on the way back home from holidays.
I am hoping to get a video up this weekend, possibly on Sunday evening, that is only a hope at this point, I will have to see how the journey goes – I am not very good on open seas to say the least!
Ok, here we go.
EURUSD.
EURUSD 1hr.
EURUSD 4hr.

EURUSD daily.
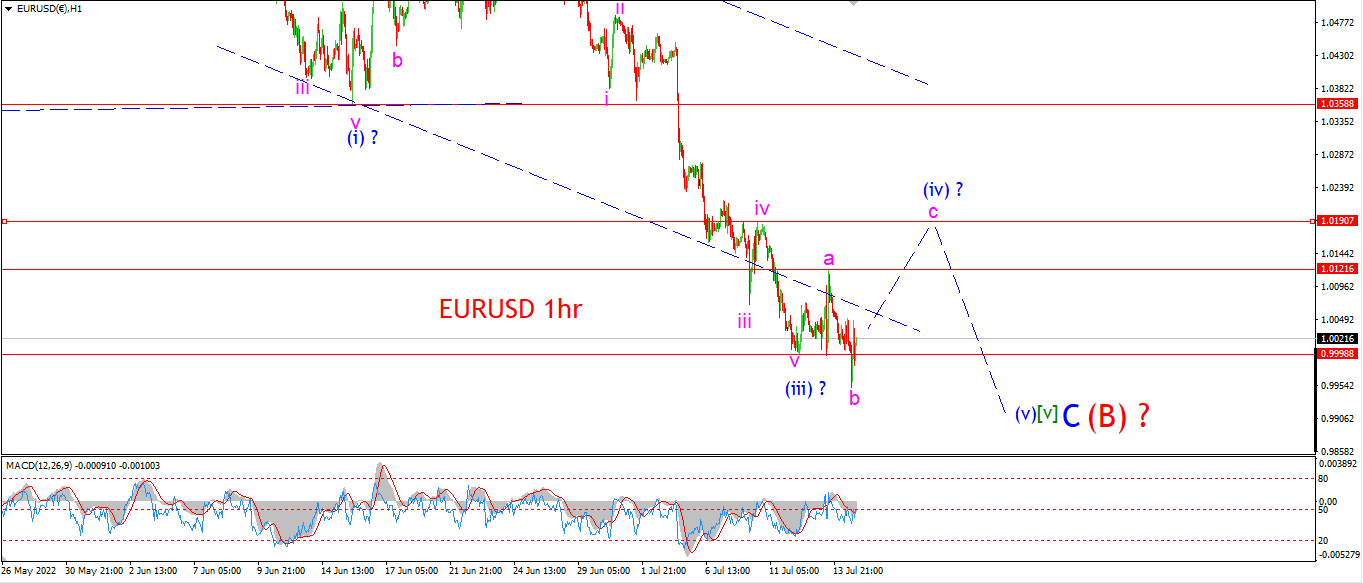
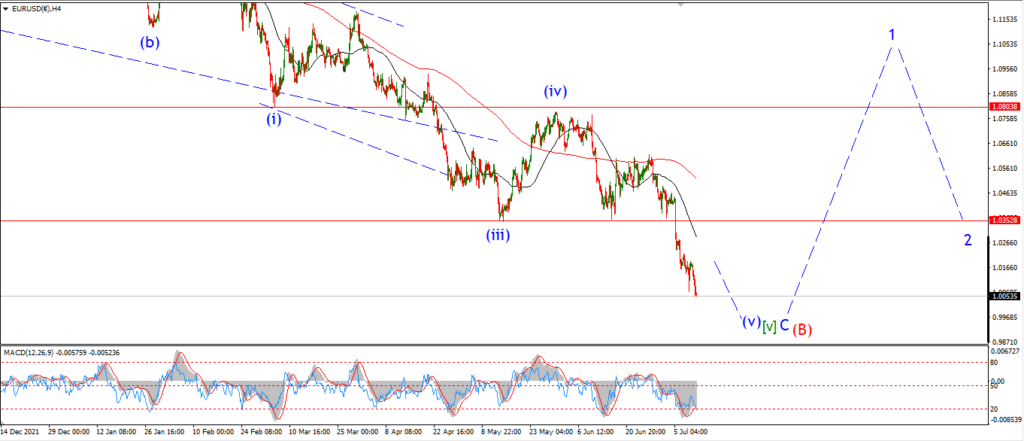
Wave (iv) is now tracing out an expanded flat correction after todays drop to a new low to break parity again.
The sharp drop into todays lows is better viewed as a three wave form,
and that takes the wave ‘b’ label.
The price spiked higher again off that low and I am looking for wave ‘c’ to continue higher to break the wave ‘a’ high at 1.0121 at a minimum.
Tomorrow;
Watch for a five wave pattern higher in wave ‘c’ to continue for the next few sessions.
GBPUSD
GBPUSD 1hr.
GBPUSD 4hr.

GBPUSD daily.
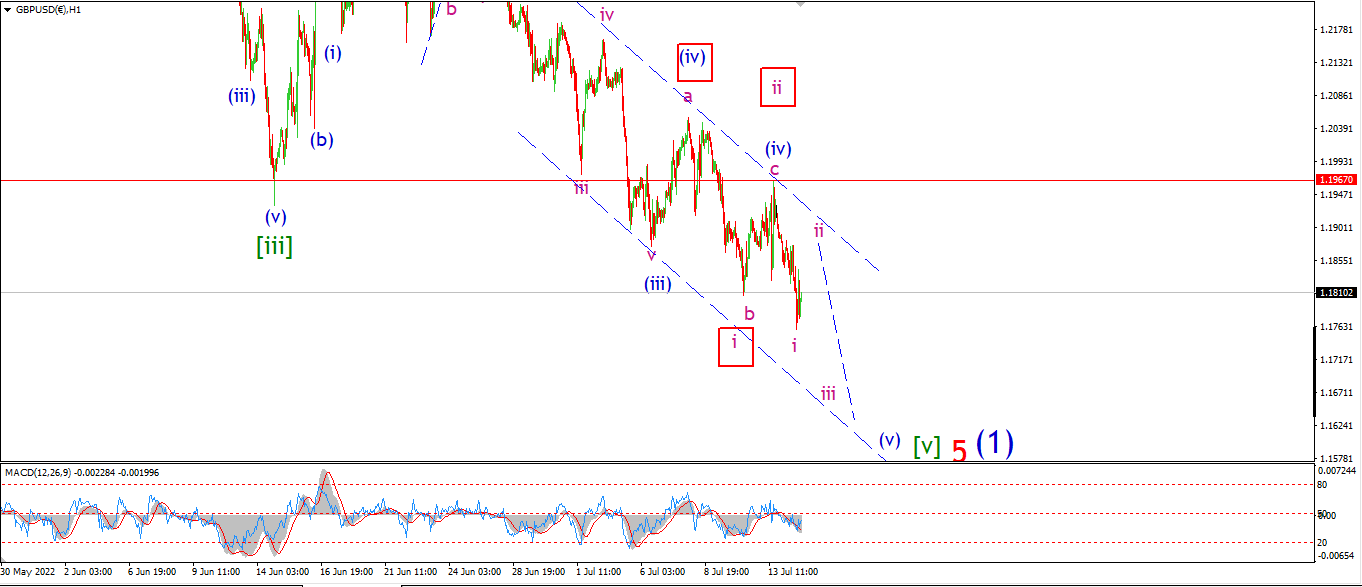
Even though cable is making new lows these days,
it is quite evident in the action that overall momentum is declining.
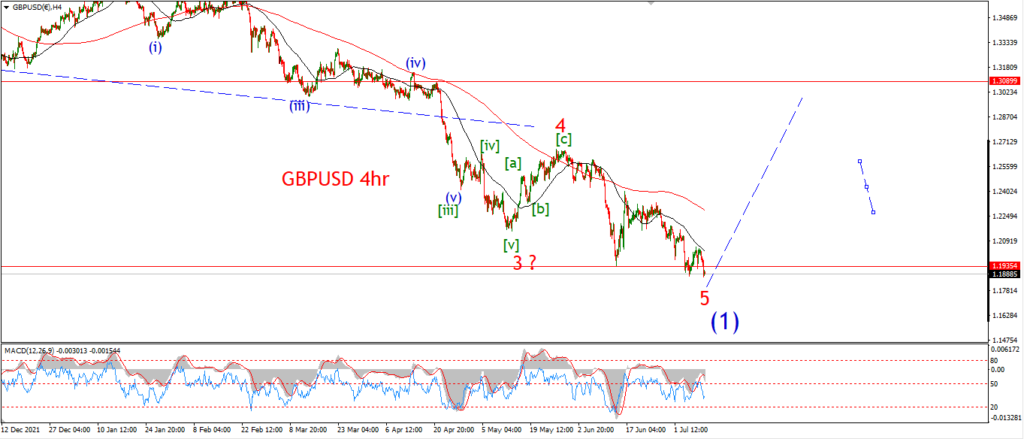
And that is an indication that a fifth wave is coming to a close here.
We still have a full five wave pattern left to complete in wave (v) of [v].
But the end of this decline is coming soo I suspect.
Tomorrow;
Watch for wave ‘i’ and ‘ii’ to complete a lower high below 1.1970.
Wave ‘iii’ of (v) should fall again towards the 1.1600 level and may even tag the lower trend line.
USDJPY.
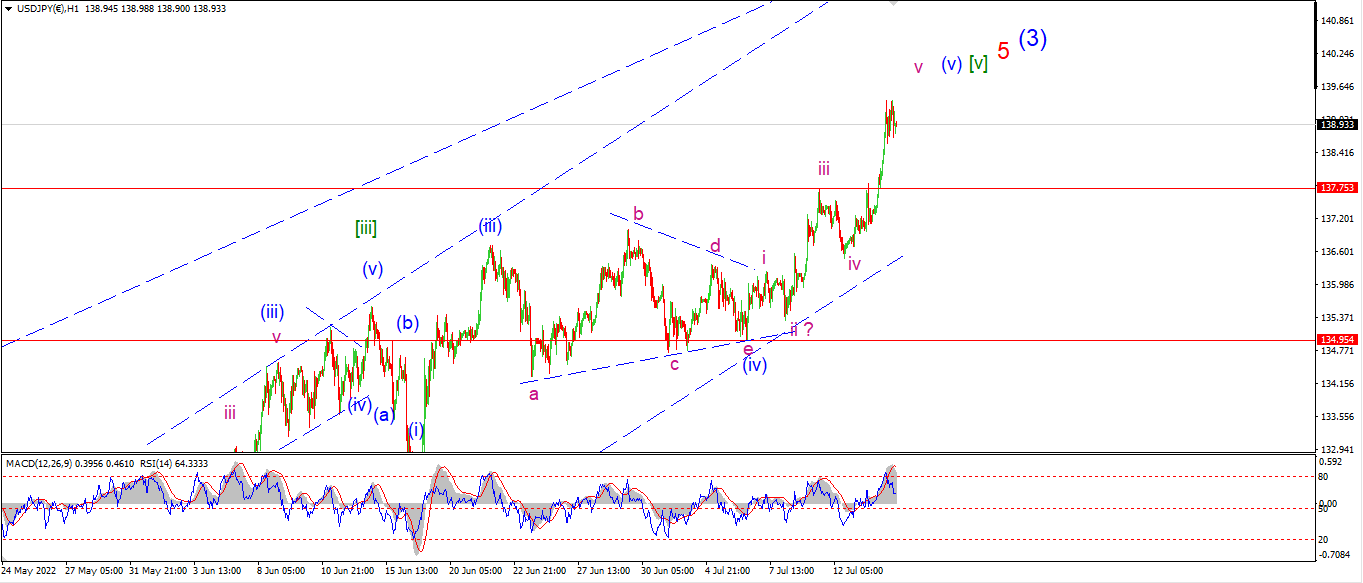
USDJPY 1hr.
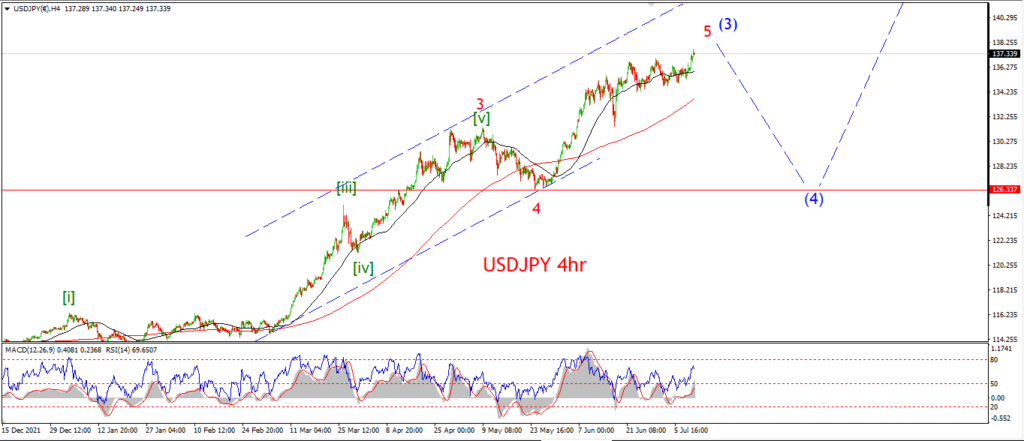
USDJPY 4hr.
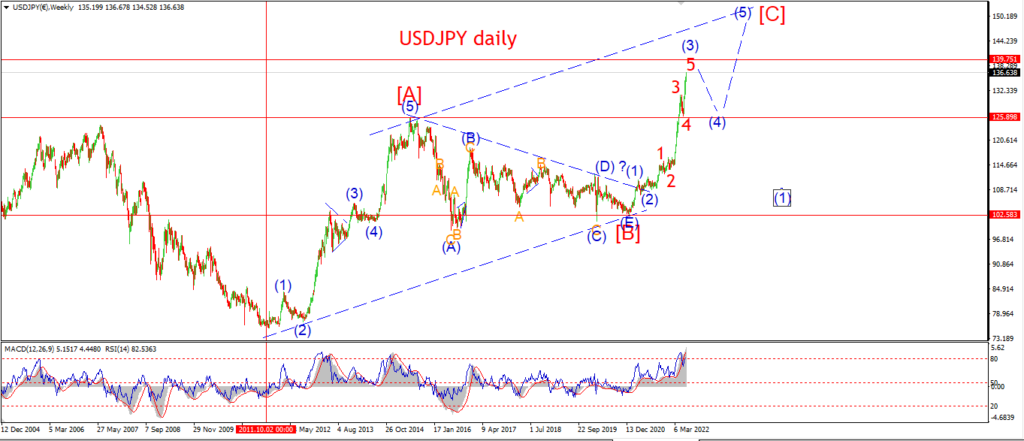
USDJPY daily.
USDJPY went vertical again today and the action seems likely to extend even further before completing wave (v) blue.
The price is holding at the highs in a corrective form at the moment,
so we will likely see another push higher in wave ‘v’ again.
Tomorrow;
Watch for wave (v) blue to complete five waves up by the end of this week.
I am giving up putting an limit on the top here,
even though the USD rally is about as overbought as you can get at the moment!
Either way, I am just going to have to have patience here.
DOW JONES.
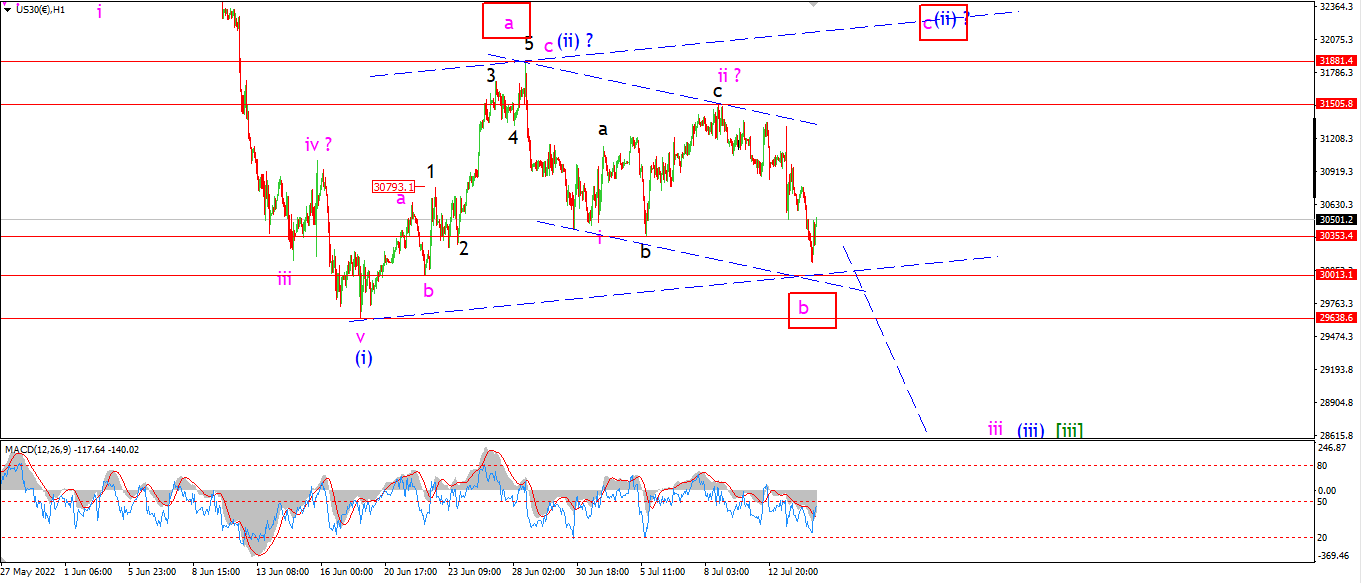
DOW 1hr.
DOW 4hr
DOW daily.
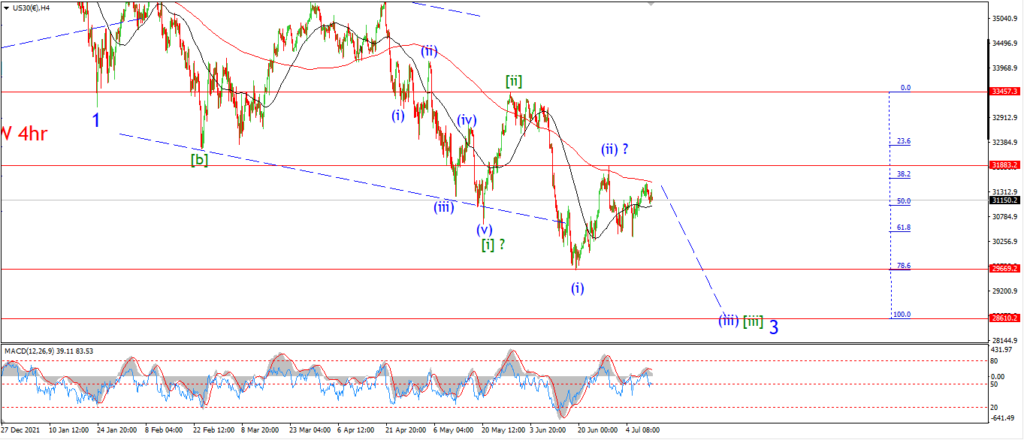
I am looking at another alternate possibility here for wave (ii) again tonight.
The decline over the last few days off the wave (ii) blue label has traced out a three wave pattern to the downside now.
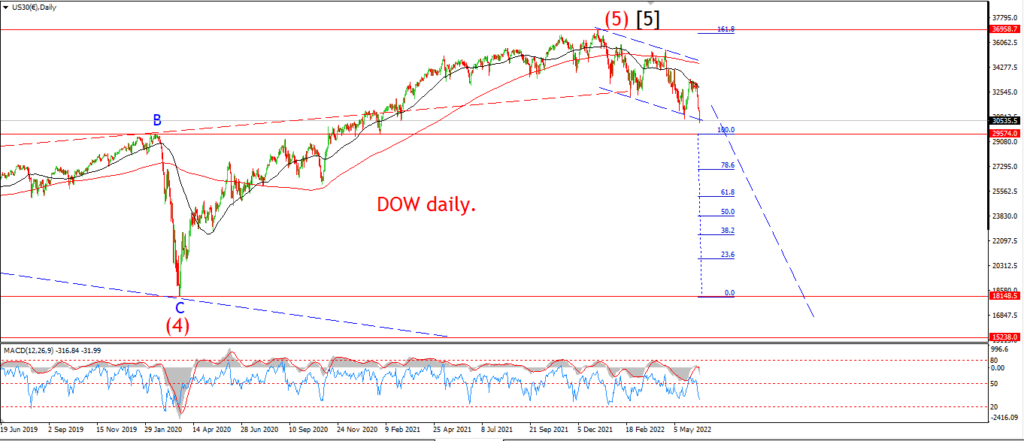
I am still open to the major decline scenario in wave ‘iii’ of (iii),
but the action this week is looking more corrective at the moment than otherwise.
If we see a reasonable bounce tomorrow that breaks back above the 31000 level again,
then I will favor the alternate count for sure.
Tomorrow;
Watch for wave ‘iii’ down to take hold of the market completely tomorrow in order to confirm the bearish pattern.
I will look for a break of 29600 again to confirm the main count.
If we see a bounce off that lower trend channel line near 30000,
and then a rally out in five waves again,
that action will trigger the alternate count.
GOLD
GOLD 1hr.
GOLD 4hr.
GOLD daily.
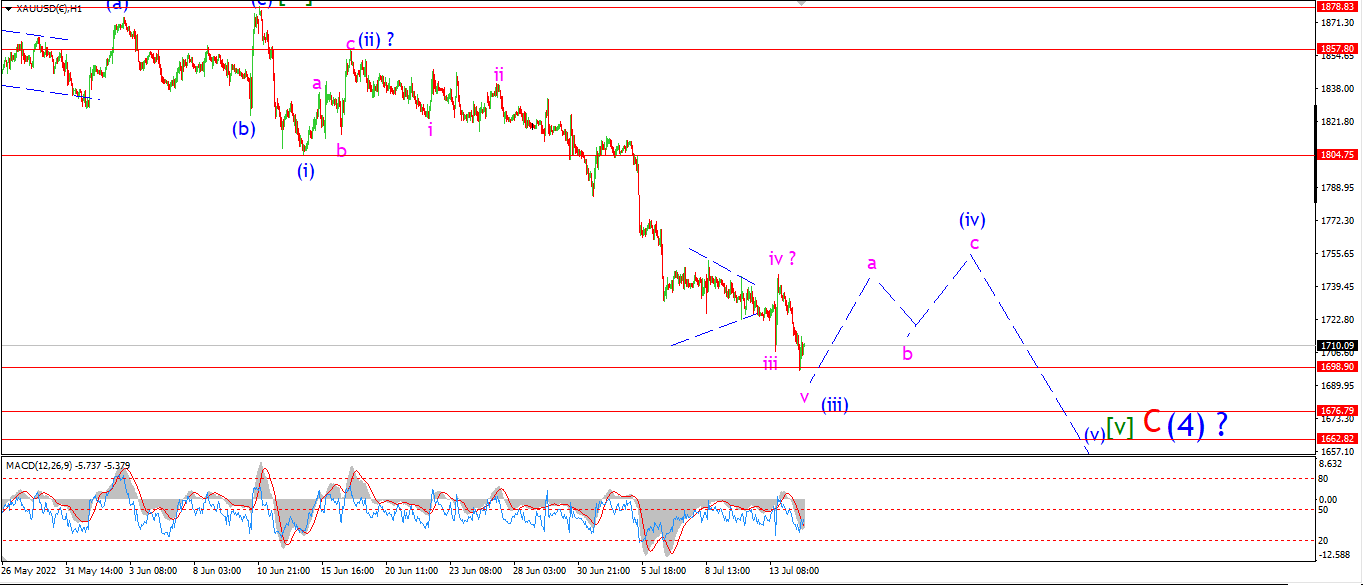
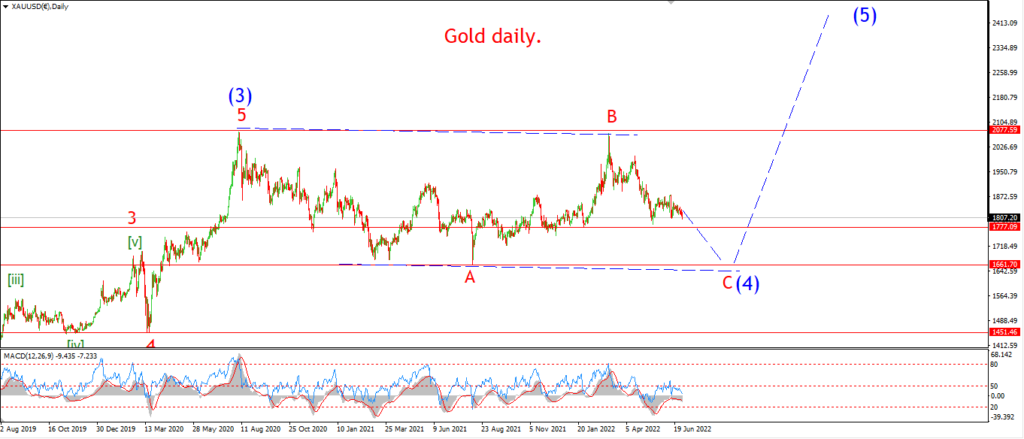
Gold dropped below 1700 today for the first time since last summer.
So we have spent a year going absolutely nowhere in this market.
That tells me something important about the inflation narrative.
It is a flash in the pan!
This time next year the exact opposite problem will be on the cards.
deflation,
and I suspect Gold will actually rallying in that scenario.
Mainly because of the fear factor involved in deflation.
Deflation means disappearing money and credit,
and gold is hard to disappear, so I see value in that scenario!
Tomorrow;
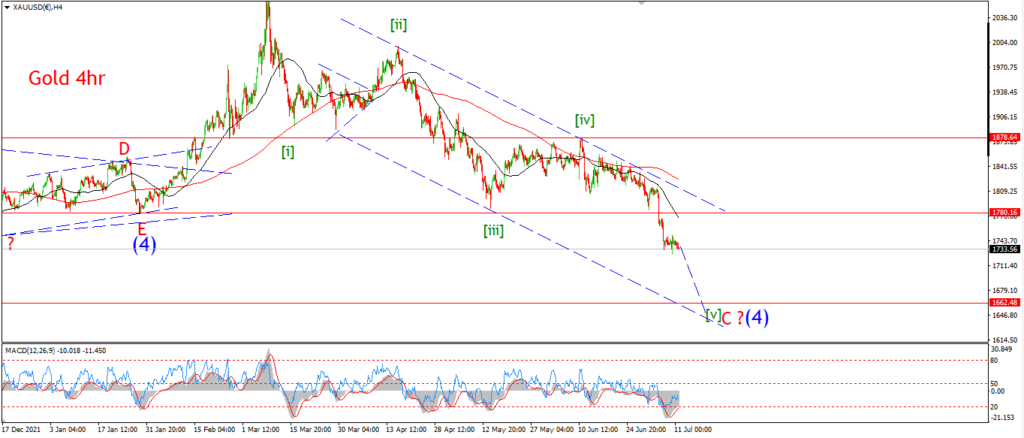
We are getting close to the end of this pattern in wave [v] of ‘C’ now.
One more step lower in wave (iv) and (v) will complete a five wave pattern in wave [v] green.
Watch for wave (iii) to find a low by the end of Fridays trade.
I suspect we will see a bounce into wave (iv) beginning next week.
CRUDE OIL.
CRUDE OIL 1hr.
CRUDE OIL 4hr.
CRUDE OIL daily.
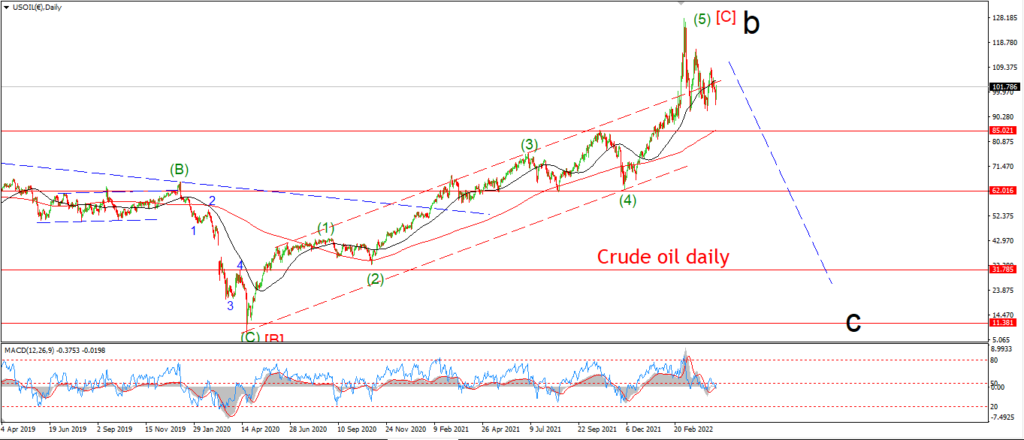
Another day and another variation count for crude!
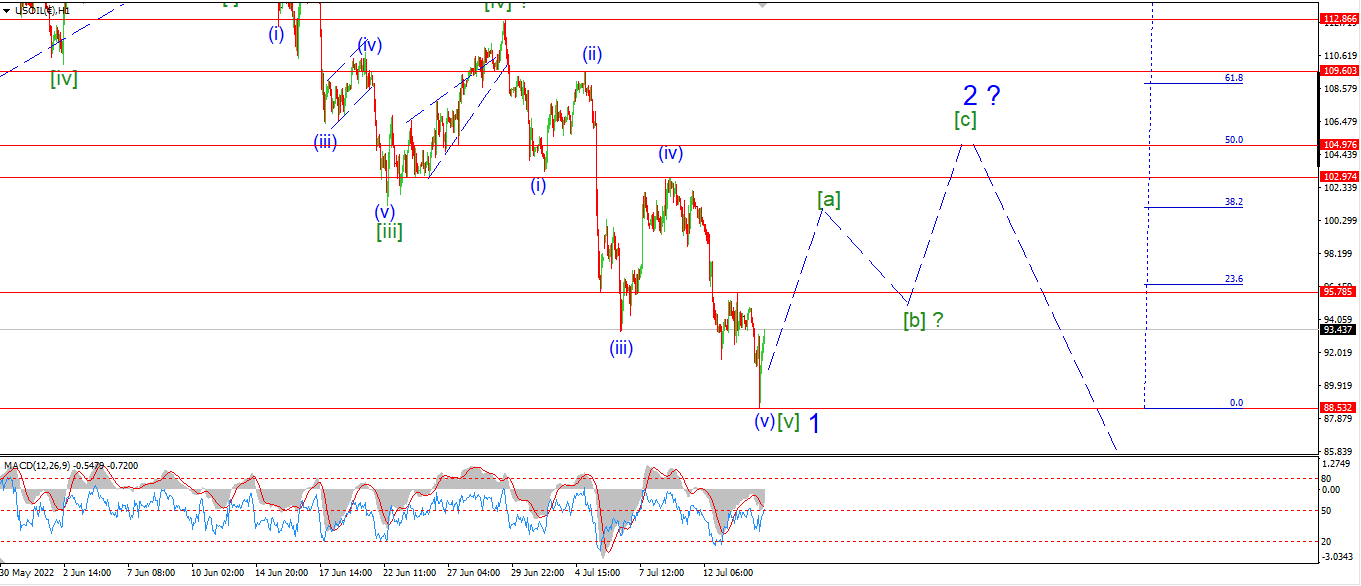
The decline this week has traced out a five wave pattern lower now.
And this low can form a nice five wave decline off the top on June 8th.
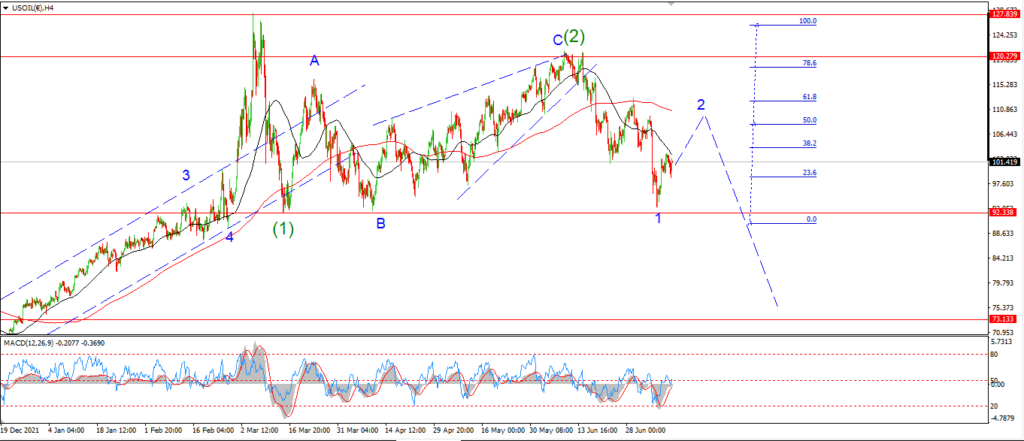
This action no no longer fits the expanded flat correction idea for wave ‘2’.
And I am now looking at a three wave rally forming in wave ‘2’ off that low today.
In this case we should see a five wave rally in wave [a] over the next few days.
And a higher low wave [b] by midweek next week.
Tomorrow;
There is no clear indication that the low is in for wave ‘1’ yet.
But I suspect if we see a rally above 95.00 again that will be a strong hint that the low of wave ‘1’ is now in place.
S&P 500.
S&P 500 1hr
S&P 500 4hr
S&P 500 daily.
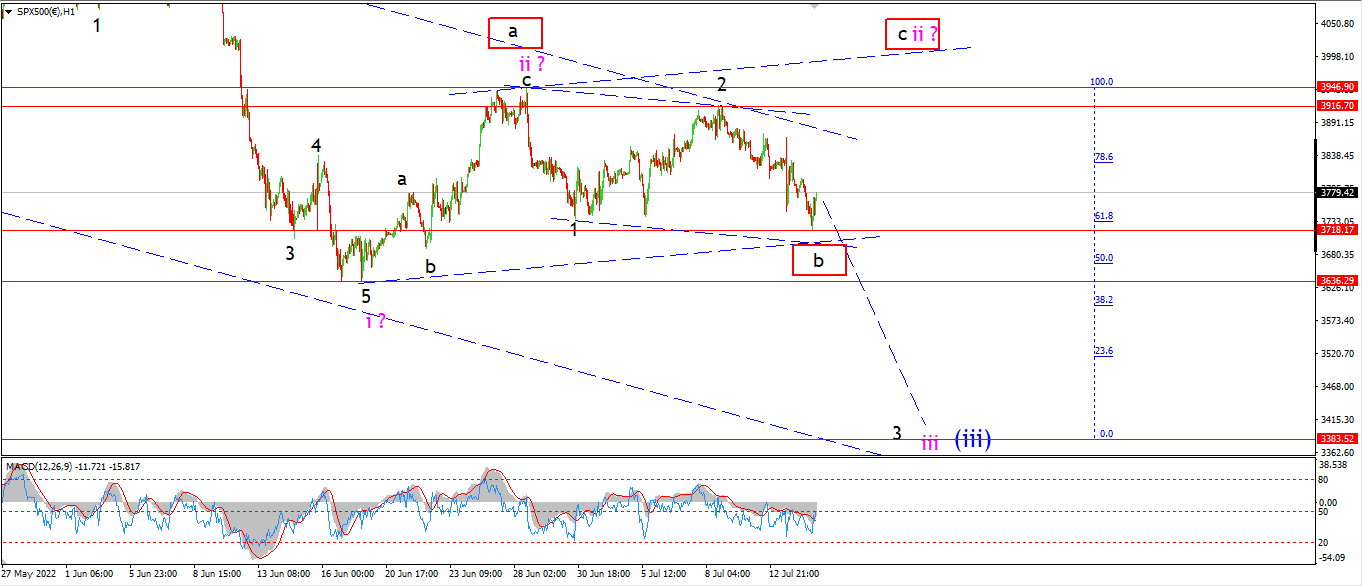
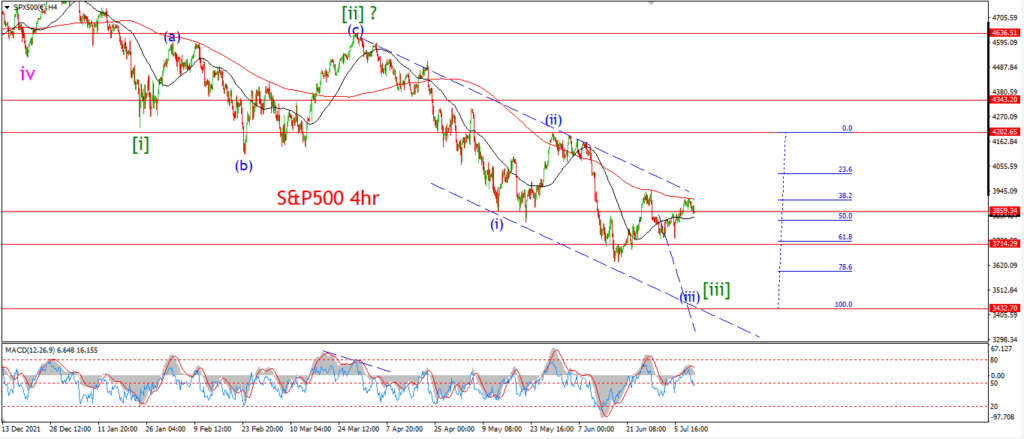
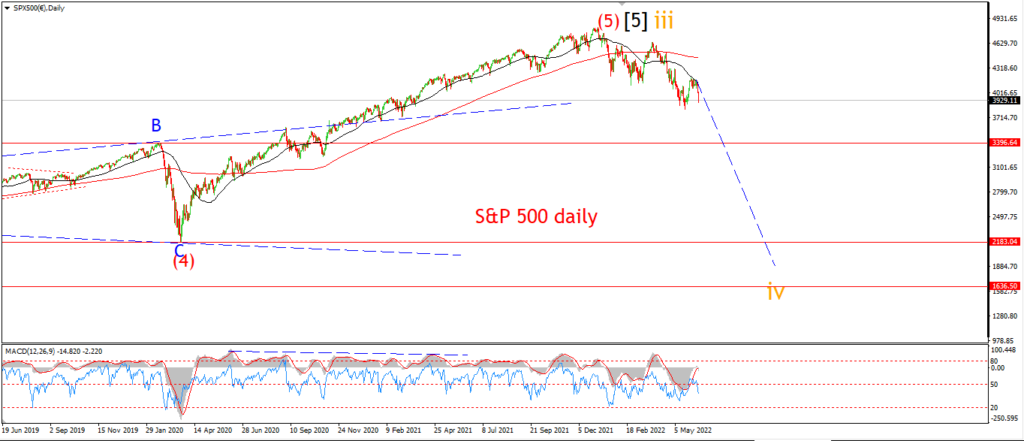
I am showing the same alternate pttern here for the S&P as for the DOW tonight.
If the market does accelerate lower and break 3600 again,
that action will confirm the wave ‘iii’ of (iii) scenario as shown in the main count.
As for the alternate count for wave ‘ii’.
We can see a three wave decline into the session lows today.
This can form a wave ‘b’ of ‘ii’ low.
and in this scenario wave ‘c’ will rally back into the 4000 area again next week to complete three waves up.
Tomorrow;
As it stands,
wave ‘ii’ is proving to be a hard nut to crack.
And only a clear acceleration lower into wave ‘iii’ will confirm the main count now.
I am cautiously looking at that alternate pattern for wave ‘ii’ to see if the market leans that way tomorrow.
A break of 3920 again will trigger the alternate count.
SILVER.
SILVER 1hr
SILVER 4hr.
SILVER daily.
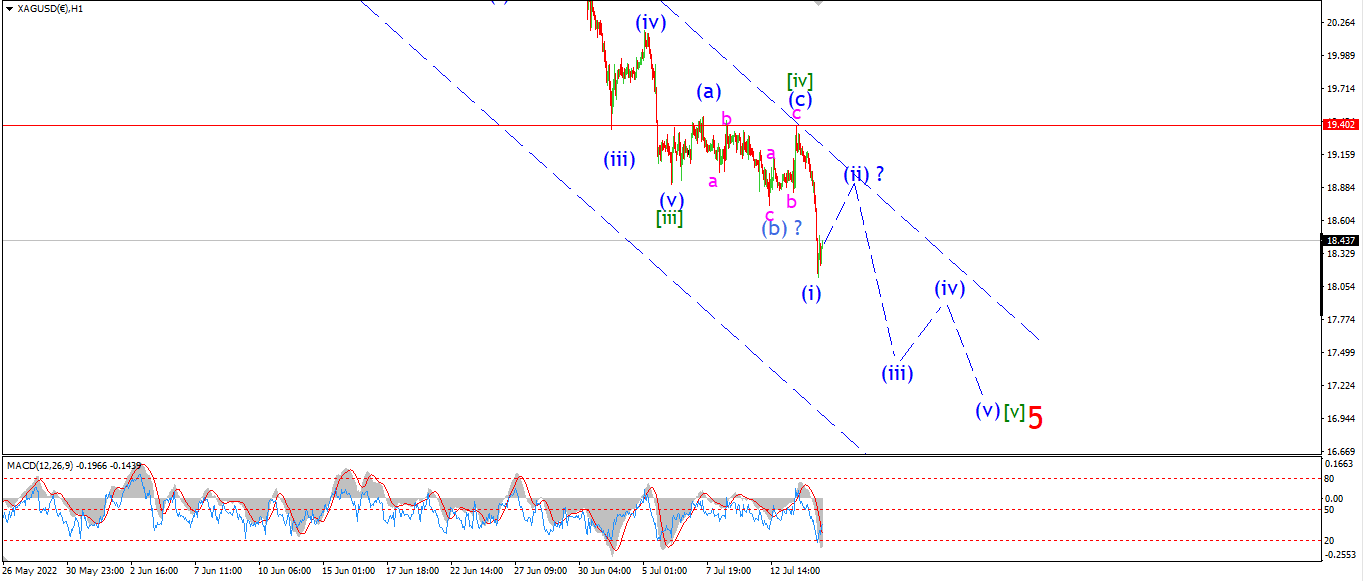
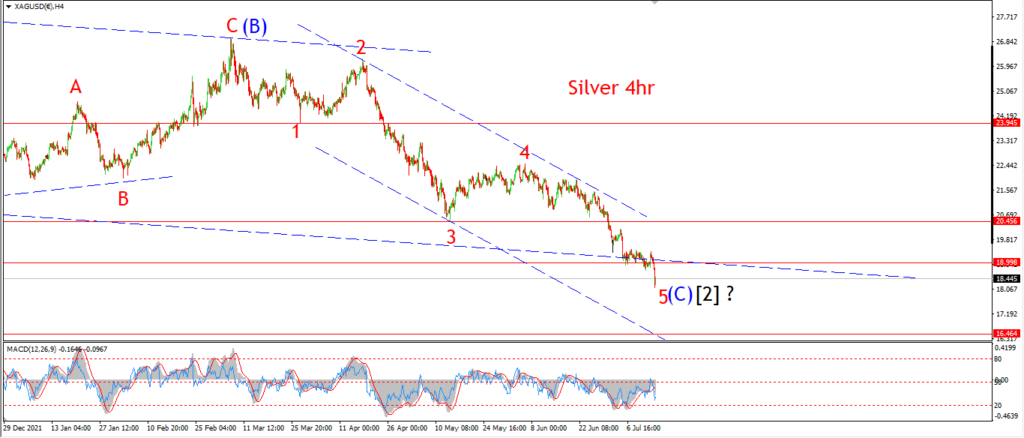
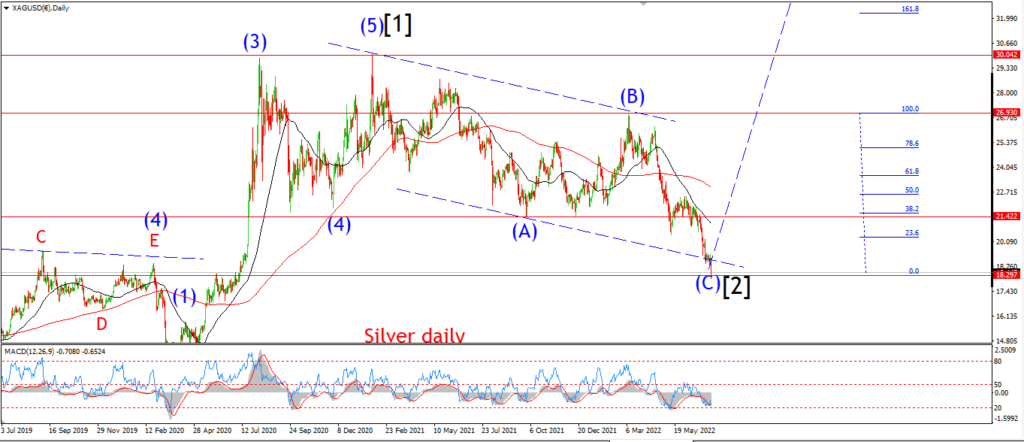
The Bearish pattern in silver is very close to completion now.
And I am now cautiously optimistic again that we will see a significant low form pretty soon.
The pattern in wave [iv] ended up completing a complex running flat correction.
A triple three pattern that failed to see a new high above 19.50 again.
The price spilled lower today out of that corrective formation in wave [iv].
And now we are looking at a low coming soon in wave [v] of ‘5’ of (C) of [2].
on the daily chart wave (C) has already reached equality with wave (A) at todays lows.
The trend channel is filled in wave [2].
we have reached a capitulation point in sentiment,
and there is a double bottom forming in MACD and RSI.
The 4hr chart will allow for more downside in the trend channel.
Maybe we even get as low as 16.50 in that channel.
While the hourly chart is close to completing a five wave pattern in wave ‘5’ of (C).
Tomorrow;
Watch for wave [iv] to hold at 19.40.
Wave [v] will complete five waves down before turning higher for the longer term.
The only question now is how large of a pattern will wave [v] trace out.
I have shown the extended version of this count.
We will see over the next few days how this pattern fills out.
BITCOIN
BITCOIN 1hr.
BITCOIN 4hr.

BITCOIN daily.
….
FTSE 100.
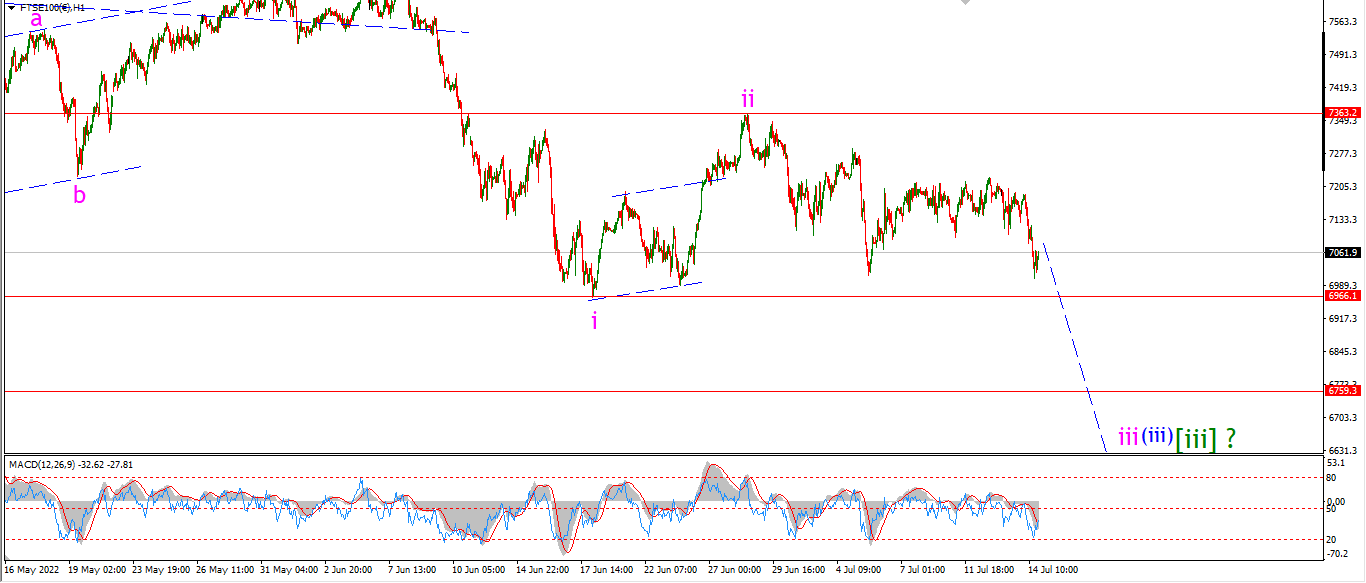
FTSE 100 1hr.
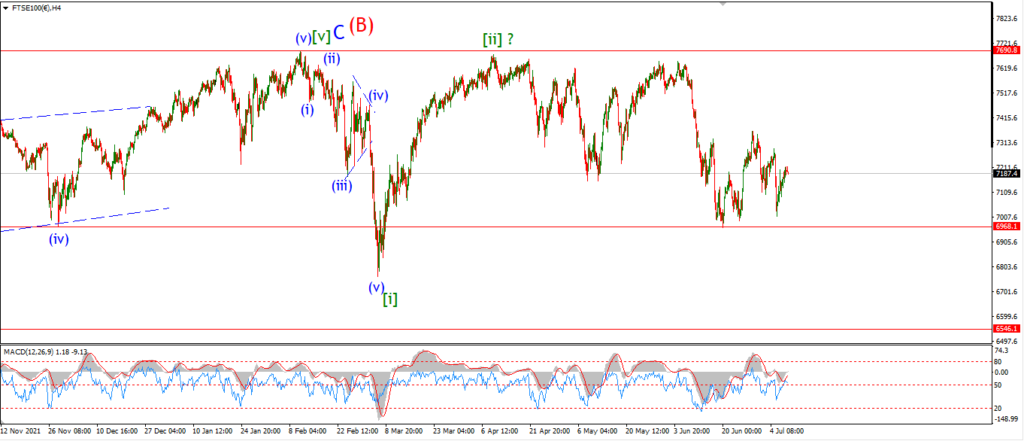
FTSE 100 4hr.

FTSE 100 daily.
….
DAX.
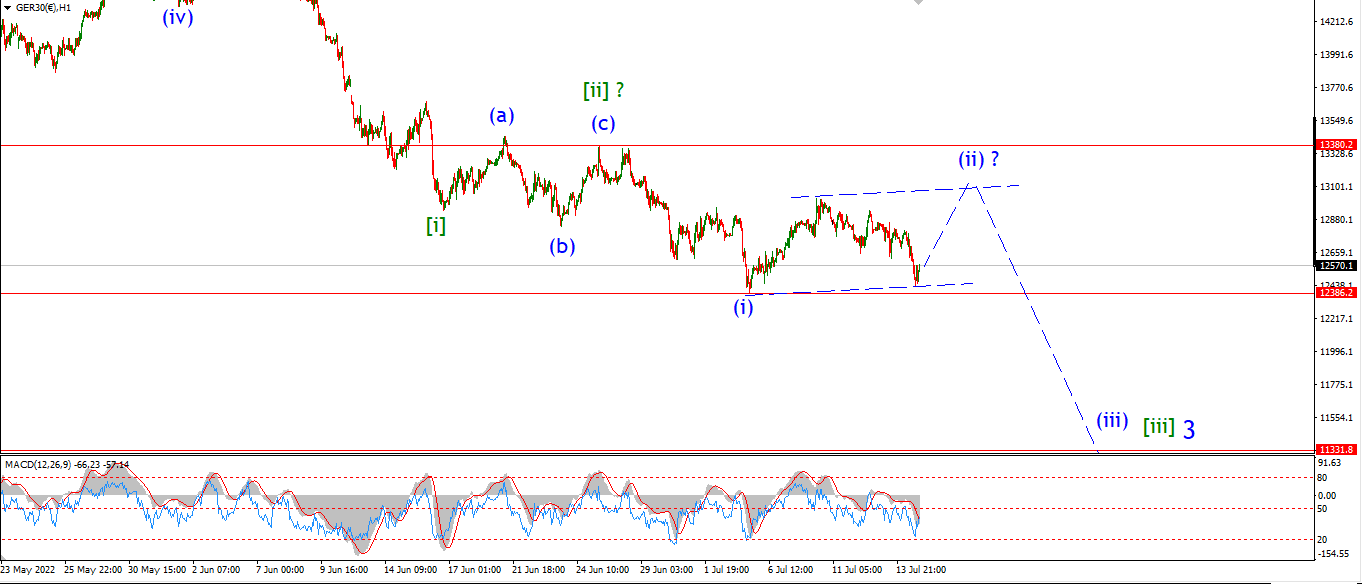
DAX 1hr
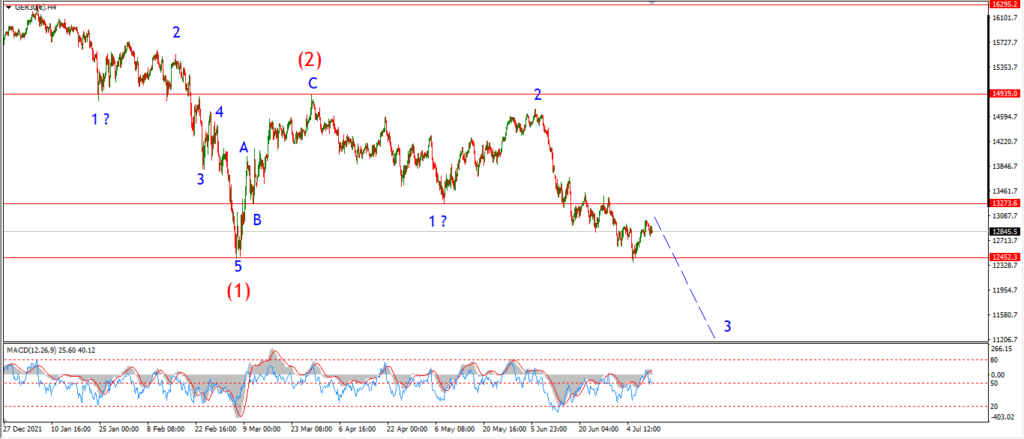
DAX 4hr

DAX daily.
….
NASDAQ 100.
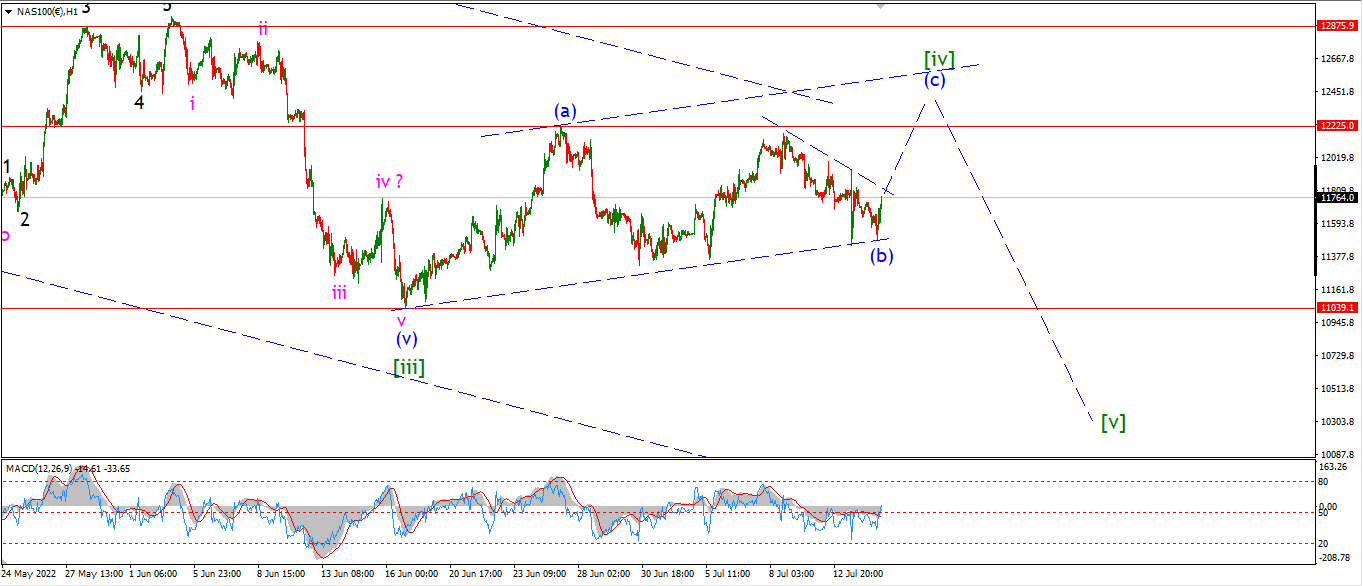
NASDAQ 1hr
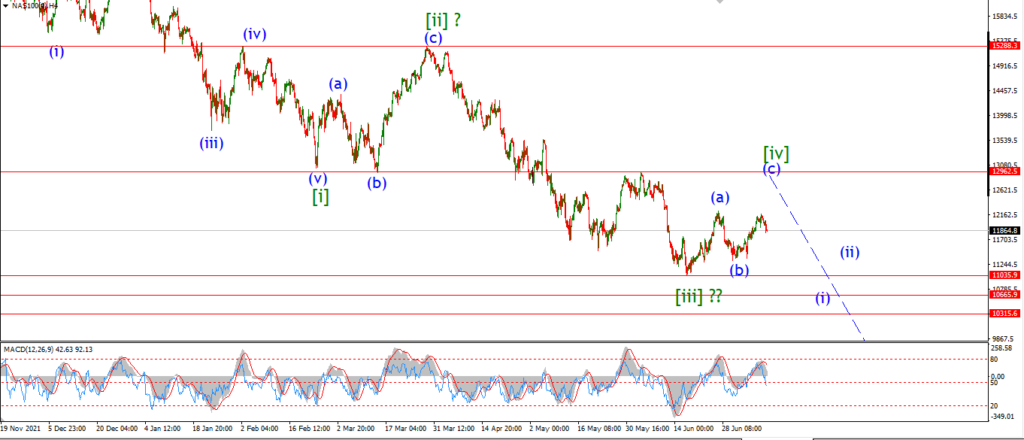
NASDAQ 4hr.
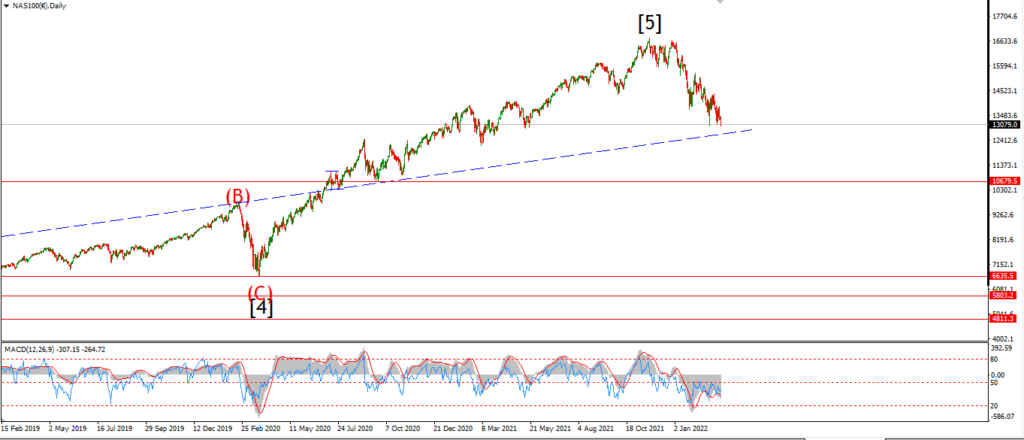
NASDAQ daily.
….