
Good evening folks.
Another few charts to ponder, just in case you were thinking of throwing in the towel and turning ultra bullish!
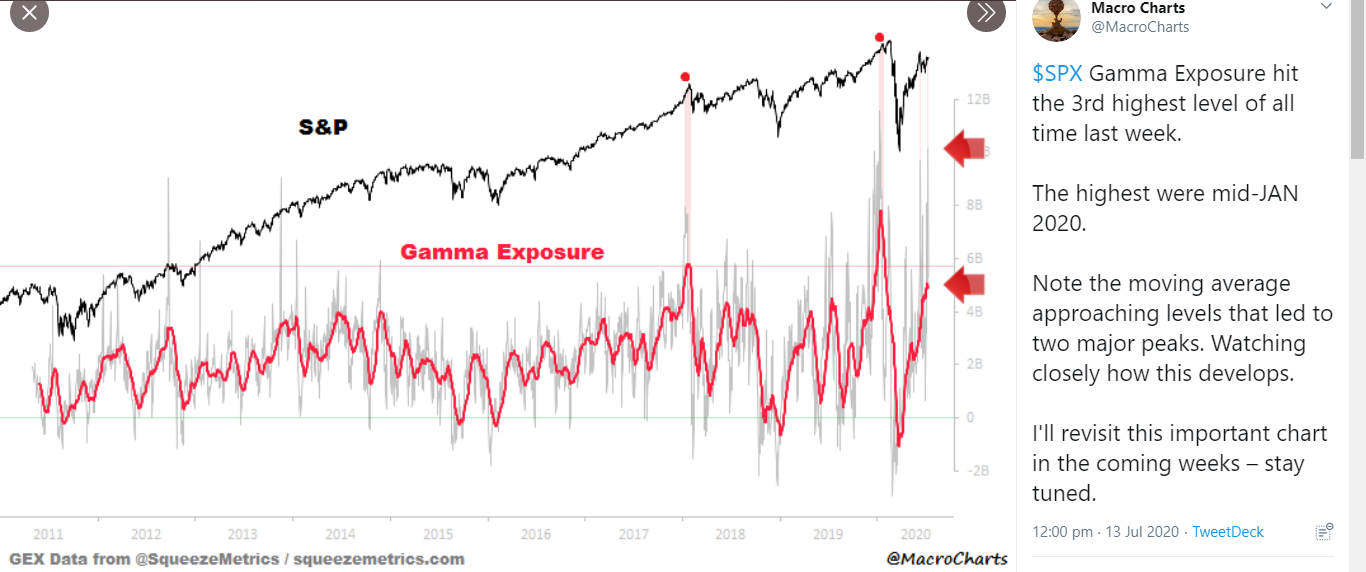
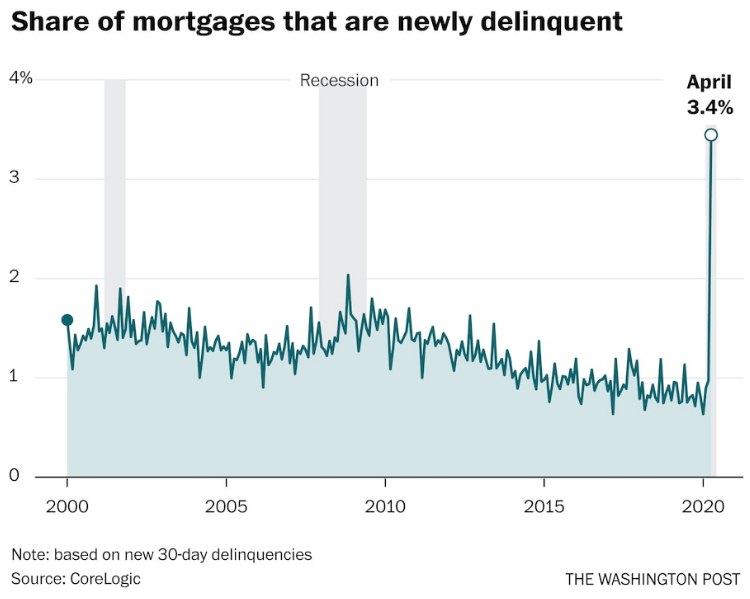
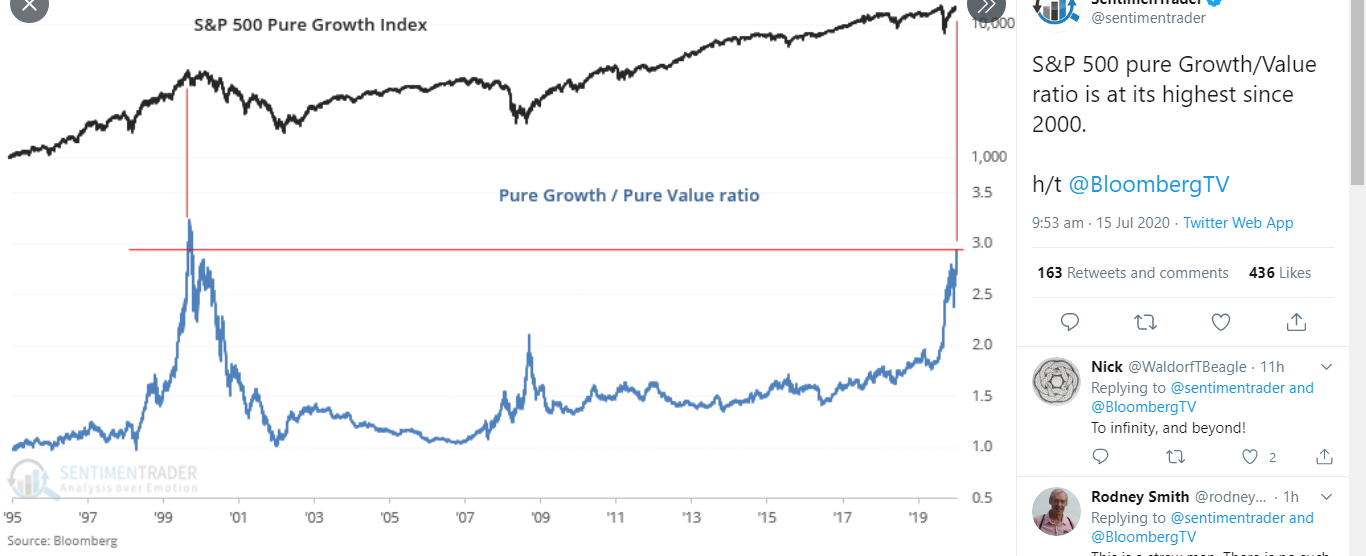
The similarities with the tech bubble in 2000 are just mind boggling now.
And back then the NASDAQ fell 78% peak to trough!
And now you can pop over to John Hussman to see his latest thoughts.
EURUSD.
EURUSD 1hr.
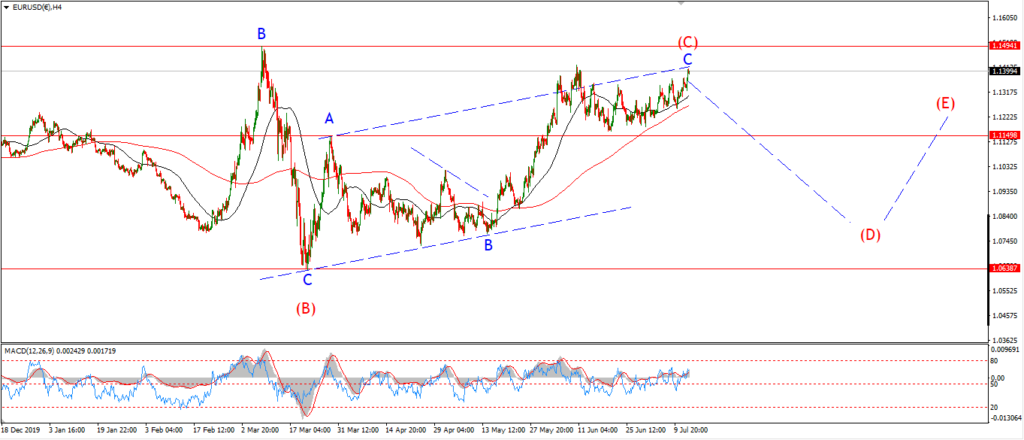
EURUSD 4hr.
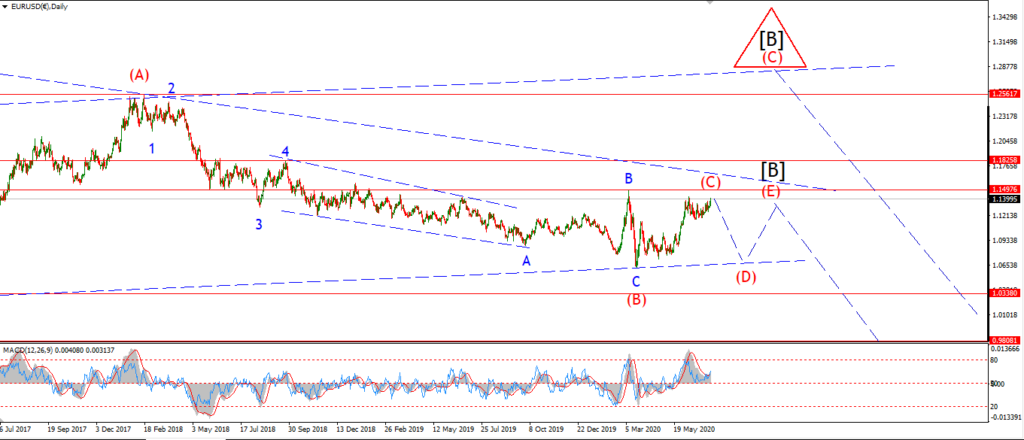
EURUSD daily.
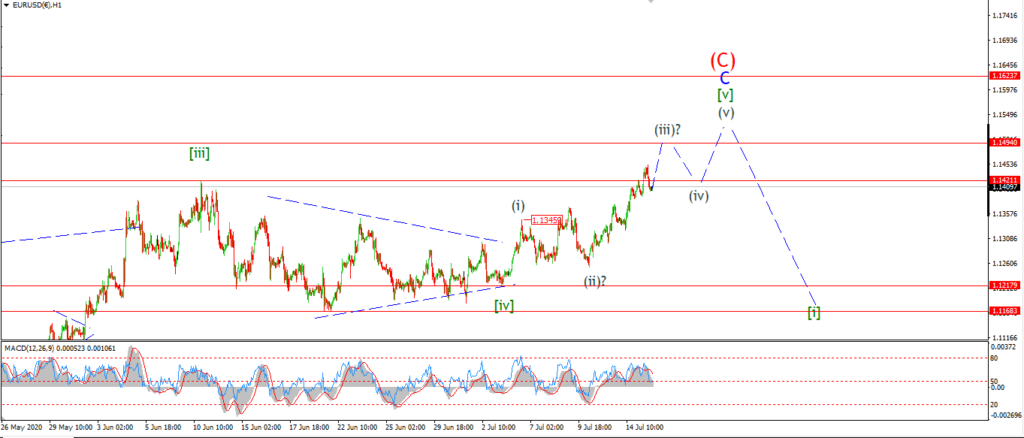
EURUSD did break above the 1.1421 wave [iii] high today.
This is the minimum target for wave [v] to complete.
I am still a little concerned about the internal structure of the rise in wave (iii) of [v] though.
But as long as the price holds above 1.1345 at the wave (i) high,
then this wave count will hold in wave [v].
Tomorrow;
Watch for wave (iii) to push up towards 1.1500 again and trace out a five wave internal pattern.
GBPUSD
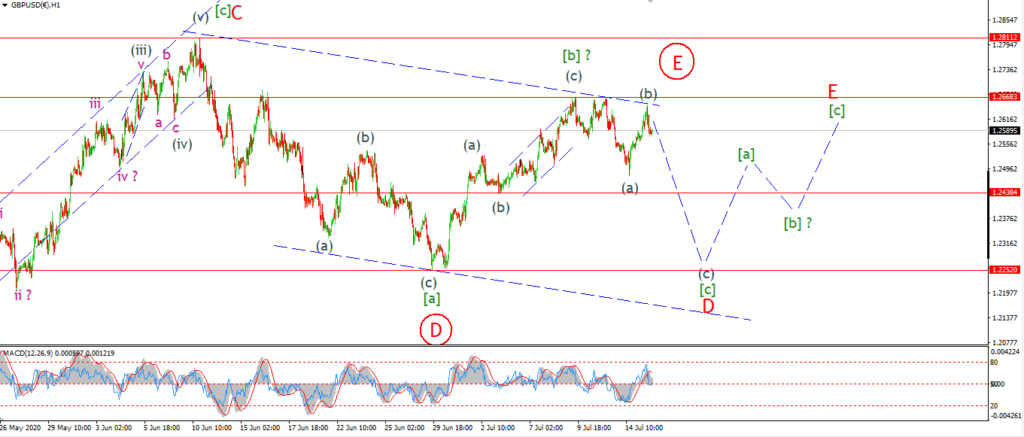
GBPUSD 1hr.
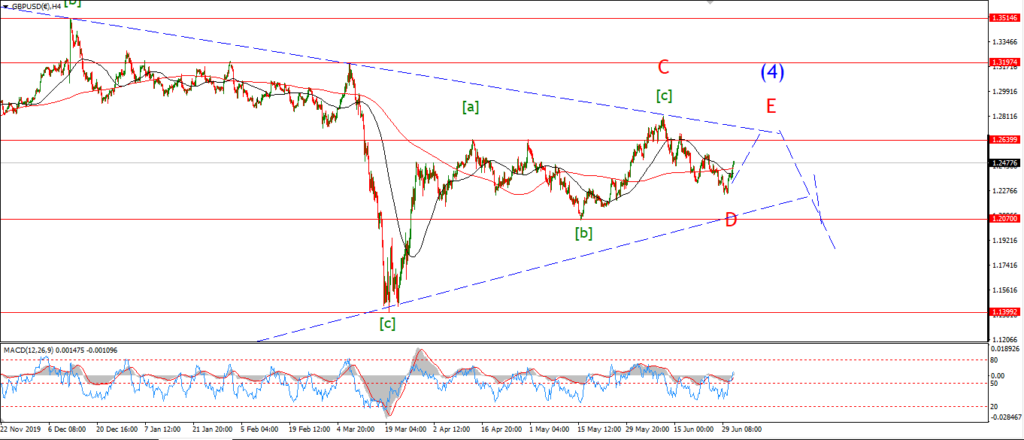
GBPUSD 4hr.

GBPUSD daily.
We had a good start in wave [c] down this week,
but today the price almost retraced the whole decline off the wave [b] high.
The pattern in wave [c] can still develop to the downside as suggested yesterday.
But wave [c] will more likely fall in a three wave pattern.
And the overall pattern in wave ‘D’ would fit a triple combination now.
Tomorrow;
Watch for the high at 1.2668 to hold and wave (c) to turn lower again.
Wave (c) of [c] must break the low at 1.2250 again.
USDJPY.
USDJPY 1hr.
USDJPY 1hr.
USDJPY daily.
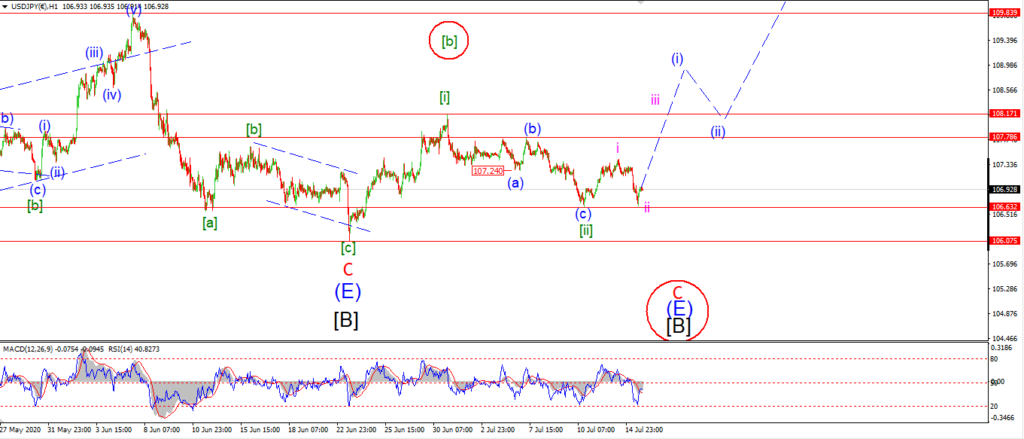
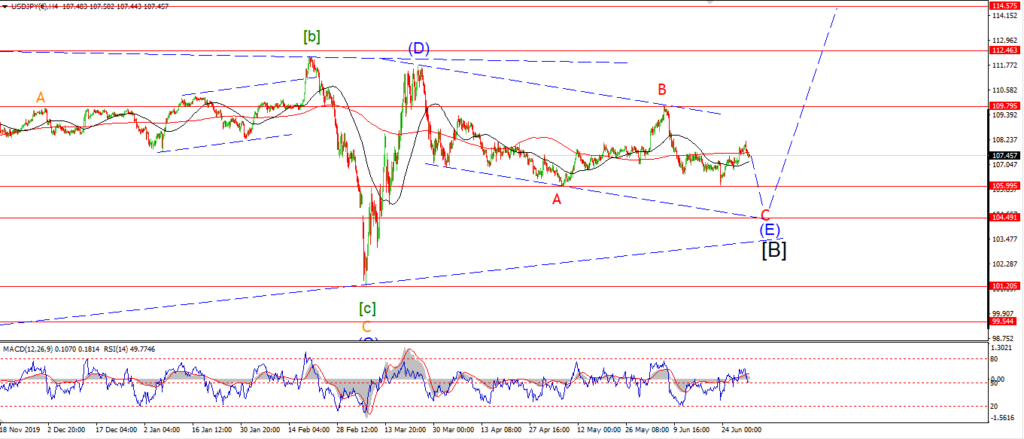
USDJPY is cutting it close today after falling into initial support at 106.63.
If the price falls below this level that will rule out the current chort term count.
The alternate count will be triggered with a break of 106.07 again.
And if that happens,
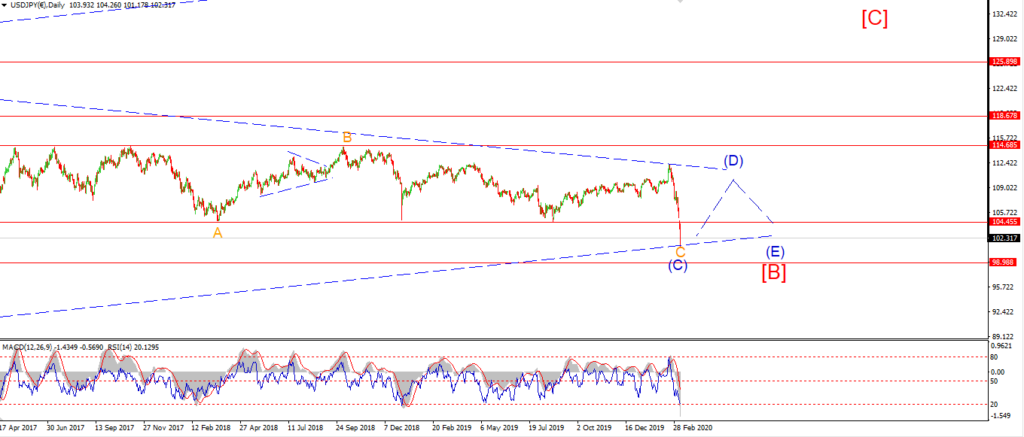
we will have for wave (E) of [B] to complete at about 105.00,
before we can look higher into wave (i) up again.
Tomorrow;
Firstly, I want to see the wave [ii] low at 106.63 to hold.
The price must head higher again and break 107.78 to signal wave (i) has begun.
DOW JONES.
DOW 1hr.
DOW 4hr
DOW daily.
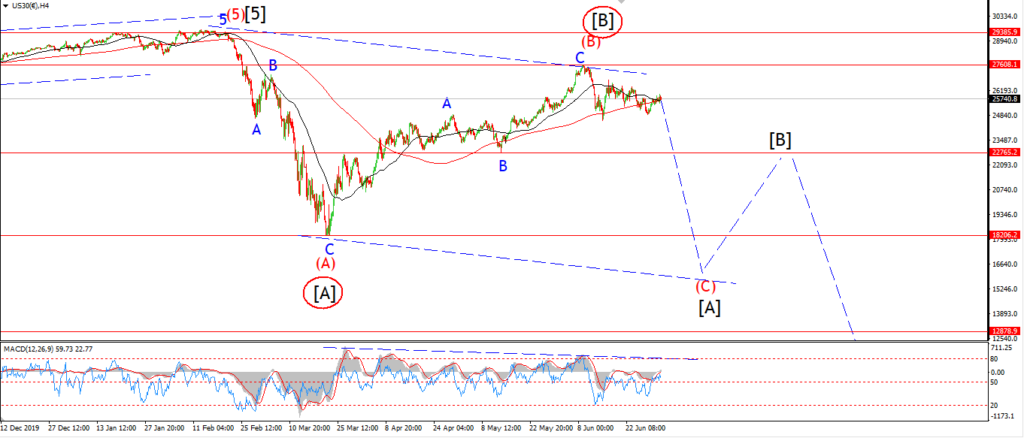
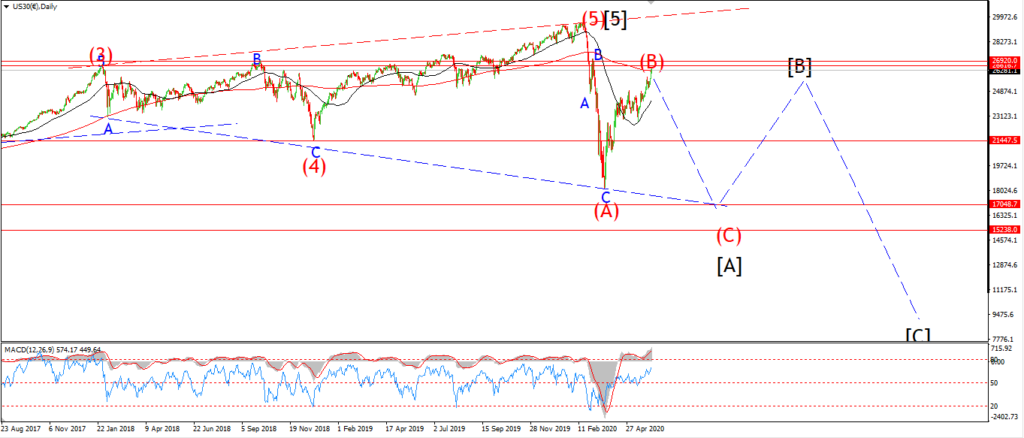
The two main stock indexes are now showing a pretty big non confirmation off the June highs.
The S&P has broken that high again only to fail at a break out.
While the DOW has not managed a new high at all so far.
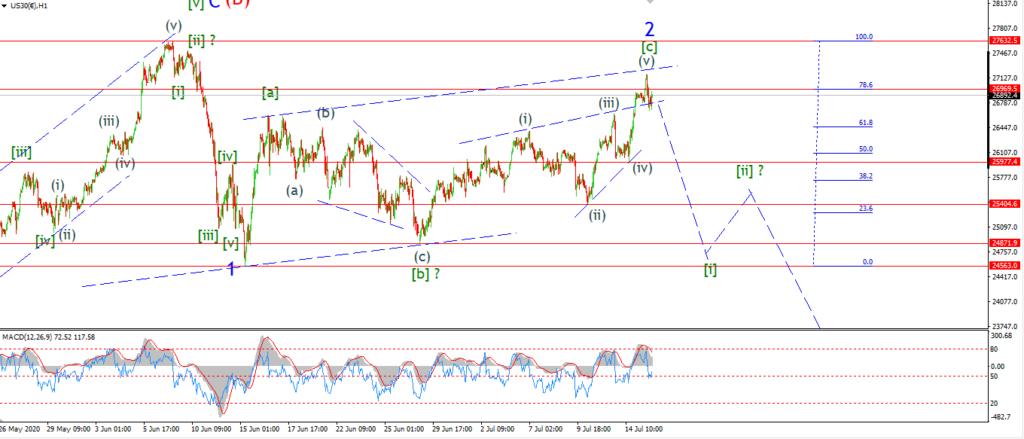
The market did spike again today,
but the price only managed to hit the upper trend channel line,
before turning lower again this afternoon.
The rise into the high today is still best viewed as a corrective rally in wave [c] of ‘2’.
And if that is correct,
then todays decline off the high may be the beginning of that long awaited wave [i].
Tomorrow;
The first level of interest on the downside lies at 26000 where wave (iv) completed earlier this week.
The market has not managed a five wave decline since the June selloff.
So that is the main focus as always.
Five waves down in wave [i] of ‘3’ will turn this market for good.
GOLD
GOLD 1hr.
GOLD 4hr.
GOLD daily.
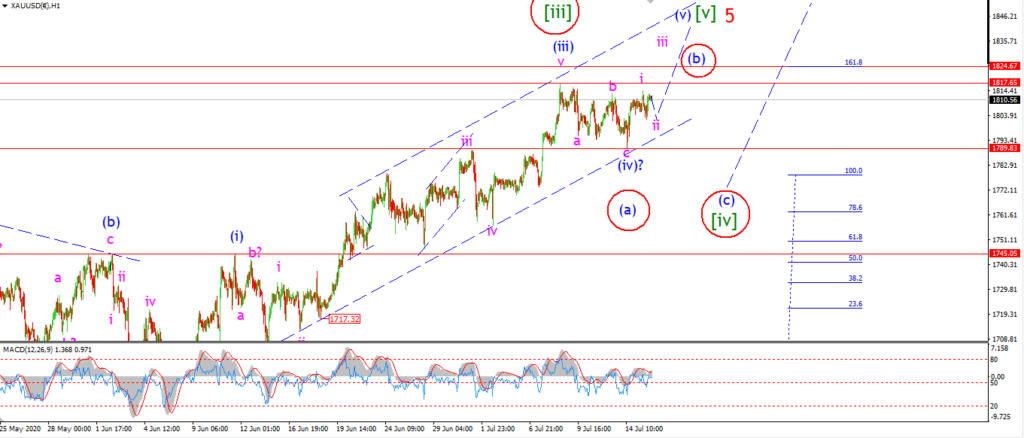
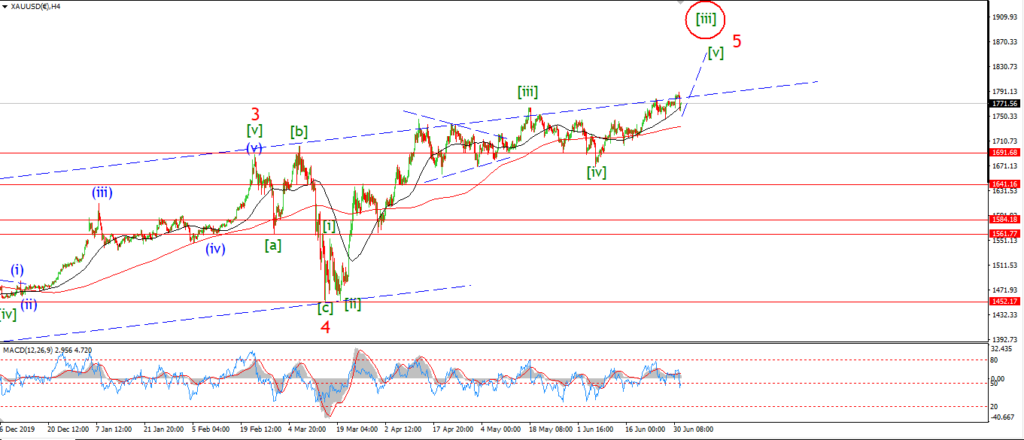
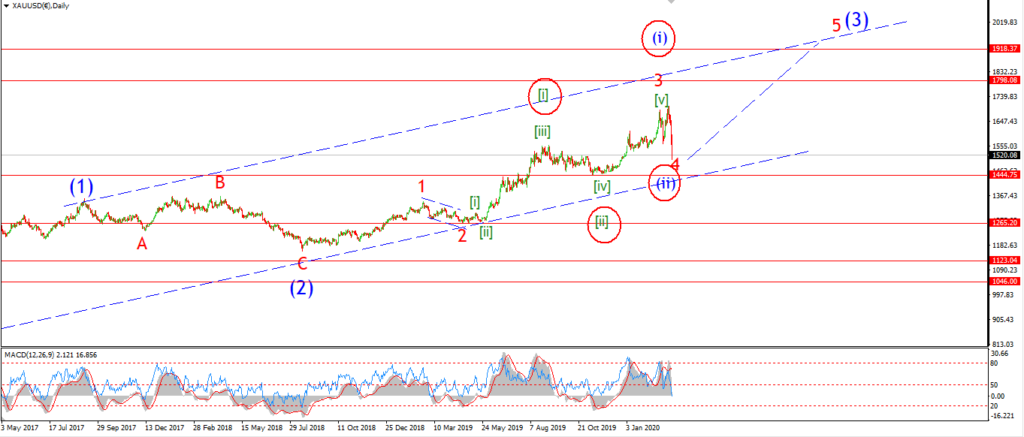
Gold is back above 1800 again today which favors the idea that wave (v) up is now underway.
Wave (v) should trace out a five wave rally,
and the pattern off the low of wave (iv) is now viewed as wave ‘i’ up,
followed by wave ‘ii’ now underway.
Wave ‘ii’ should complete tomorrow,
and that should be followed a rally up towards 1840 again in wave ‘iii’ of (v).
The alternate count can allow for a further rally to a new high also.
but this would be vied as wave (b) of a larger wave [iv] as shown.
Over the next few months I am in favor of a larger selloff to begin as I mentioned.
So I am on the lookout for any sings of an impulsive move lower that might hint at that larger correction.
Tomorrow;
As long as the trend channel on the hourly chart holds,
that I am happy to stick with wave (v) up.
Watch for wave ‘ii’ of (v) to complete and wave ‘iii’ up to begin.
CRUDE OIL.
CRUDE OIL 1hr.
CRUDE OIL 4hr.
CRUDE OIL daily.
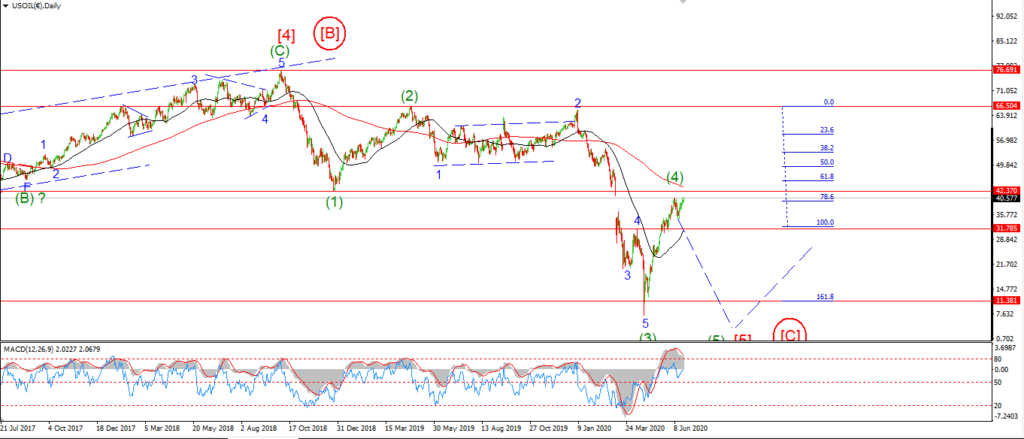
You all know how I view the potential for crude over the coming months.
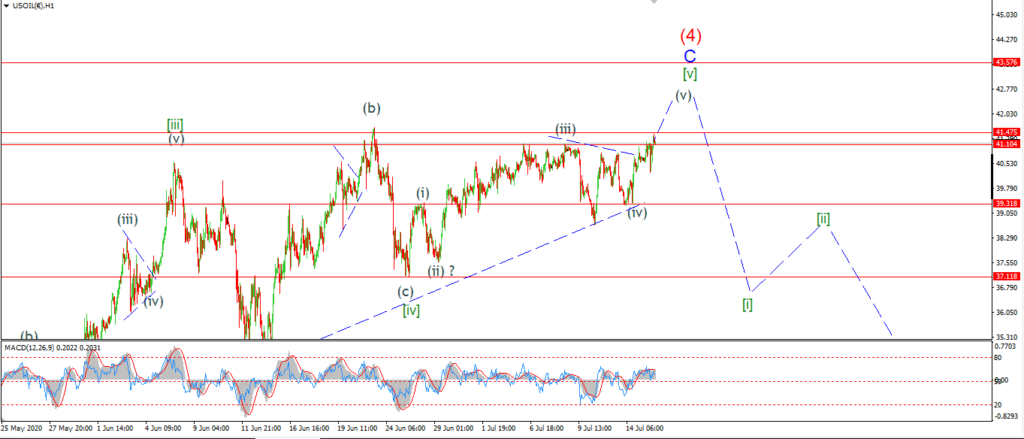
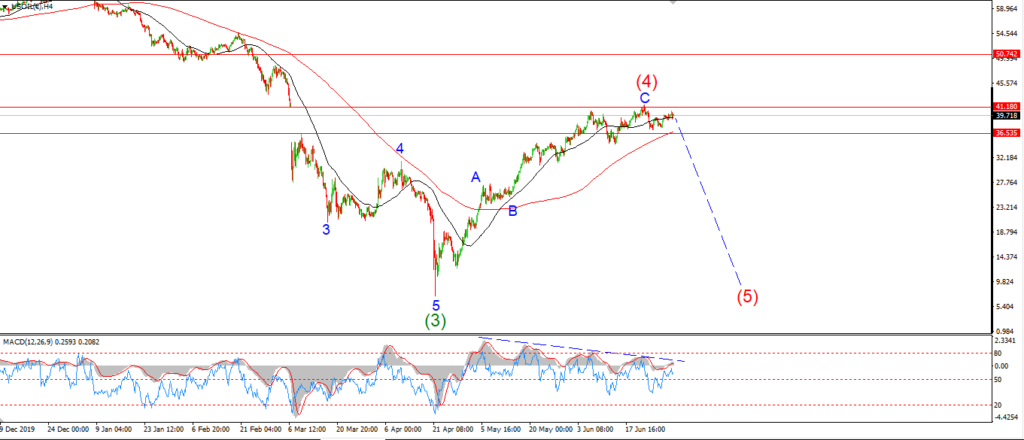
I remain convinced that we are lurching towards another massive selloff in wave (5) down.
And right now we are simply cycling through the final waves of this rally in wave (4).
The action today has ruled out the alternate count shown last night,
but this does not take away from the perilous nature of the current setup.
This market can turn on a dime now,
So I remain vigilant to that reality.
Tomorrow;
The structure of the price action lately is very far from impulsive to the upside.
This fact coupled with the very obvious bearish divergence in place on both the 4hr and daily charts,
all point to a very mature rally on the verge of turning.
Watch for a final high to develop in wave (v) of [v] of ‘C’ this week.
And the next move will be to the downside possibly in a very sharp selloff to begin wave [i] down.
S&P 500.
S&P 500 1hr
S&P 500 4hr
S&P 500 daily.
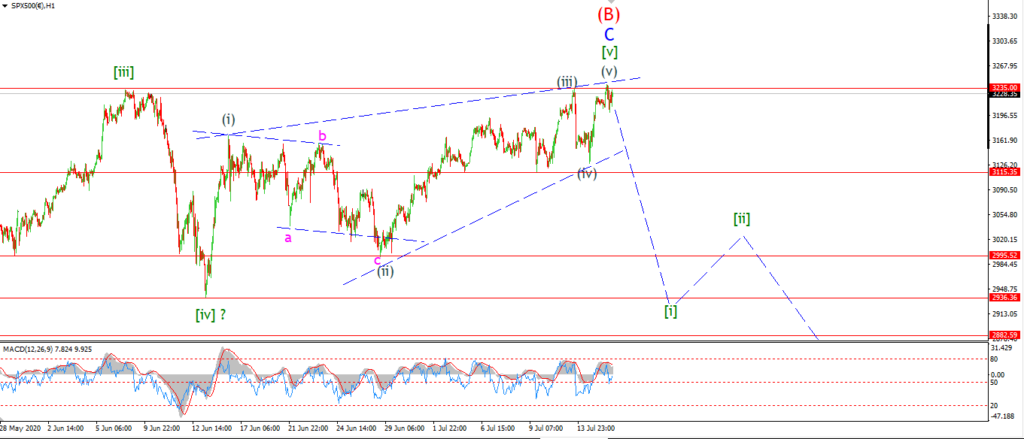
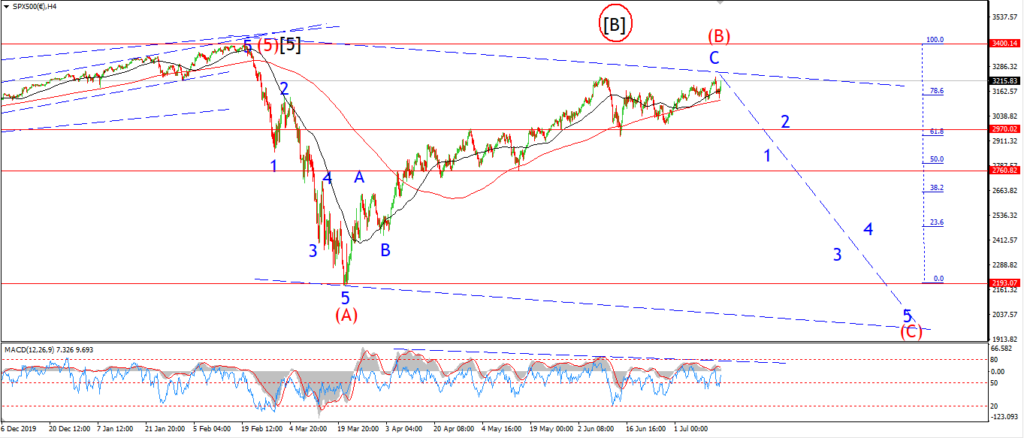
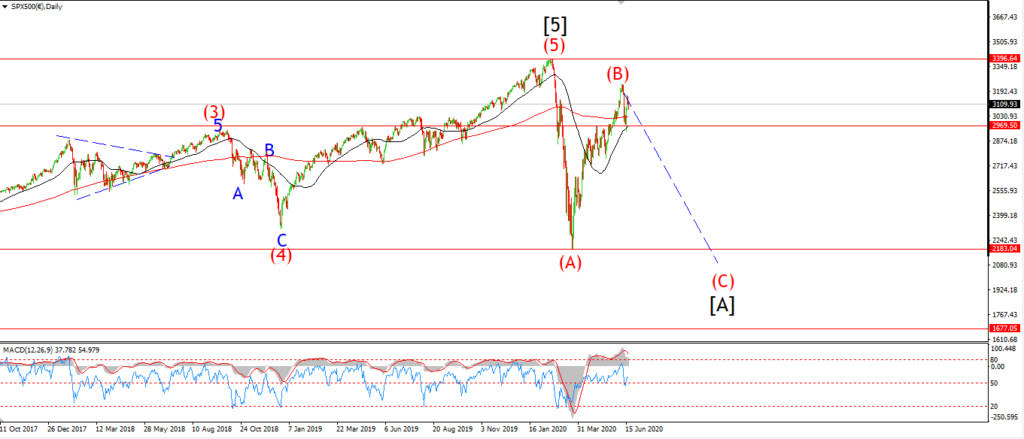
This weeks new high in the S&P is about as narrow a rally that you can possibly have.
The price range is rising in a wedge which is pretty obvious over the last few days.
And this is all happening against a backdrop of very weak momentum on the longer term charts.
The action over the last month is very reminiscent of the action from January into early February.
the market kept climbing,
but the advances were weak and punctuated with sharp drops.
And that action lead us into the first leg down in this bearmarket.
Tomorrow;
I am watching 3115 as the signal level that wave [i] down has finally begun.
This market remains a waiting game until we get another impulsive decline.
SILVER.
SILVER 1hr
SILVER 4hr.
SILVER daily.
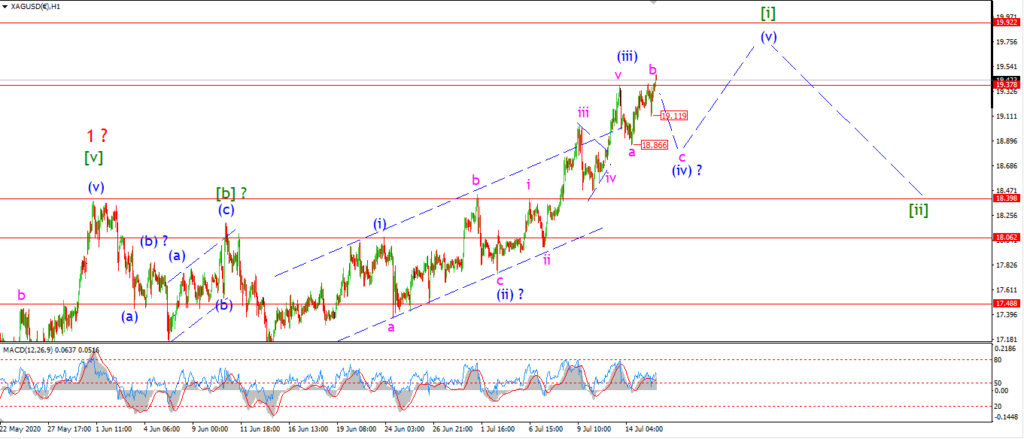
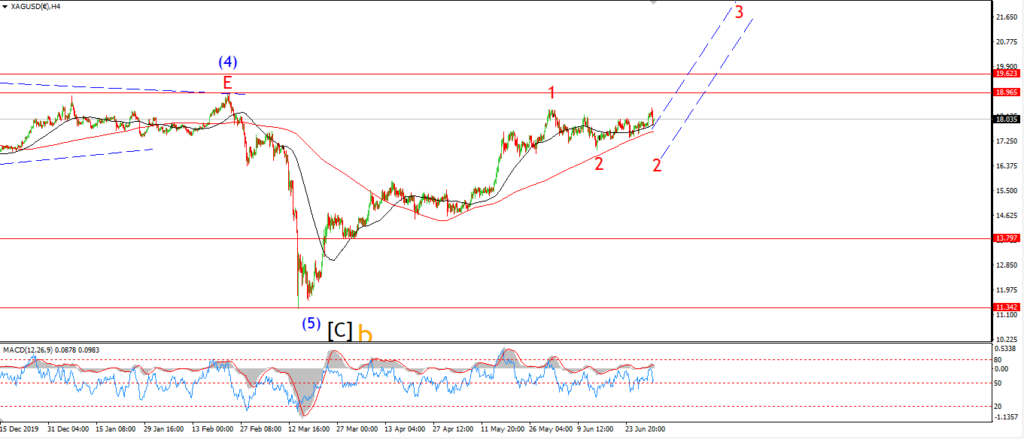
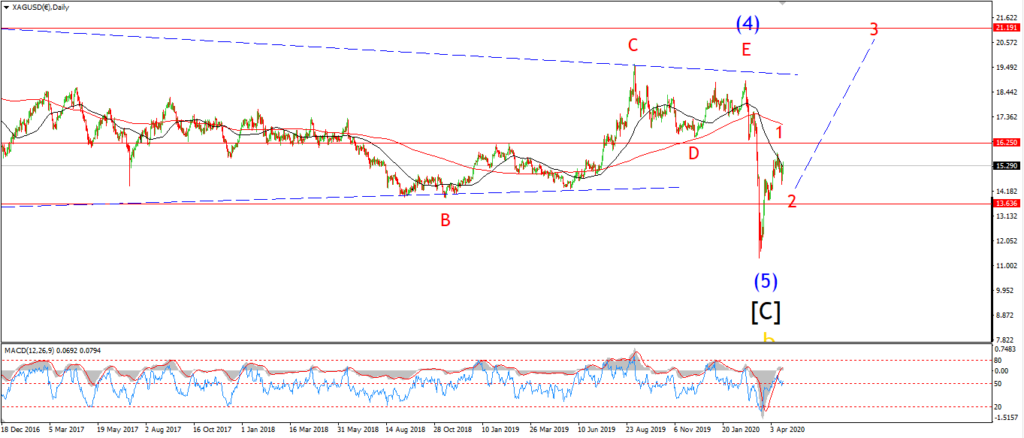
Silver has pushed out to a new high this evening above 19.40.
I think this rise is still best viewed as a three wave rally in wave ‘b’ of an expanded flat correction.
So I am allowing wave ‘c’ of (iv) to fall back below 18.87 again at the wave ‘a’ low.
Tomorrow;
A drop back below 19.10 again will signal wave ‘c’ has begun.