
[vc_row][vc_column][vc_separator border_width=”5″][/vc_column][/vc_row]
[vc_row][vc_column][vc_column_text]
Hi there all.
I hope the day treated you well.
[/vc_column_text][/vc_column][/vc_row]
[vc_row][vc_column][vc_separator border_width=”5″][/vc_column][/vc_row]
[vc_row][vc_column][vc_column_text]
EURUSD
[/vc_column_text][/vc_column][/vc_row]
[vc_row][vc_column][vc_separator border_width=”5″][/vc_column][/vc_row][vc_row][vc_column width=”2/3″][vc_custom_heading text=”1 hr” use_theme_fonts=”yes”][vc_column_text]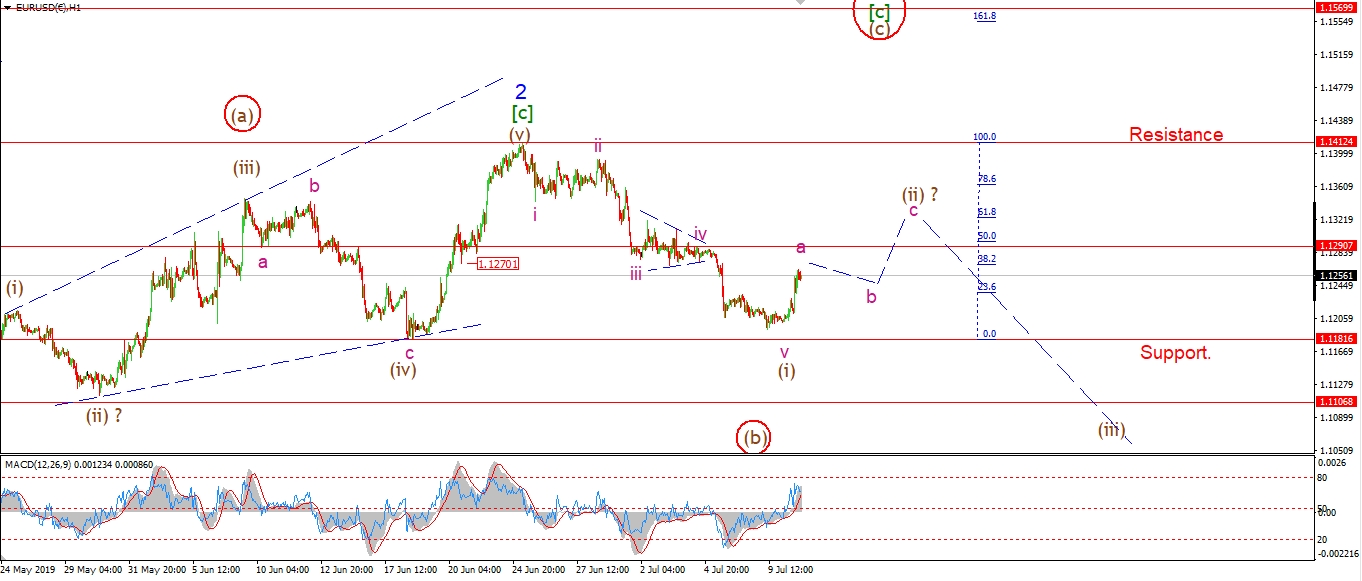 [/vc_column_text][/vc_column][vc_column width=”1/3″][vc_custom_heading text=”4 Hours” use_theme_fonts=”yes”][vc_column_text]
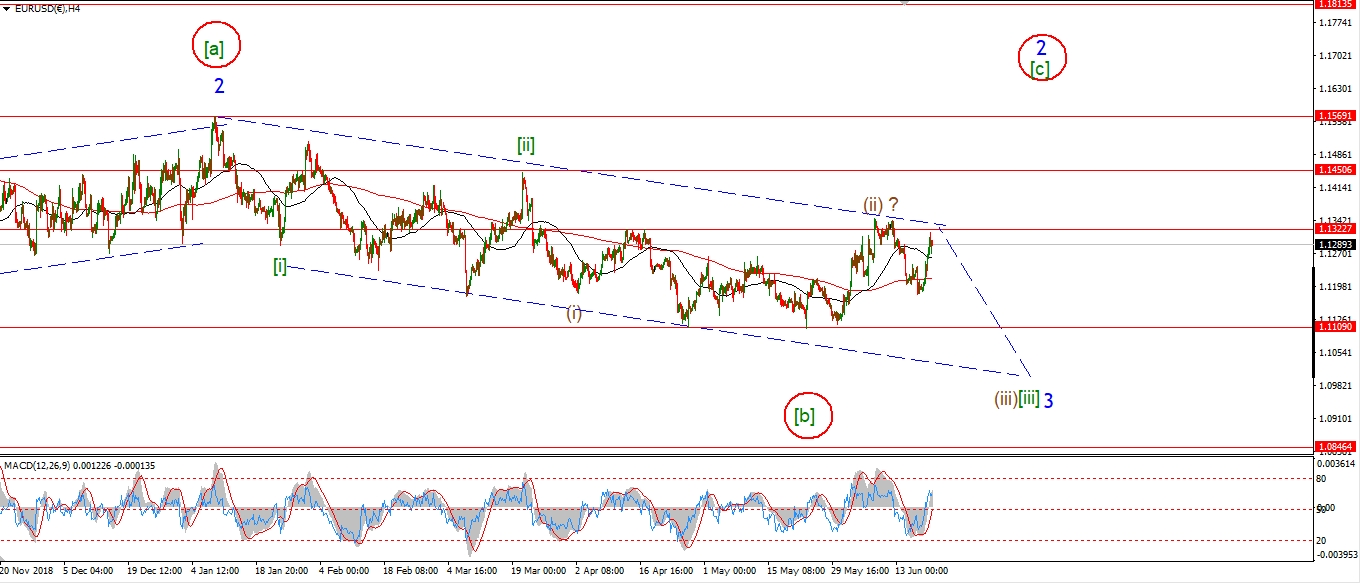 [/vc_column_text][vc_custom_heading text=”Daily” use_theme_fonts=”yes”][vc_column_text]
 [/vc_column_text][/vc_column][/vc_row]
[vc_row][vc_column][vc_column_text]
EURUSD did not break support as I had hoped today,
but this does not rule out the current bearish count by any means.
I expect this rally will be a corrective one,
and it should fail below 1.1412.
The rally today is viewed as wave ‘a’ of (ii).
Wave ‘b’ and ‘c’ should complete a three wave correction over the coming days.
And when that happens,
we will have a bearish signal in place off the wave ‘2’ high.
Tomorrow;
watch for wave (ii) to continue higher in three waves.
1.1412 must hold.
[/vc_column_text][/vc_column][/vc_row]
[vc_row][vc_column][vc_separator border_width=”5″][/vc_column][/vc_row][vc_row][vc_column][vc_column_text]
GBPUSD
[/vc_column_text][/vc_column][/vc_row][vc_row][vc_column][vc_separator border_width=”5″][/vc_column][/vc_row][vc_row][vc_column width=”2/3″][vc_custom_heading text=”1 hr” use_theme_fonts=”yes”][vc_column_text]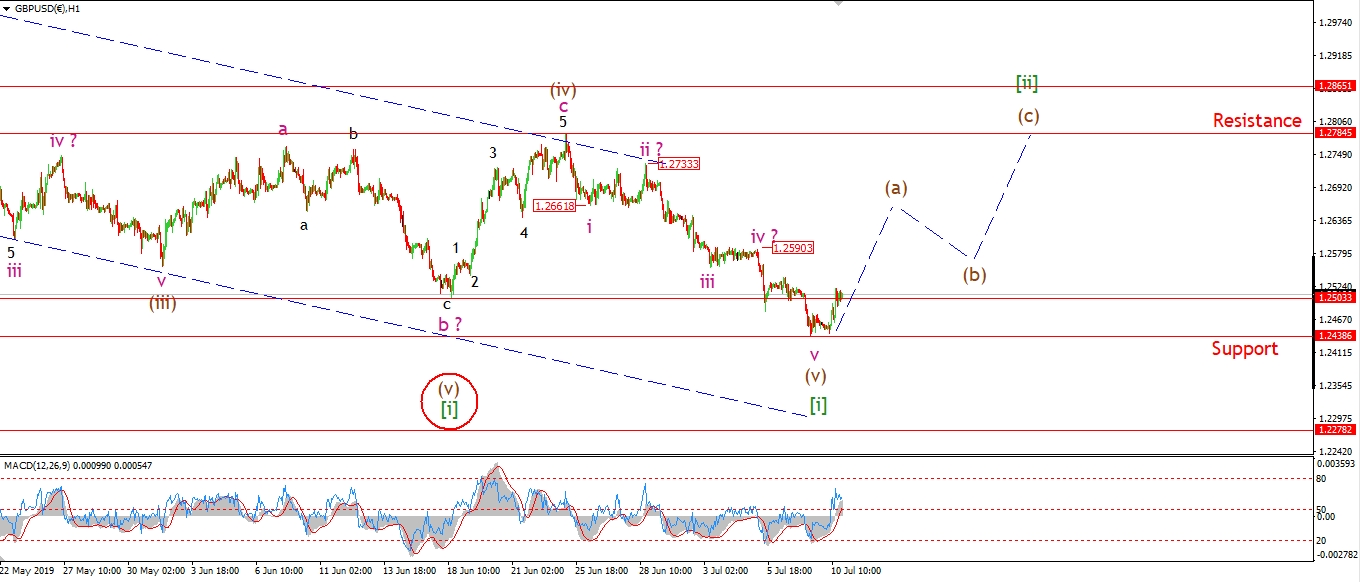 [/vc_column_text][/vc_column][vc_column width=”1/3″][vc_custom_heading text=”4 Hours” use_theme_fonts=”yes”][vc_column_text]
 [/vc_column_text][vc_custom_heading text=”Daily” use_theme_fonts=”yes”][vc_column_text]
 [/vc_column_text][/vc_column][/vc_row]
[vc_row][vc_column][vc_column_text]
I thought we might get another push lower today but,
Tuesdays low has formed the bottom for wave [i] green now.
It’s time to look higher in wave [ii] now,
with the initial target for wave [ii] at the previous fourth wave of 1.2784.
Today’s rise is viewed as the beginning of wave (a) of [ii].
And this should break 1.2590 at a minimum.
Tomorrow;
watch for wave (a) to continue higher for the rest of the week.
Wave (b) should form a higher low above 1.2438.
[/vc_column_text][/vc_column][/vc_row]
[vc_row][vc_column][vc_separator border_width=”5″][/vc_column][/vc_row][vc_row][vc_column][vc_column_text]
USDJPY
[/vc_column_text][/vc_column][/vc_row][vc_row][vc_column][vc_separator border_width=”5″][/vc_column][/vc_row][vc_row][vc_column width=”2/3″][vc_custom_heading text=”1 hr” use_theme_fonts=”yes”][vc_column_text]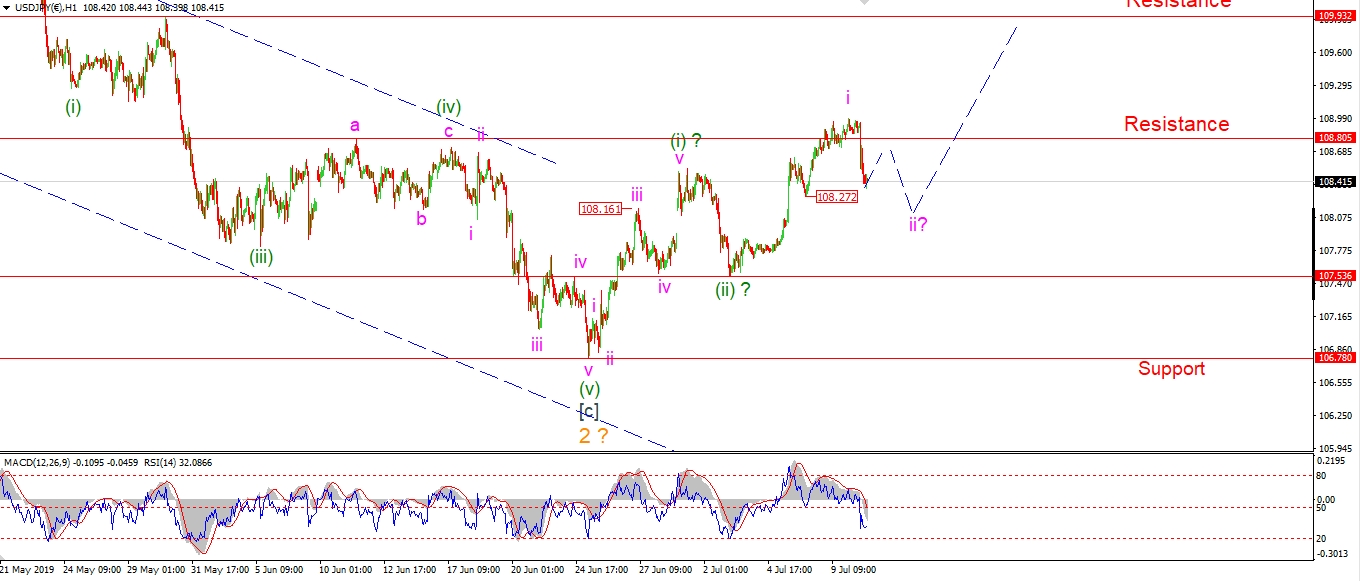 [/vc_column_text][/vc_column][vc_column width=”1/3″][vc_custom_heading text=”4 Hours” use_theme_fonts=”yes”][vc_column_text]
 [/vc_column_text][vc_custom_heading text=”Daily” use_theme_fonts=”yes”][vc_column_text]
 [/vc_column_text][/vc_column][/vc_row]
[vc_row][vc_column][vc_column_text]
USDJPY is now declining off the wave ‘i’ high in wave ‘ii’ pink.
The market broke lower sharply today,
but this should prove to be wave ‘a’ of a three wave correction.
And wave ‘ii’ should complete above 107.53 early next week.
tomorrow;
Watch for wave ‘ii’ to continue lower in a three wave form to create a bullish higher low above 107.53.
[/vc_column_text][/vc_column][/vc_row]
[vc_row][vc_column][vc_separator border_width=”5″][/vc_column][/vc_row][vc_row][vc_column][vc_column_text]
DOW JONES INDUSTRIALS
[/vc_column_text][/vc_column][/vc_row][vc_row][vc_column][vc_separator border_width=”5″][/vc_column][/vc_row][vc_row][vc_column width=”2/3″][vc_custom_heading text=”1 hr” use_theme_fonts=”yes”][vc_column_text]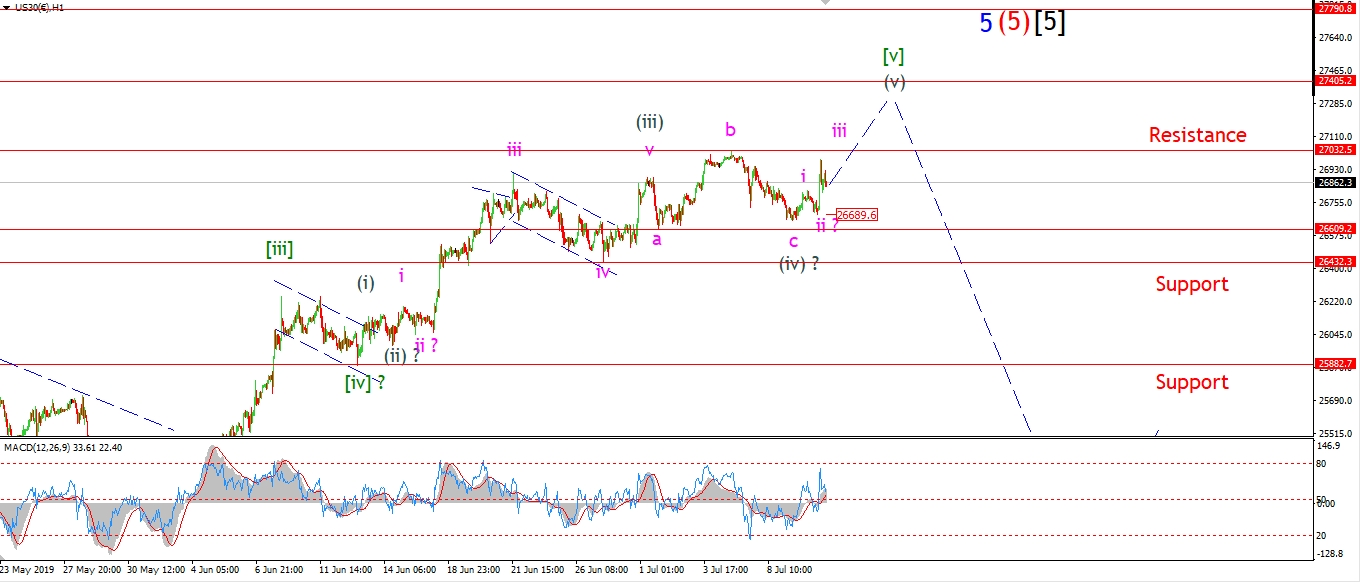 [/vc_column_text][/vc_column][vc_column width=”1/3″][vc_custom_heading text=”4 Hours” use_theme_fonts=”yes”][vc_column_text]
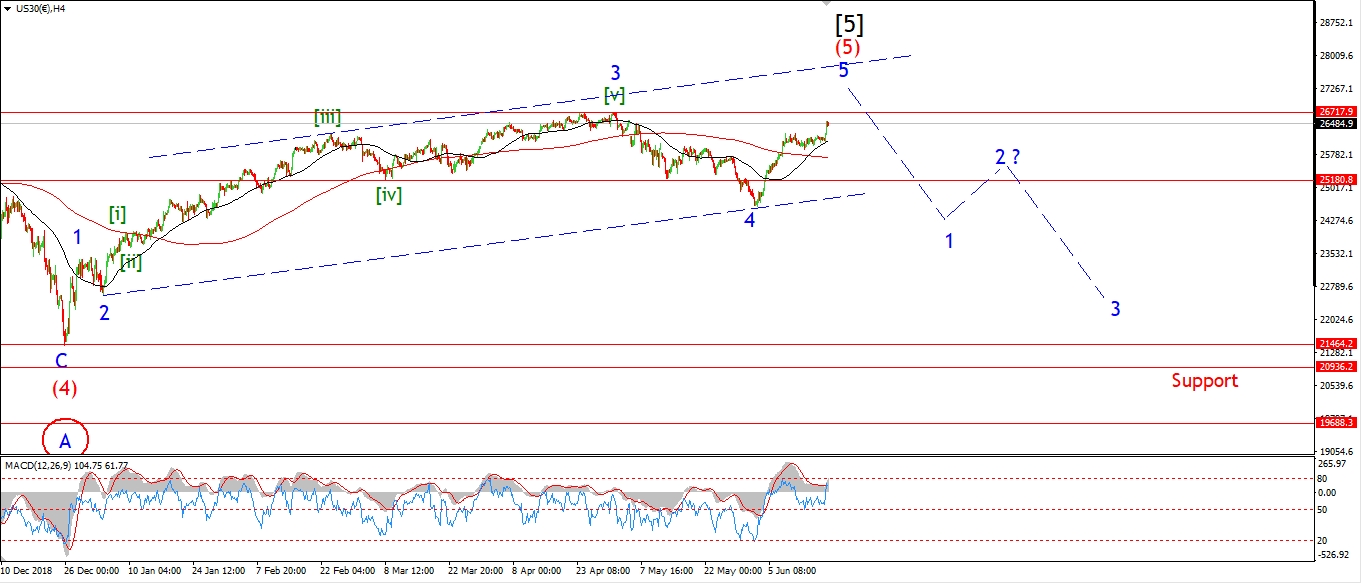 [/vc_column_text][vc_custom_heading text=”Daily” use_theme_fonts=”yes”][vc_column_text]
 [/vc_column_text][/vc_column][/vc_row]
[vc_row][vc_column][vc_column_text]
The Dow shot higher today and retraced most of the decline in wave (iv).
this is a good sign that wave (v) is now underway.
The market is off again this evening,
but I suspect that the low at wave (iv) will hold for now.
I have labelled the rise off wave (iv) as waves ‘i’ and ‘ii’,
with todays rally as wave ‘iii’ of (v).
Tomorrow;
Watch for wave ‘iii’ to continue higher and create another new all time high above 27000.
This rally is in its final stages no matter how I look at it.
So we should see an end to it next week some time.
For now we are clear to push higher in wave (v) as long as 26690 holds.
[/vc_column_text][/vc_column][/vc_row]
[vc_row][vc_column][vc_separator border_width=”5″][/vc_column][/vc_row][vc_row][vc_column][vc_column_text]
GOLD
[/vc_column_text][/vc_column][/vc_row][vc_row][vc_column][vc_separator border_width=”5″][/vc_column][/vc_row][vc_row][vc_column width=”2/3″][vc_custom_heading text=”1 hr” use_theme_fonts=”yes”][vc_column_text]
 [/vc_column_text][/vc_column][vc_column width=”1/3″][vc_custom_heading text=”4 Hours” use_theme_fonts=”yes”][vc_column_text]
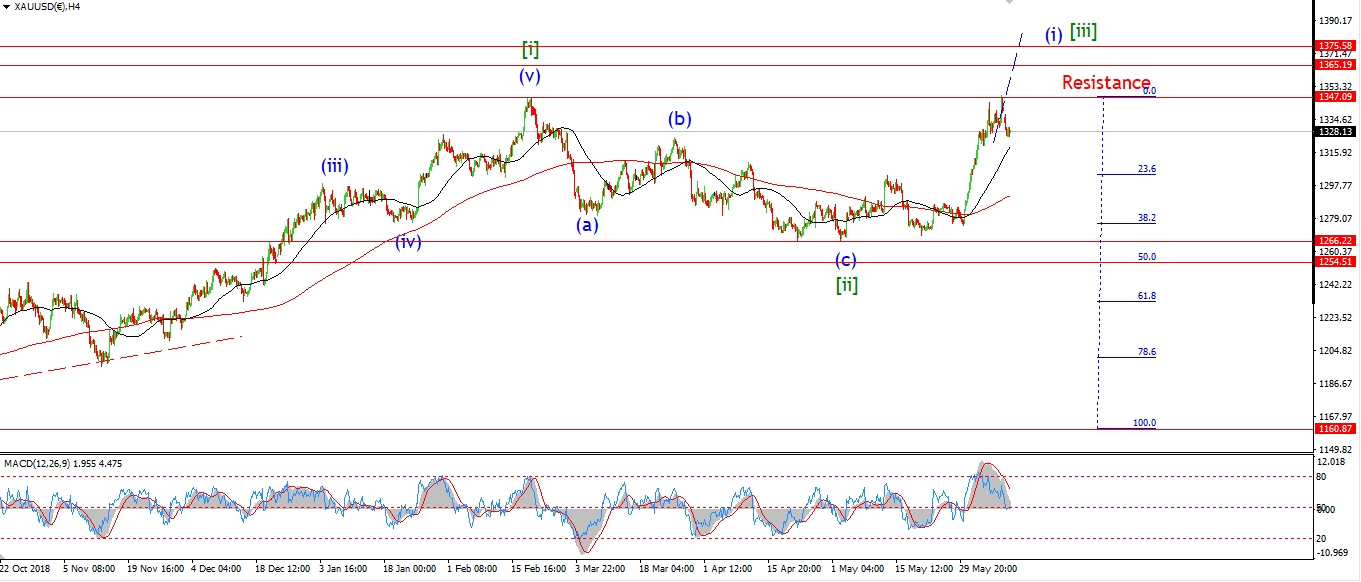 [/vc_column_text][vc_custom_heading text=”Daily” use_theme_fonts=”yes”][vc_column_text]
 [/vc_column_text][/vc_column][/vc_row]
[vc_row][vc_column][vc_column_text]
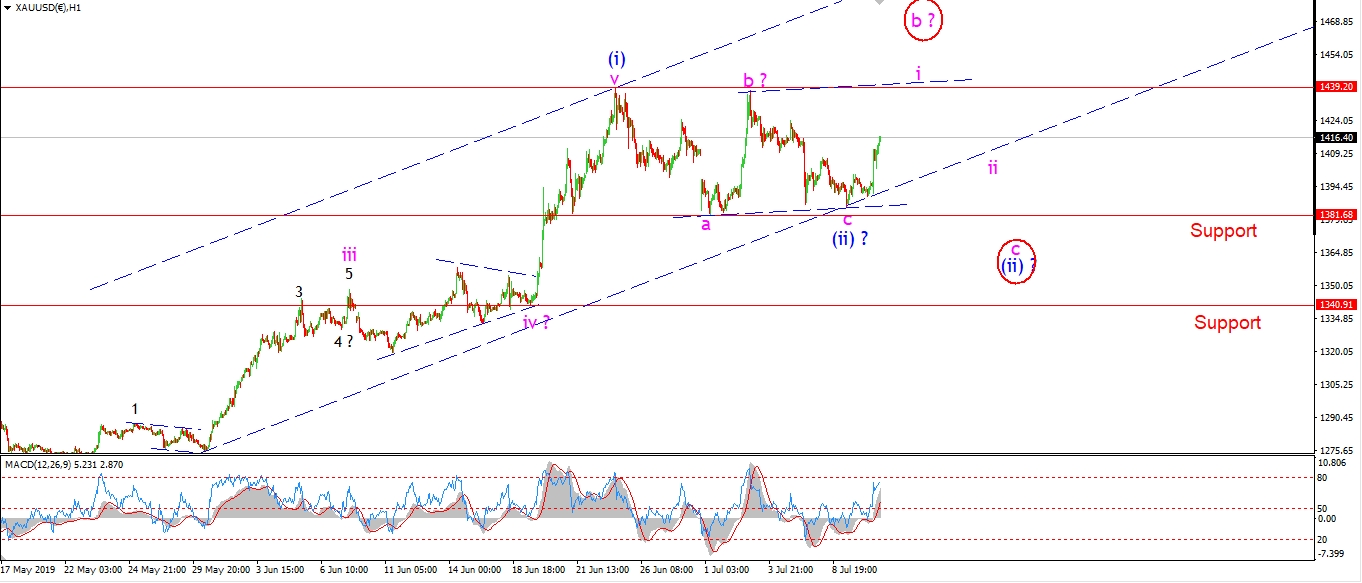
Gold did not break the wave ‘a’ low at 1381 as suggested.
This raises a few options for the current action.
Todays rally is labelled wave ‘i’ of (iii),
In that case we should continue to rally from here and create a bullish signal off wave (ii) to begin wave (iii).
I have shown an alternate count which views this rally as wave ‘b’ of (ii).
This does allow for a rally to a slight new high above 1439,
and then a final decline in wave ‘c’ of (ii).
Tomorrow;
It’s one of those, ‘it could go up but it might go down’ moments for gold.
If we reach a new high in five waves followed by a clear correction in wave ‘ii’,
that will rule out the alternate count.
[/vc_column_text][/vc_column][/vc_row]
[vc_row][vc_column][vc_separator border_width=”5″][/vc_column][/vc_row][vc_row][vc_column][vc_column_text]
U.S CRUDE OIL
[/vc_column_text][/vc_column][/vc_row][vc_row][vc_column][vc_separator border_width=”5″][/vc_column][/vc_row][vc_row][vc_column width=”2/3″][vc_custom_heading text=”1 hr” use_theme_fonts=”yes”][vc_column_text]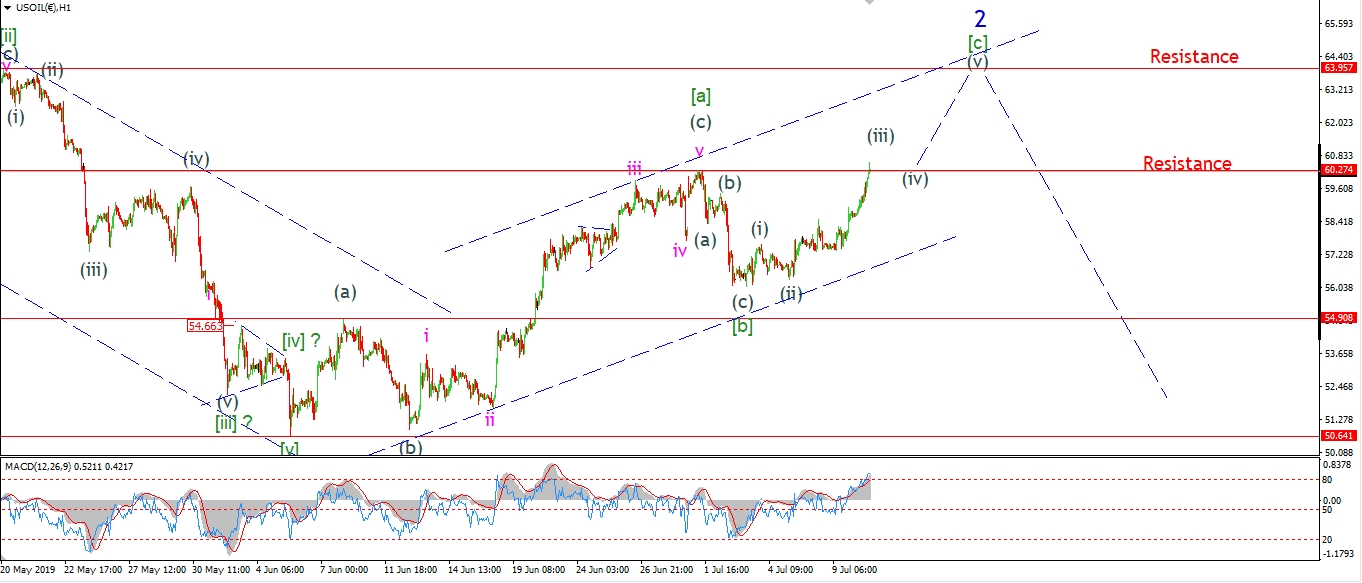 [/vc_column_text][/vc_column][vc_column width=”1/3″][vc_custom_heading text=”4 Hours” use_theme_fonts=”yes”][vc_column_text]
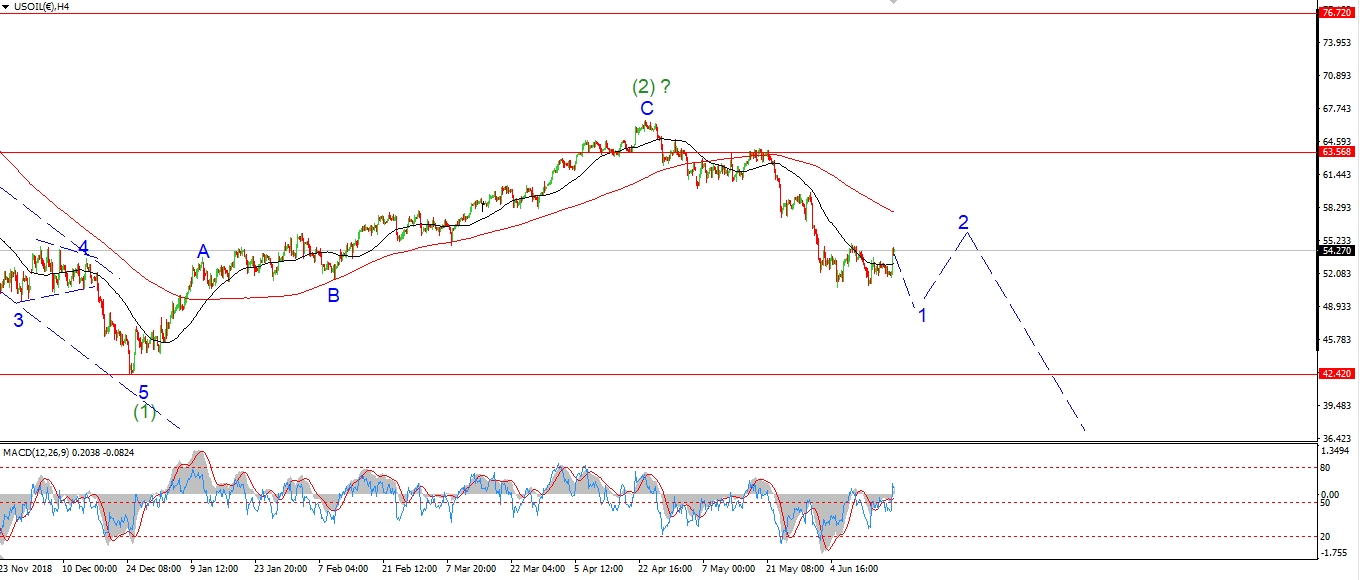 [/vc_column_text][vc_custom_heading text=”Daily” use_theme_fonts=”yes”][vc_column_text]
 [/vc_column_text][/vc_column][/vc_row]
[vc_row][vc_column][vc_column_text]
Crude is on a tear today which has ruled out the previous count for wave [b].
Todays break to a new high is now labelled as the final run up in wave [c].
The rally in wave [c] came sooner than expected.
We should see a five wave rally from here in wave [c] as shown,
and resistance at 63.95 should be enough to put a stop to wave [c].
Tomorrow;
watch for wave (iii) of [c] to hit about 61.50 before correcting in wave (iv).
[/vc_column_text][/vc_column][/vc_row]
[vc_row][vc_column][vc_separator border_width=”5″][/vc_column][/vc_row][vc_row][vc_column][vc_column_text]
US 10 yr Treasuries.
[/vc_column_text][/vc_column][/vc_row][vc_row][vc_column][vc_separator border_width=”5″][/vc_column][/vc_row][vc_row][vc_column width=”2/3″][vc_custom_heading text=”1 hr” use_theme_fonts=”yes”][vc_column_text]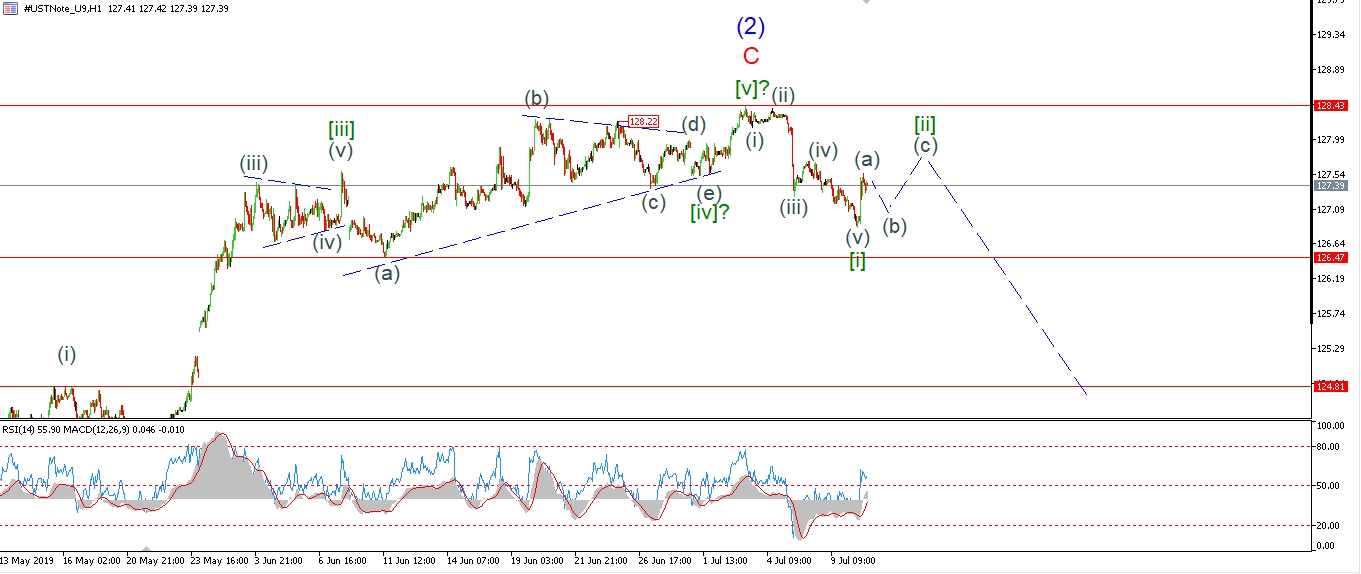 [/vc_column_text][/vc_column][vc_column width=”1/3″][vc_custom_heading text=”4 Hours” use_theme_fonts=”yes”][vc_column_text]
 [/vc_column_text][vc_custom_heading text=”Daily” use_theme_fonts=”yes”][vc_column_text]
 [/vc_column_text][/vc_column][/vc_row]
[vc_row][vc_column][vc_column_text]
The 10YR is rallying also today,
but this should prove corrective in wave [ii] green.
Wave [ii] must complete below 128.43 in three wave form.
And then price should continue lower again to begin wave [iii] down.
For now,
wave [ii] should correct higher for the rest of the week.
Tomorrow;
watch for wave (b) to drop again tomorrow,
before rising again in wave (c) to complete the pattern.
If this count is correct,
then next week should bring a large selloff in the 10YR.
[/vc_column_text][/vc_column][/vc_row]
[vc_row][vc_column][vc_separator border_width=”5″][/vc_column][/vc_row][vc_row][vc_column][vc_column_text]
SILVER
[/vc_column_text][/vc_column][/vc_row][vc_row][vc_column][vc_separator border_width=”5″][/vc_column][/vc_row][vc_row][vc_column width=”2/3″][vc_custom_heading text=”1 hr” use_theme_fonts=”yes”][vc_column_text]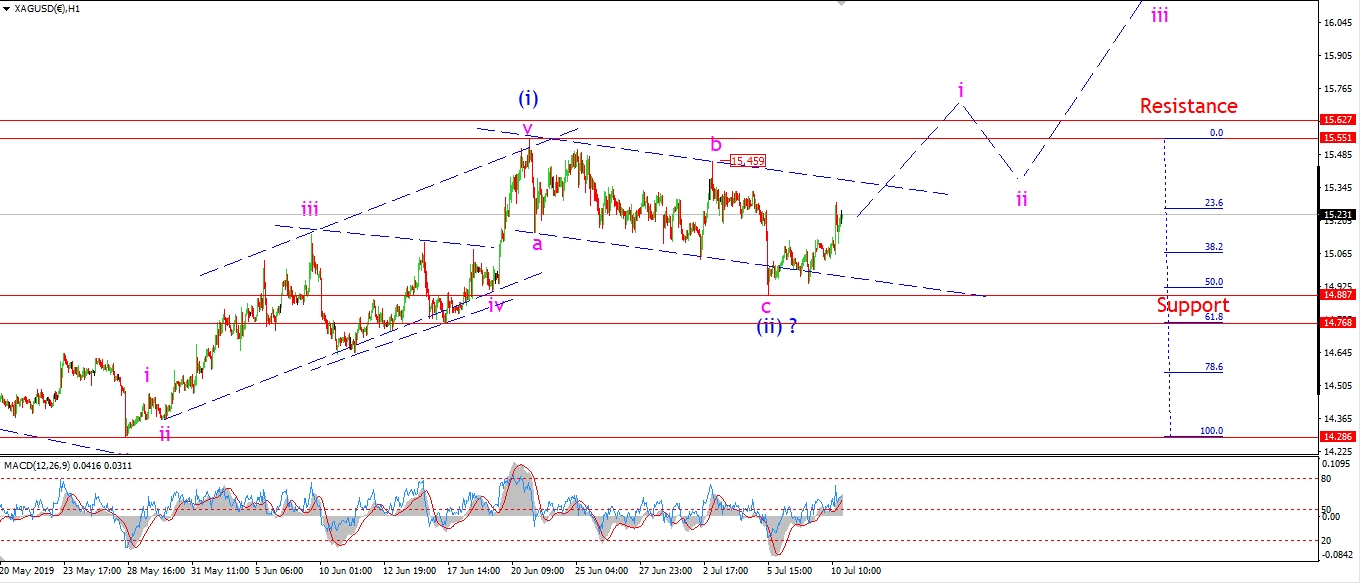 [/vc_column_text][/vc_column][vc_column width=”1/3″][vc_custom_heading text=”4 Hours” use_theme_fonts=”yes”][vc_column_text]
 [/vc_column_text][vc_custom_heading text=”Daily” use_theme_fonts=”yes”][vc_column_text]
 [/vc_column_text][/vc_column][/vc_row]
[vc_row][vc_column][vc_column_text]
Todays rise in silver is not a clearly bullish as the pattern in Gold.
The market is pushing higher out of a three wave correction though,
so I will take this as a bullish sign until proved otherwise!
If we see a break of 15.45 over the coming days,
this will lean in favor of the bullish outlook for wave (iii) to begin.
Tomorrow;
Watch for wave ‘i’ to push above 15.45 to strengthen the bullish case.
[/vc_column_text][/vc_column][/vc_row]
[vc_row][vc_column][vc_separator border_width=”5″][/vc_column][/vc_row][vc_row][vc_column][vc_column_text]
S&P 500.
[/vc_column_text][/vc_column][/vc_row][vc_row][vc_column][vc_separator border_width=”5″][/vc_column][/vc_row][vc_row][vc_column width=”2/3″][vc_custom_heading text=”1 hr” use_theme_fonts=”yes”][vc_column_text]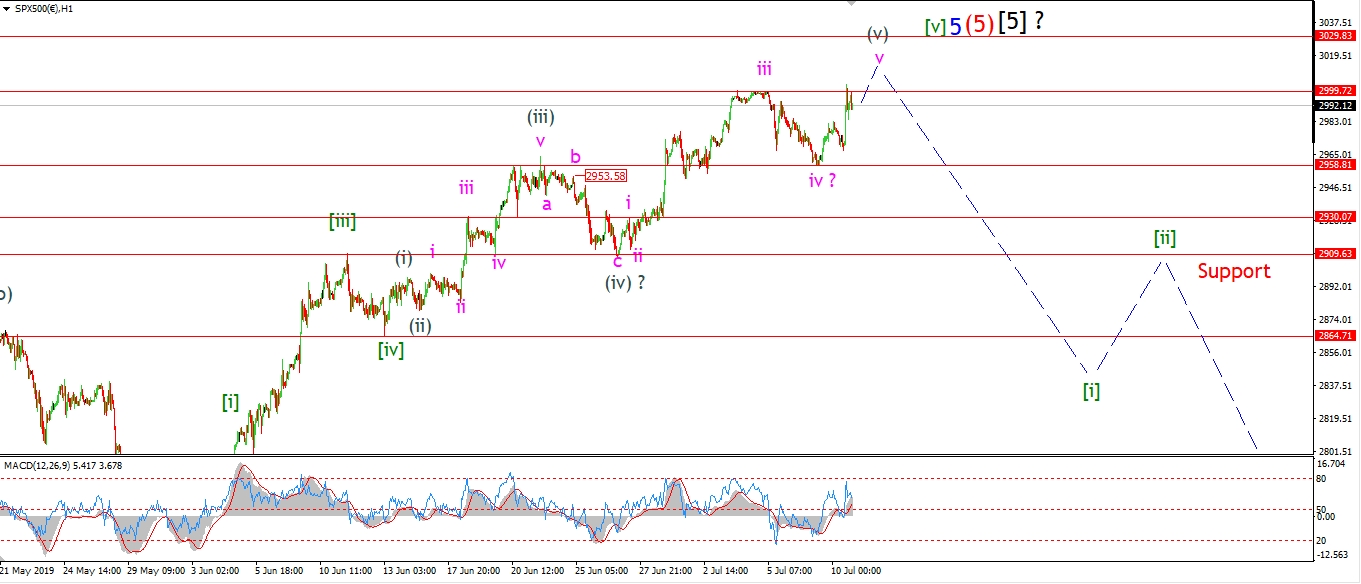 [/vc_column_text][/vc_column][vc_column width=”1/3″][vc_custom_heading text=”4 Hours” use_theme_fonts=”yes”][vc_column_text]
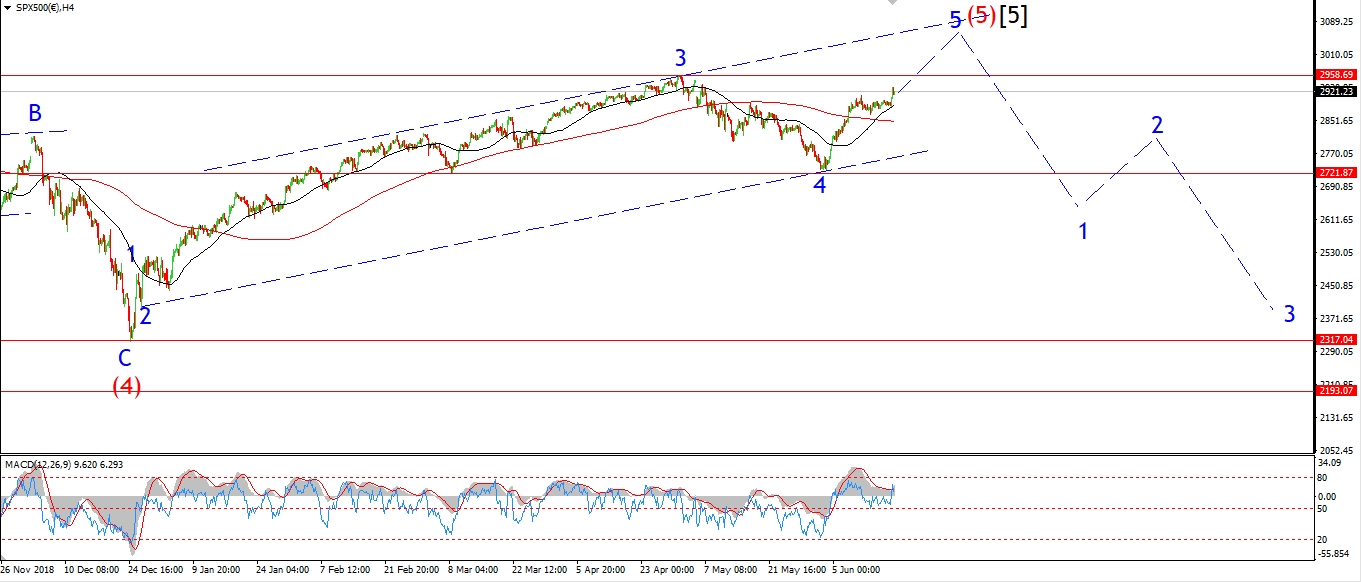 [/vc_column_text][vc_custom_heading text=”Daily” use_theme_fonts=”yes”][vc_column_text]
 [/vc_column_text][/vc_column][/vc_row]
[vc_row][vc_column][vc_column_text]
The S&P did hit a new high today to finally break that all important 3000 level.
Now that the big psychological level has been reached,
we are now in real danger of tripping over our euphoria,
and dropping into a new bear market in short order.
So far the price has corrected sideways off todays highs.
This could be a small fourth wave correction in wave ‘v’.
And another rally should be expected in wave ‘v’
to create a five wave internal pattern to cap off the rally nicely.
Tomorrow;
Watch for wave ‘v’ to continue higher above 3000 again.
a break of 2960 again will rule out the current wave count.
[/vc_column_text][/vc_column][/vc_row]
[vc_row][vc_column][vc_separator border_width=”5″][/vc_column][/vc_row]