
Good evening folks,
Welcome back to the new week.
EURUSD.
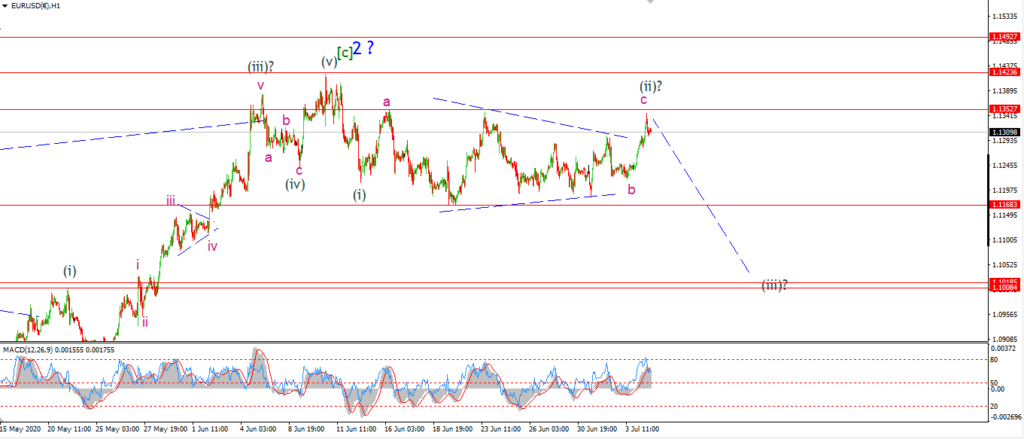
EURUSD 1hr.
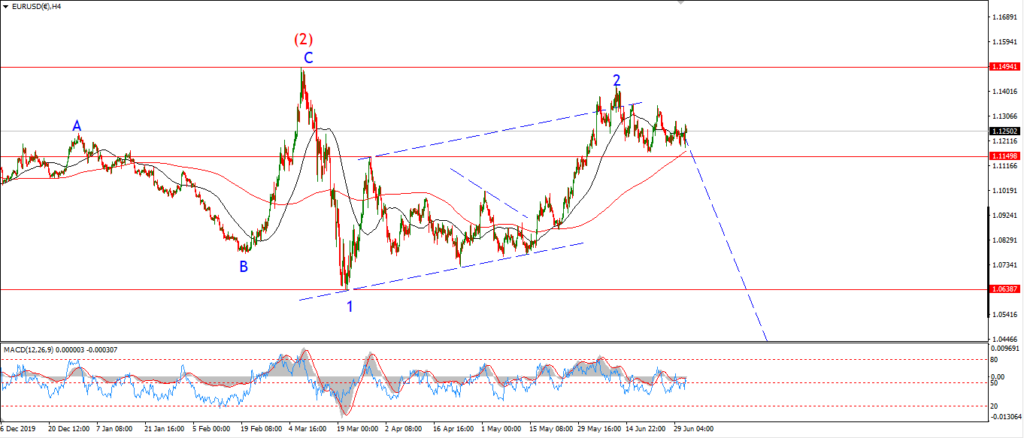
EURUSD 4hr.
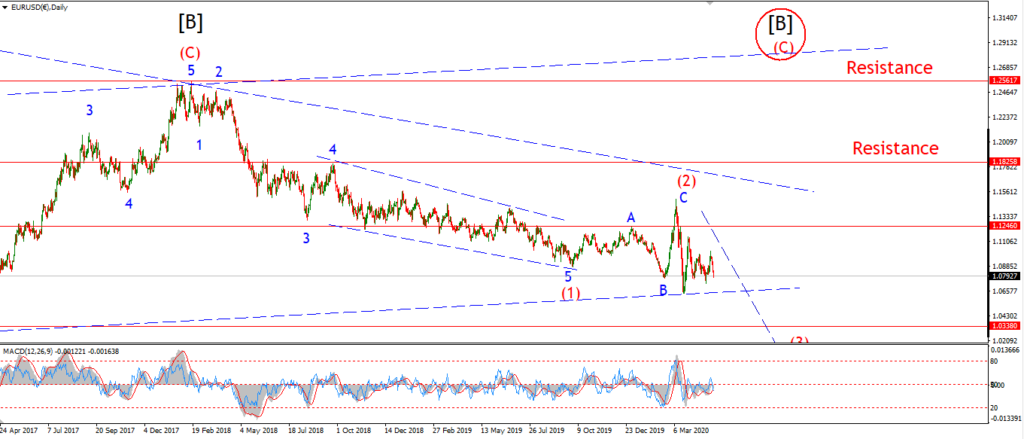
EURUSD daily.
EURUSD has been a strange pair to watch over the last few weeks.
the market continues to grind sideways without any clear move to the the downside again.
With this in mind,
I am looking again at the daily chart to get some context.
The daily chart shows two alternates for that larger wave [B] in black.
the correction in wave [B] can be tracing out either a larger Flat correction as shown within the red triangle.
OR,
wave [B] can be tracing out a triangle as per the count circled in red.
The triangle wave [B] count will allow for another high to be created in wave (C) red.
And then a further set of higher lows and lower high to complete waves (D) and (E).
If the current rally breaks above 1.1494,
that will trigger the triangle wave count.
Tomorrow;
The short term count shows a possible complex flat correction in play.
The price must accelerate lower to stick with this bearish outlook.
GBPUSD
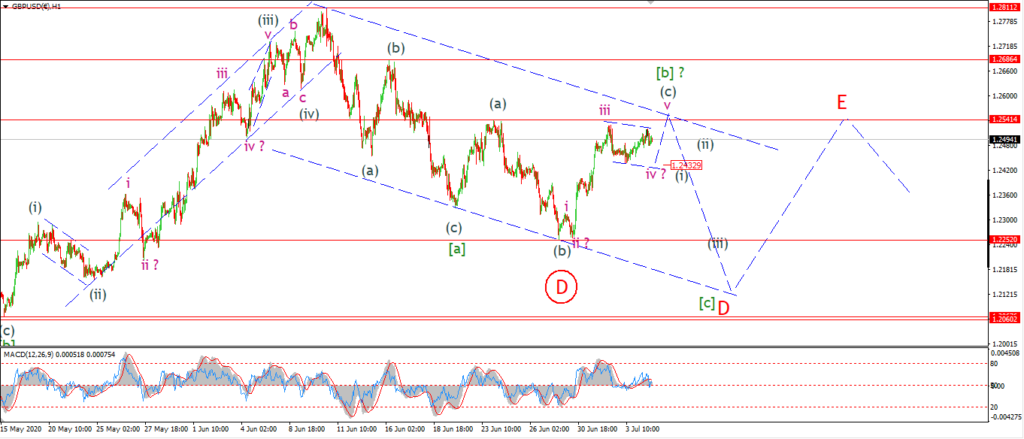
GBPUSD 1hr.
GBPUSD 4hr.

GBPUSD daily.
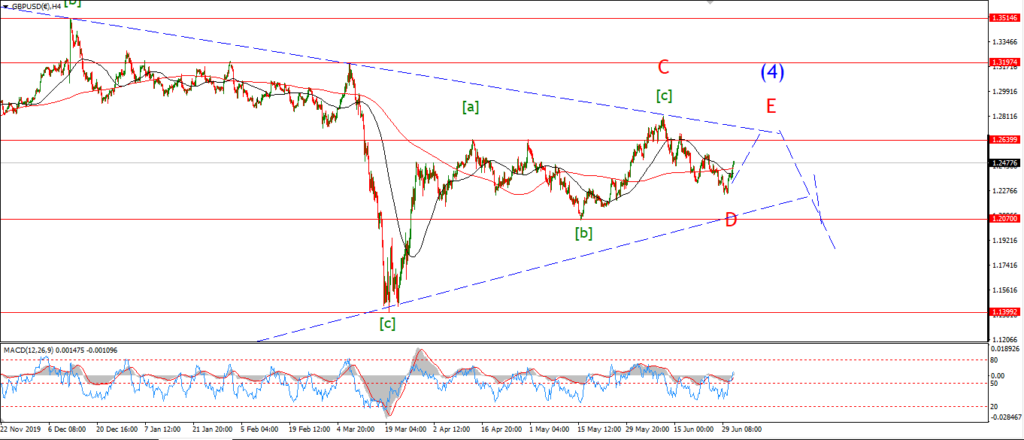
Todays trade was in now way impulsive to the downside.
The action seems to be still moving within wave (c) of [b].
There seems to be a three wave flat correction underway at the moment.
This can be viewed as wave ‘iv’ of (c).
With one last push higher in wave ‘v’ left to complete wave (c).
Tomorrow;
Wave ‘iv’ should complete with a drop back into 1.2430 again.
And then wave ‘v’ will rally above 1.2540 to complete wave (c).
USDJPY.
USDJPY 1hr.
USDJPY 1hr.
USDJPY daily.
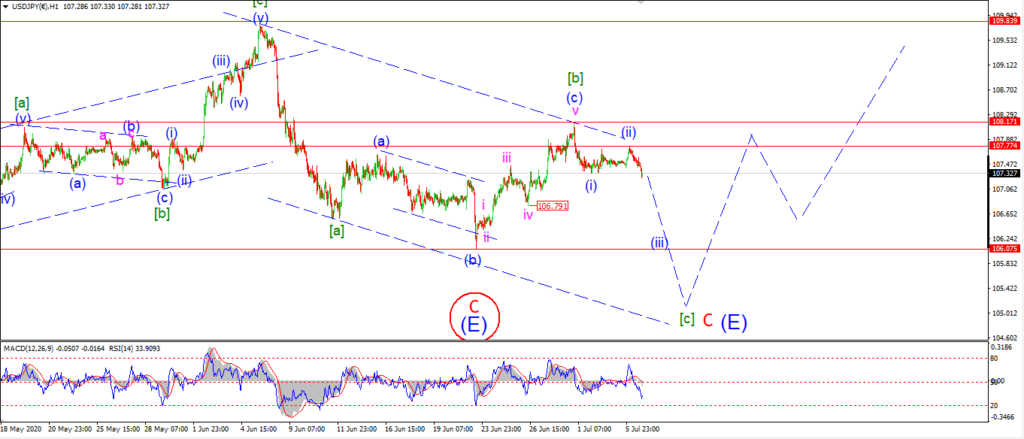
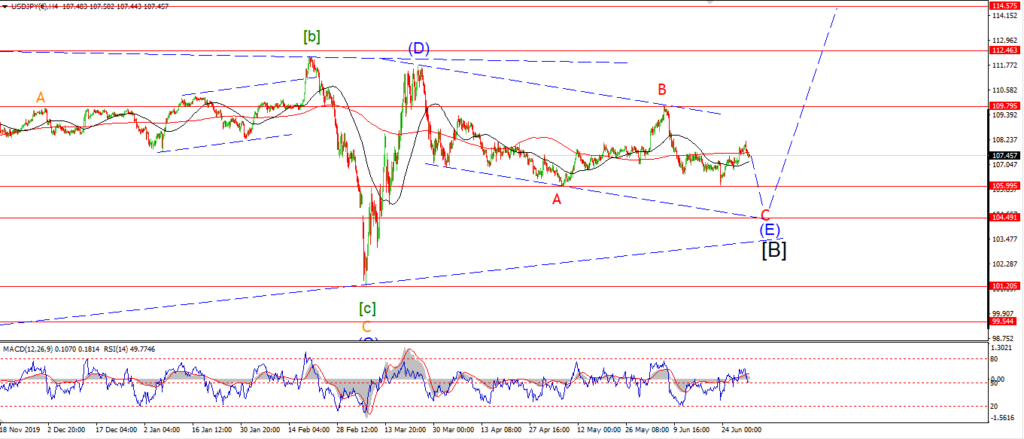
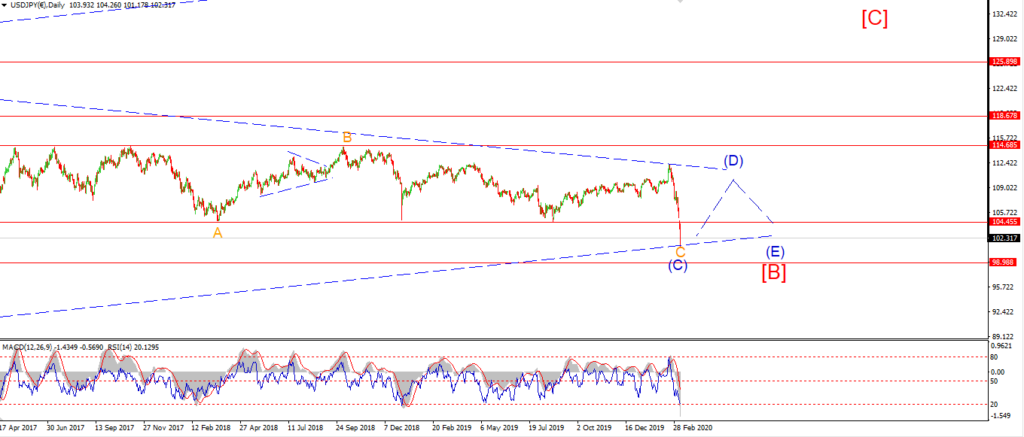
The overnight trad in USDJPY should tell us alot about how this short term count is going to pan out.
The price has completed a three wave rise into the early high today.
This action is labelled wave (ii) of [c].
Wave (iii) of [c] is now expected to fall back into the 106.00 area again over the next few days.
If the price fails to fall sharply tomorrow,
that will favor the alternate count as shown circled in red.
Tomorrow;
Watch for wave (iii) blue to drop in five waves into 106.00.
The wave (ii) high at 107.77 must hold from now on.
DOW JONES.
DOW 1hr.
DOW 4hr
DOW daily.
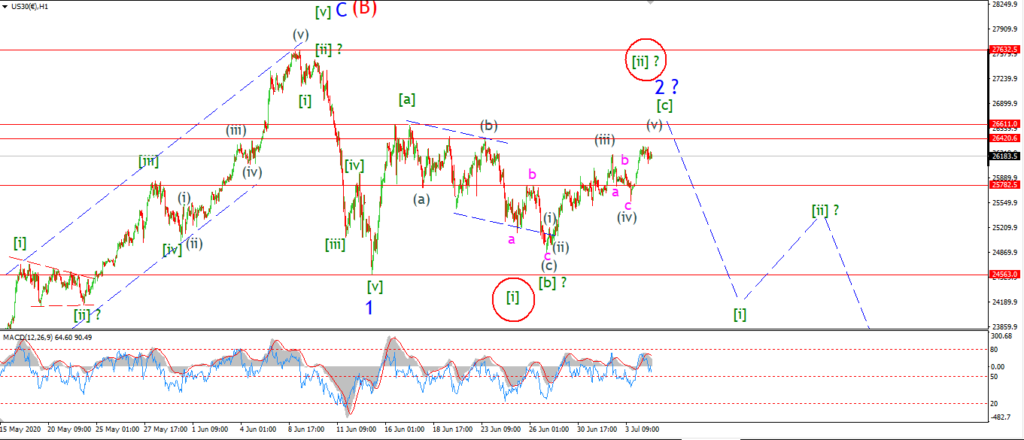
I have switched to the alternate short term count this evening after a gap to the upside this morning.
The DOW has not broken to a new wave ‘2’ high just yet,
but wave [c] should do that by tomorrow evening to cap off a complex zigzag correction.
The market was flat for the rest of the session after that initial bounce.
which is interesting given that this is one of the lowest volume days in the whole rally off the March lows.
Low volume
in a final wave [c] move
within a lower high wave ‘2’?
It is nearly exactly what you might expect if everyone was already bought into the narrative.
Tomorrow;
Watch for wave (v) of [c] to break 26611 to top out in wave ‘2’ blue.
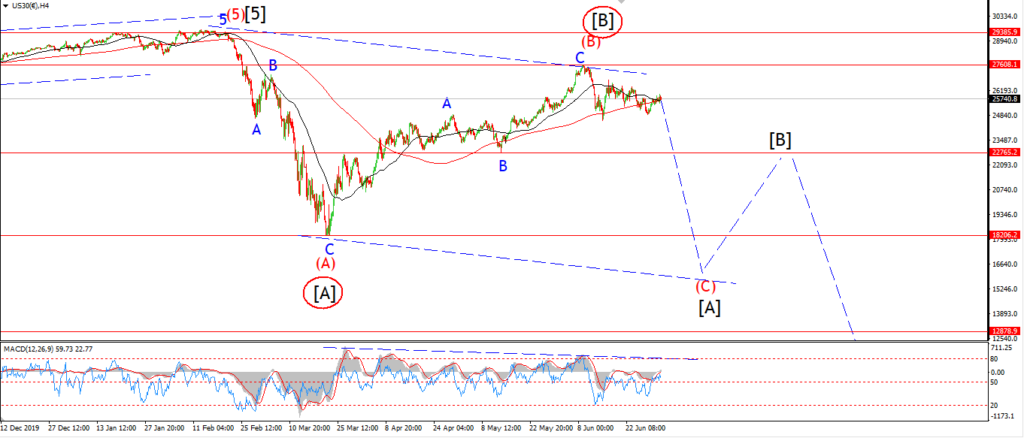
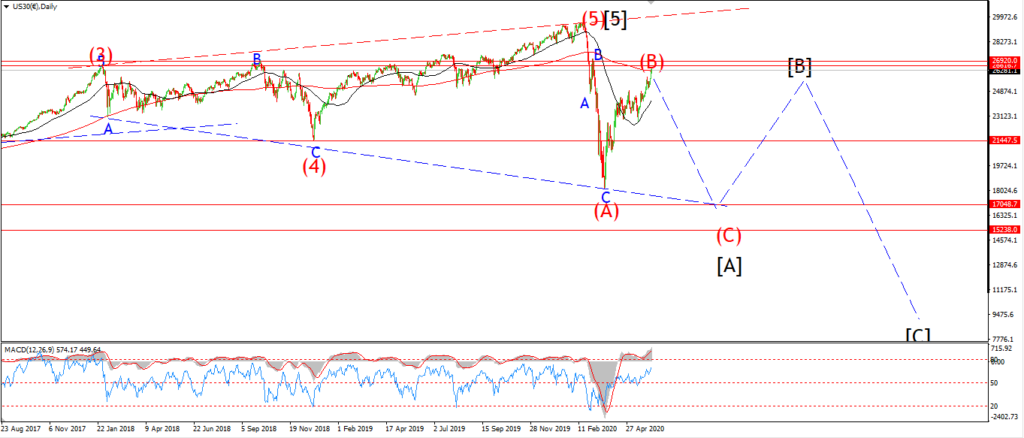
The overall idea for a decline into a third wave remains intact.
A sharp declin is expected to begin this week in wave [i] of ‘3’.
GOLD
GOLD 1hr.
GOLD 4hr.
GOLD daily.
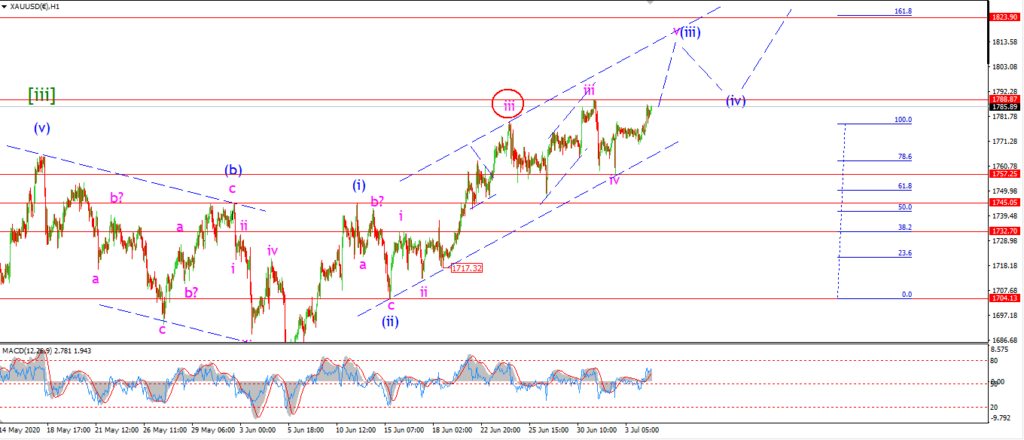
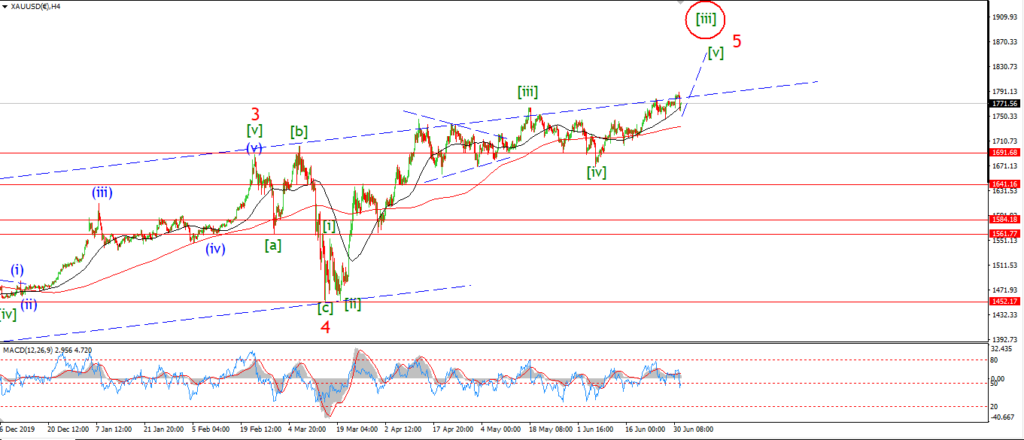
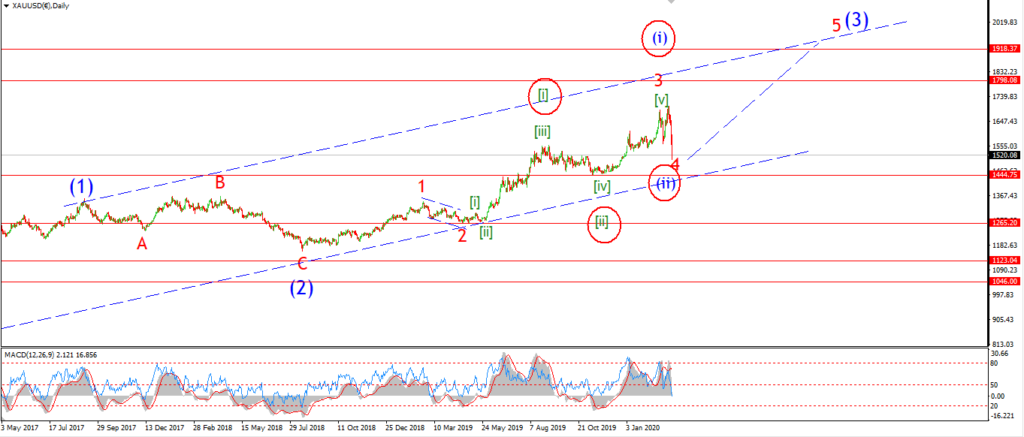
The price is inching higher today as we move towards a top in wave ‘v’ of (iii) this week.
Ideally I am looking at the upper trend channel line at about 1810 to complete this rally.
And once we complete wave (iii) up,
that should lead to another corrective phase in wave (iv) of [v] beginning next week most likely.
The minimum target for wave lies at 1789.
But a five wave rally in wave ‘v’ should push higher than that.
Tomorrow;
Watch for wave ‘v’ of (iii) to continue up towards that upper trend line this week.
The low at 1757 must hold.
CRUDE OIL.
CRUDE OIL 1hr.
CRUDE OIL 4hr.
CRUDE OIL daily.
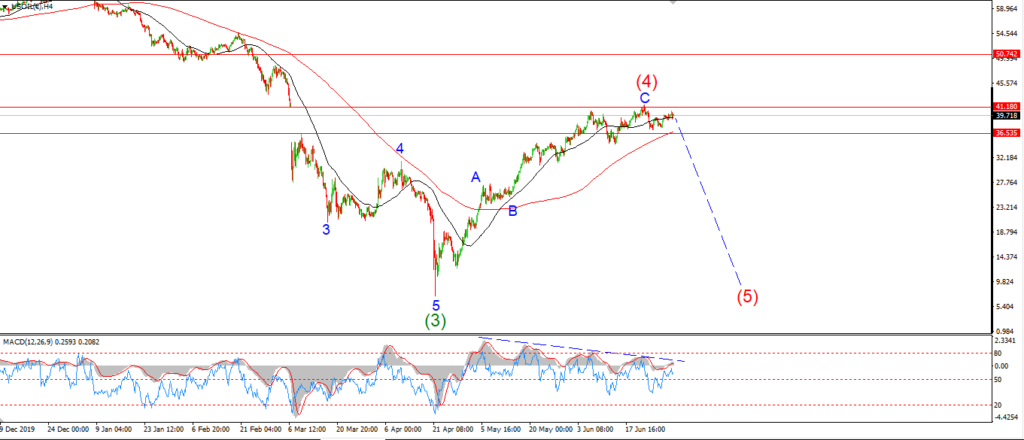
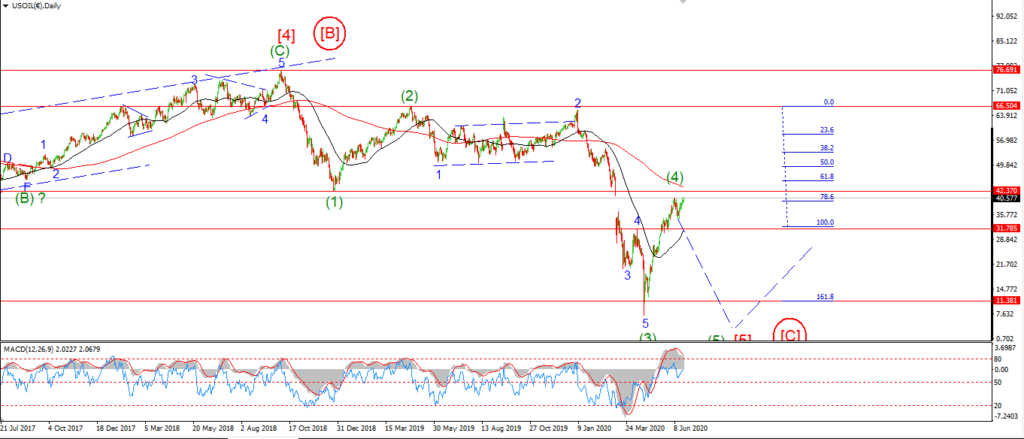
Crude is hanging on by a thread these days.
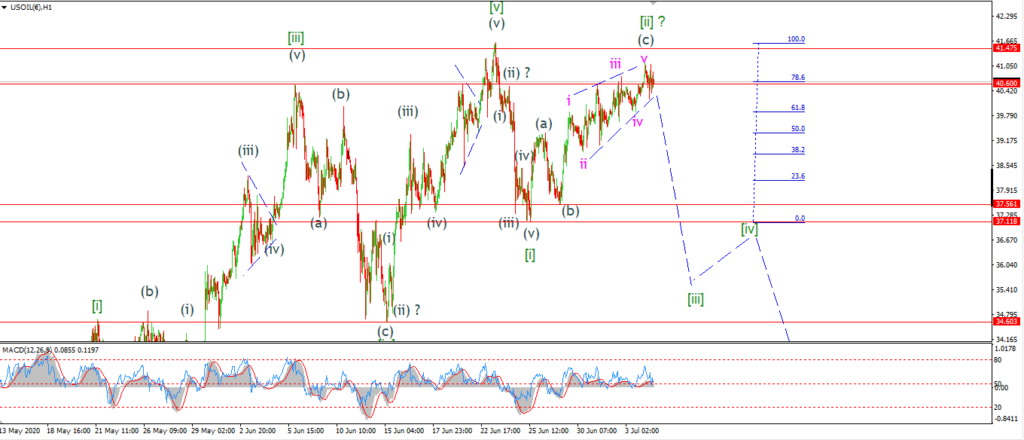
The wave [ii] high has reached higher than I expected thats for sure.
But the action over the last week has been nothing but corrective in my opinion.
Each new high has been hard fought for,
with a continual grinding and overlapping internal structure.
This is not the stuff of a new bullish trend move right now.
The clearest pattern over the last month,
came with the decline in five waves off the June 23rd high.
This action still suggests that the main force is to the downside.
So I will stick with the idea that wave [iii] down is coming unless we see a break of that June high again.
Tomorrow;
Watch for wave (i) of [iii] to begin tomorrow.
An initial five wave decline off the high will indicate that wave (i) of [iii] has begun.
S&P 500.
S&P 500 1hr
S&P 500 4hr
S&P 500 daily.
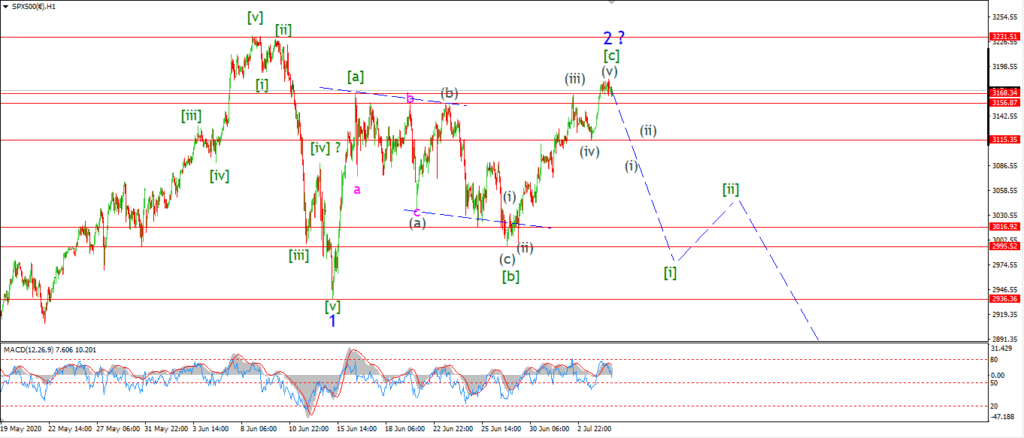
Todays move higher can still be viewed within the context of a completing five wave rally in wave [c].
The market has traced out a five wave rally within wave [c] now.
complete with an internal extension in wave (iii) of [c].
Wave [c] has now made a clear new high above wave [a].
And last Fridays lows at 3115 marks the low of wave (iv) of [c].
And this level becomes the initial support that should break when the market moves lower again.
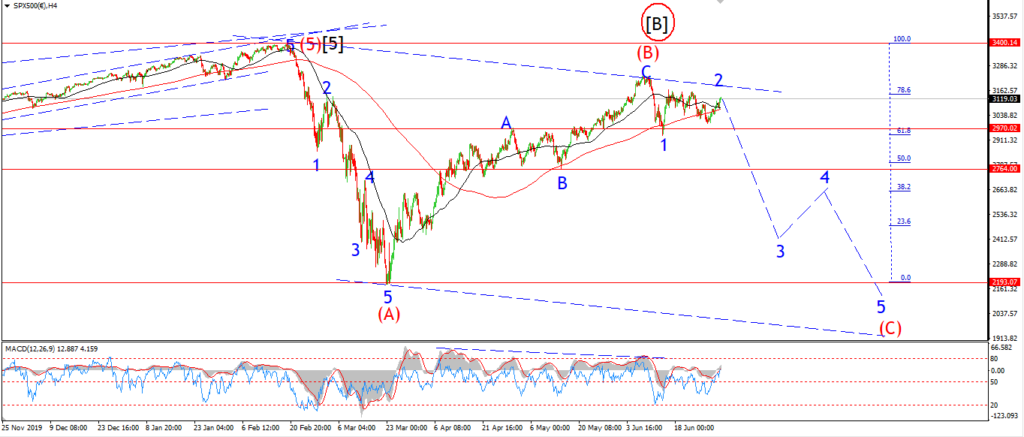
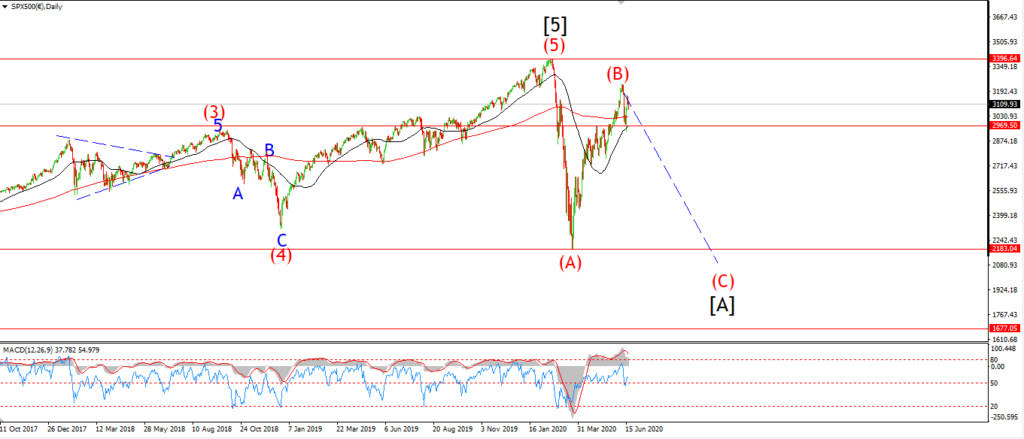
Overall we have a five wave decline in wave ‘1’,
and a larger three wave correction higher in wave ‘2’ blue.
And again,
todays trade is the lowest volume day in over 6mths.
The market needs to fall this week in order to confirm this bearish pattern.
Tomorrow;
Watch for wave (i) of [i] to break 3115 again.
SILVER.
SILVER 1hr
SILVER 4hr.
SILVER daily.
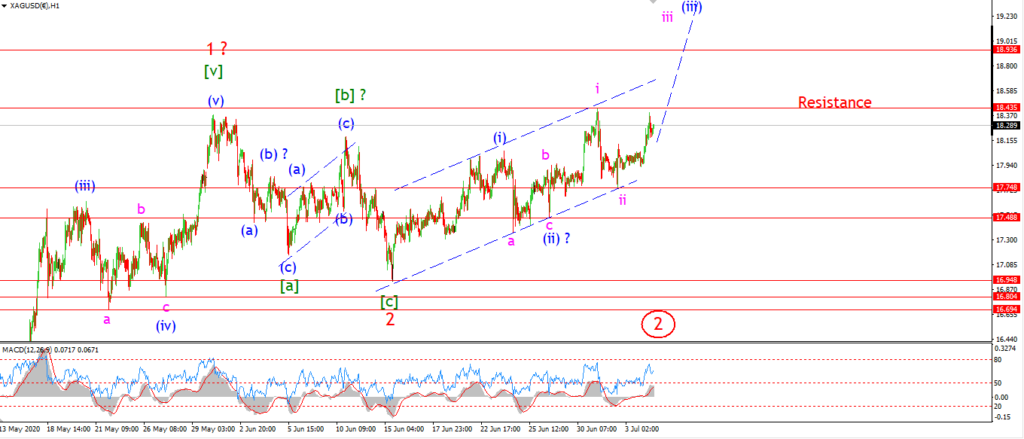
Silver has so far failed to break out above the wave ‘i’ high at 1843 today.
The price backed off this evening after a rally up to the line earlier.
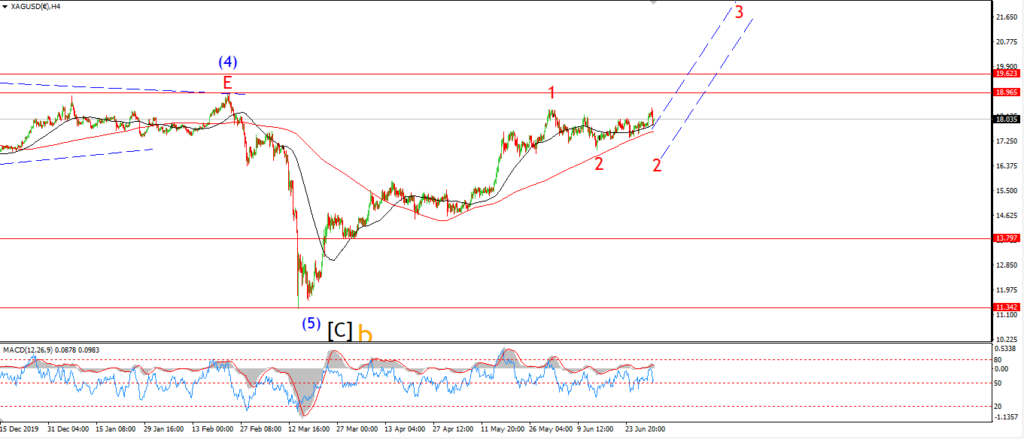
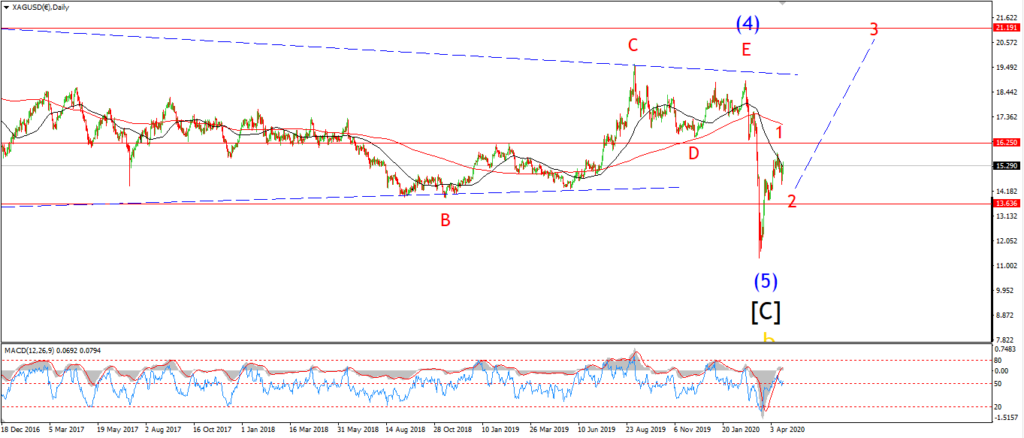
I want Silver to accelerate into wave ‘iii’ up over the coming week to confirm the current bullish count.
But if we drop back below 17.74 again that will call into question this particular interpretation for the recent action off the wave ‘2’ low.
Tomorrow;
Watch for wave ‘iii’ to push above 17.74 again and continue above 18.96 at a minimum.