
Good evening to one and all, the Lord’s Blessings to you tonight.
Today My little 6yr old girl was discharged from hospital for the last time I hope!
Its been an interesting month dealing with sickness and hospital life.
And one that I don’t want to experience again!
Thanks be to God we are back to normal life again and now the summer can begin at last!
Next week brings the 4th of July holiday in the US of A,
so the market is closed on Tuesday.
Monday will be a normal day on the site though.
here we go.
https://twitter.com/bullwavesreal
EURUSD.
EURUSD 1hr.
EURUSD 4hr.
EURUSD daily.
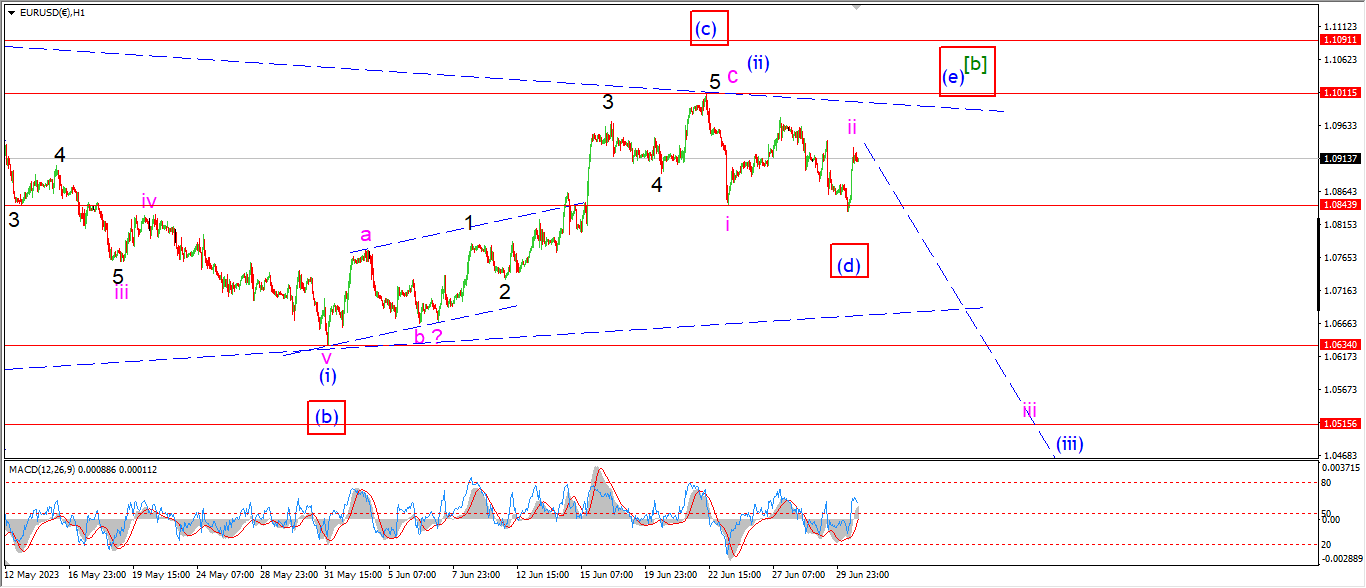
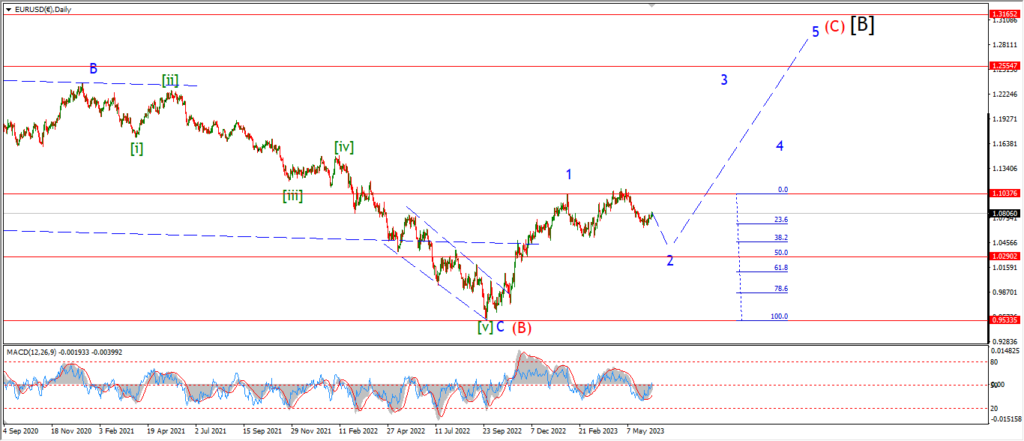
A slight change to the count today following a small rally early in the session.
If we take wave ‘i’ complete at 1.0844,
then wave ‘ii’ continuing off that low.
Then it is reasonable to suggest this sideways move as a running flat correction in wave ‘ii’ pink.
Todays high is enough to complete that pattern in wave ‘ii’.
and next week will bring wave the large move lower into wave ‘iii’ of (iii).
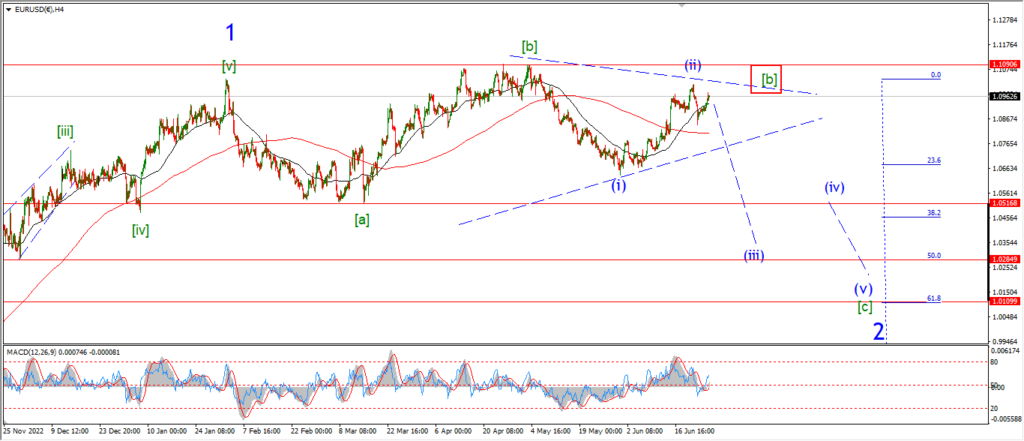
As for the alternate count,
this is best viewed on the 4hr chart.
Wave [b] can be viewed as a triangle which is still ongoing.
And this pattern does explain why we the action seems completely stuck over the last 2 weeks.
Wave (d) and (e) will close out that triangle pattern and then wave [c] green will be set to begin.
Monday;
Watch for wave a drop back below 1.0800 again to signal wave ‘iii’ of (iii) has begun.
The high at 1.1011 must hold for both patterns to remain valid.
GBPUSD
GBPUSD 1hr.
GBPUSD 4hr.
GBPUSD daily.
For the last few weeks I have been looking for a simple correction into wave ‘B’ to correct that large rally in wave ‘A’.
But the pattern has rallied out to new highs instead.
So today I have gone back to the drawing board for cable,
and now I think we are much further progressed in the larger pattern that I previously thought.
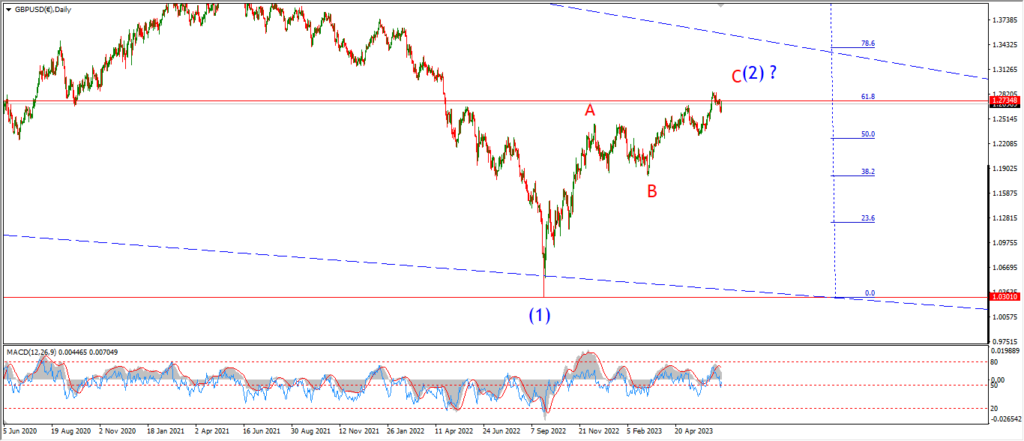
On the daily chart;
You can see I am tracking a large wave (2) correction overall.
Now I am suggesting that the pattern is close to completing that whole rally in wave (2).
The price has now retraced above 62% of the wave (1) decline.
And we have a three wave pattern in place.
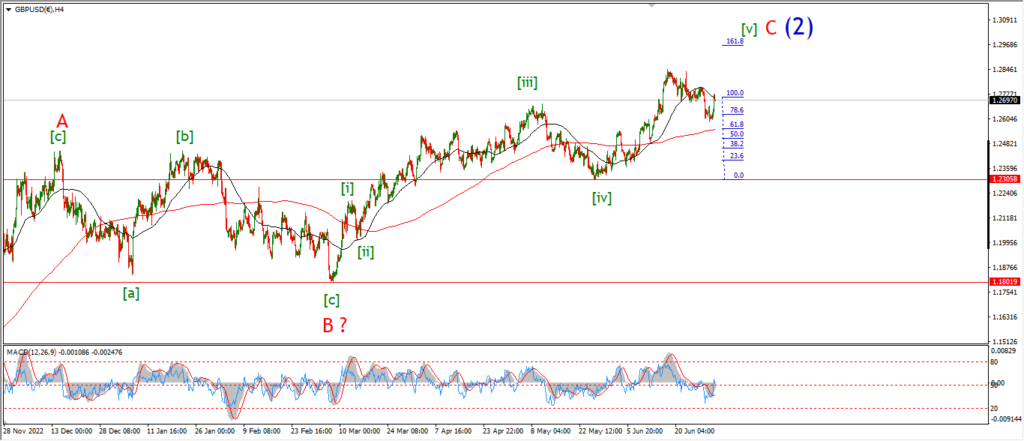
4hr chart;
You can see the rally in wave ‘C’ has been losing momentum over the last week.
And the pattern in wave ‘C’ is close to completing five waves up.
Wave [v] of ‘C’ is reaching towards the 162% Fibonacci extension of wave [i].
Again,
this is another hint that we are close to the end here also.
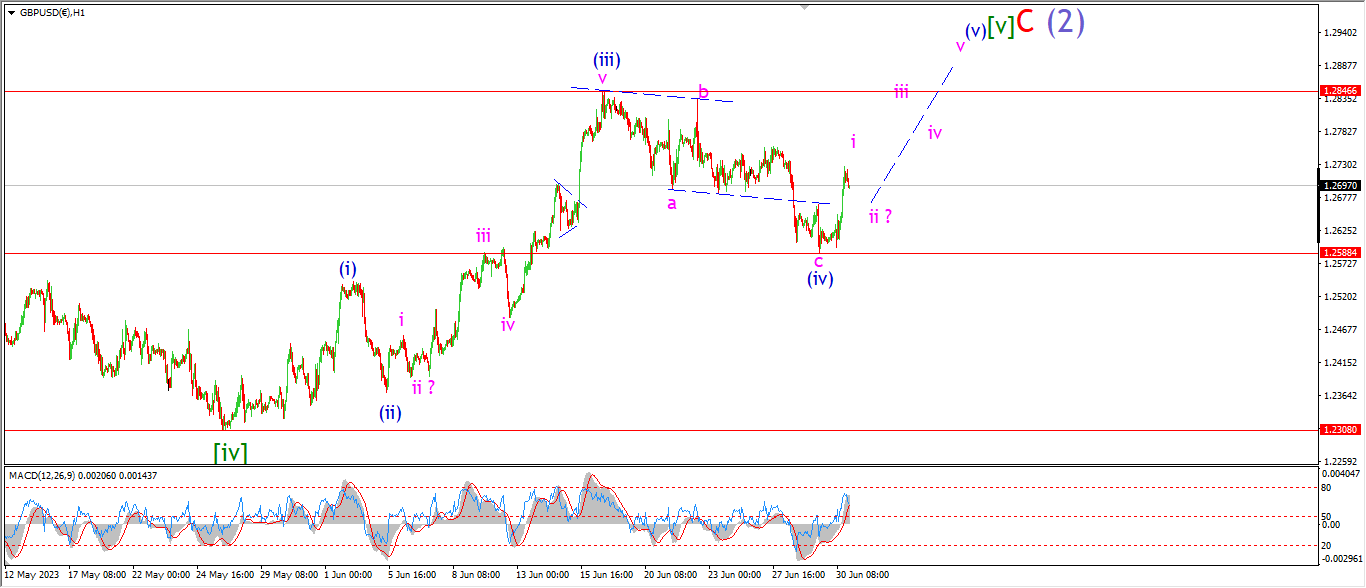
1hr chart;
The internal pattern of wave [v] green is close to that five wave structure now also.
If the recent decline is wave (iv) of [v],
then wave [v] is now underway.
Next week;
Five waves up again is on the cards here as wave (v) blue completes.
The target for wave (v) lies at 1.3846 at the wave (iii) high.
USDJPY.
USDJPY 1hr.
USDJPY 4hr.

USDJPY daily.
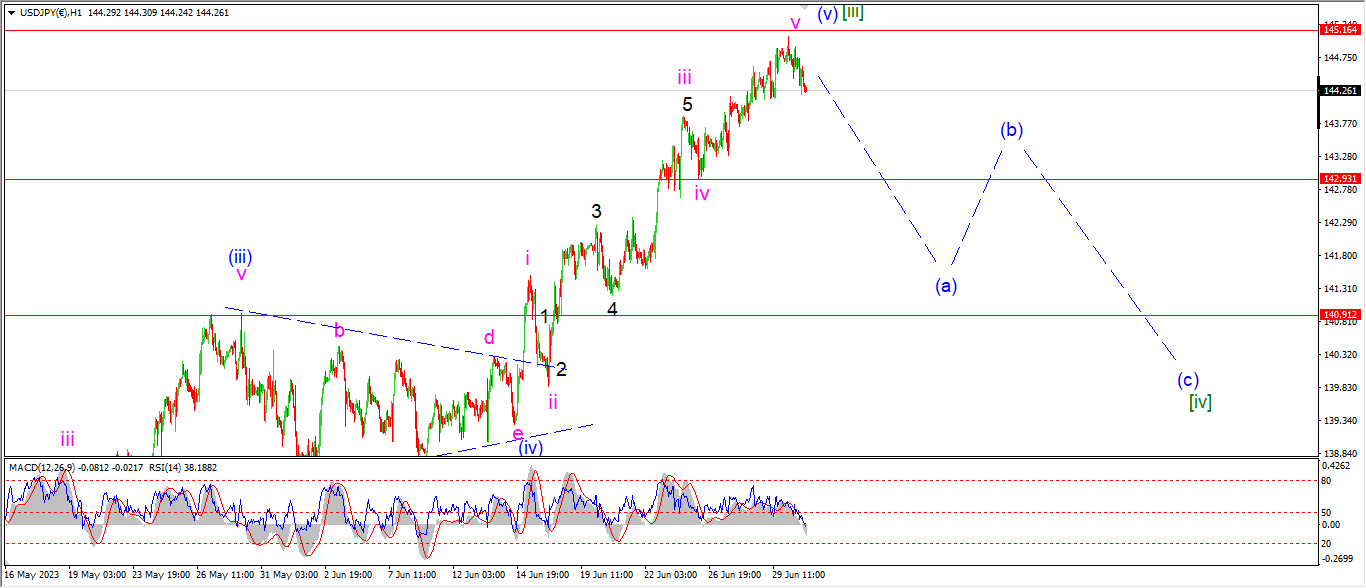
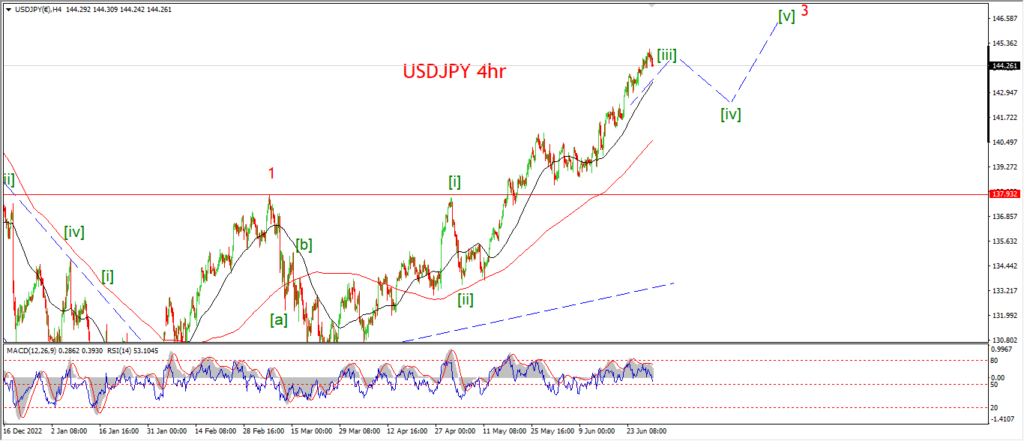
USDJPY is starting to drop off the highs of the week today,
and I am suggesting that this is the beginning of wave [iv] of of ‘3’ as seen on the 4hr chart.
It is still to early to confirm this idea,
but I think its time to begin looking lower at least.
I think the initial target for wave [iv] lies in the area of the previous wave (iv) low at one lesser degree.
That gives a target range between 138.40 and 140.90 for this correction.
A clear three wave pattern lower into wave [iv] is what I prefer,
but who knows how complicated this will get!
For next week though,
I suspect the way is clear for a correction to begin.
watch for a break of initial support in wave (a) of [iv].
DOW JONES.
DOW 1hr.
DOW 4hr
DOW daily.
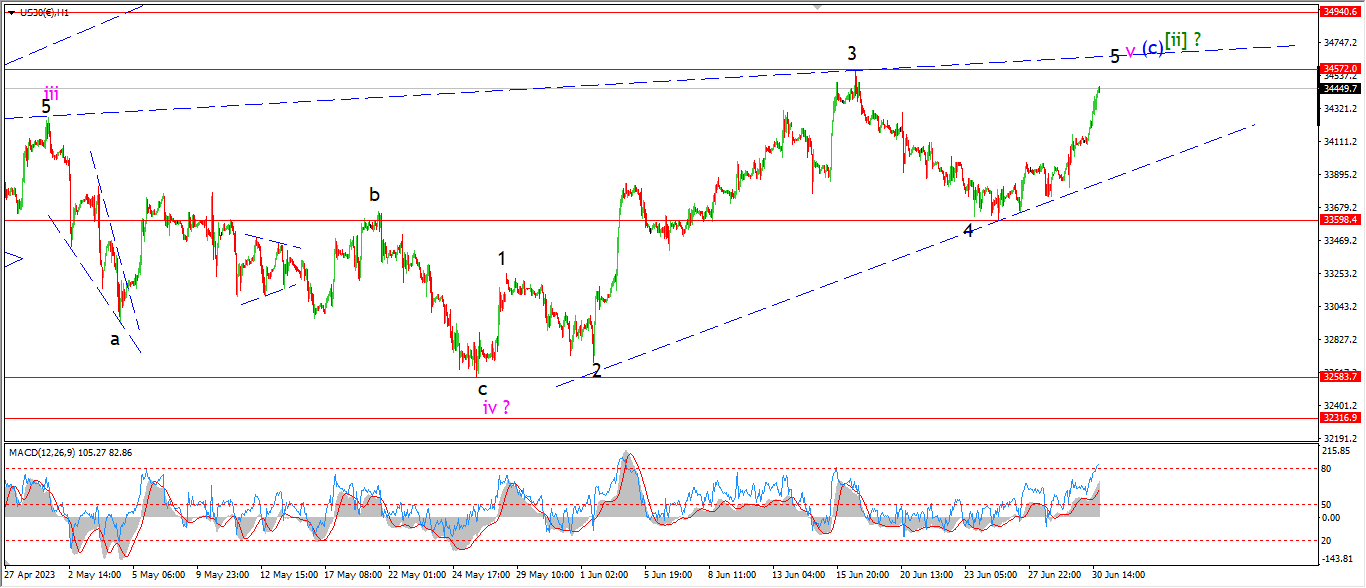
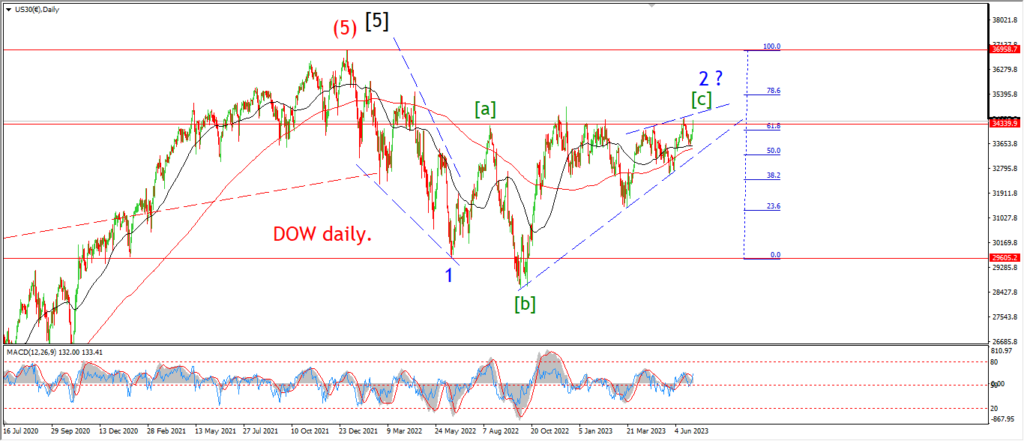
It would be stupid of me to continue calling this a corrective rally after todays spike higher again.
The first explanation of this rally is that wave ‘v’ of (c) is still ongoing.
This rally in wave (c) of [ii] has gone too far,
but the short term count is still within the bounds of possibility.
I wont discard it completely,
but I am showing an alternate pattern that fits this action also.
the Daily chart;
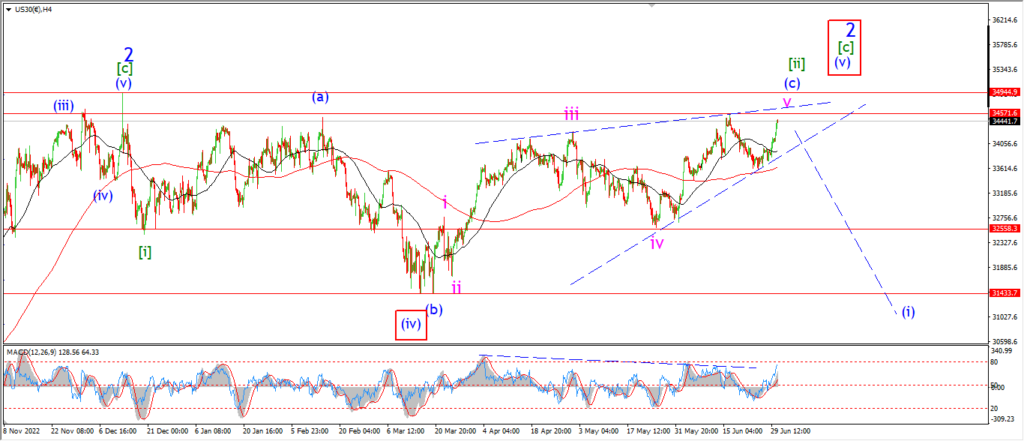
shows a truncated wave [c] of ‘2’ at this current high.
The final rally intp this high is slowing in momentum as you would expect in a final push in wave [c].
This final push is wave (v) of [c] of ‘2’.
The 4hr chart;
This chart shows the contracting wedge pattern in the alternate wave (v) of [c].
This pattern is not required to achieve much more upside to consider it complete.
A touch of that upper trend line will do it.
The hourly chart;
I have shown the wedge pattern for wave (v) of that alternate count.
But the main count for wave (c) of [ii] is still in place.
Both counts shown how extended the market is into this corrective rally in a second wave.
Both wave counts will allow for a new high at the upper trend line of this wedge.
While the main count must hold below 34940 and fall rapidly from here.
Next week.
Both counts are extended in their respective patterns.
I may be thought of as a fool for my bearish views at this point.
but the biggest disbelief comes at a second wave high.
And here we are.
The hunt for reversal is still on.
GOLD
GOLD 1hr.
GOLD 4hr.

GOLD daily.
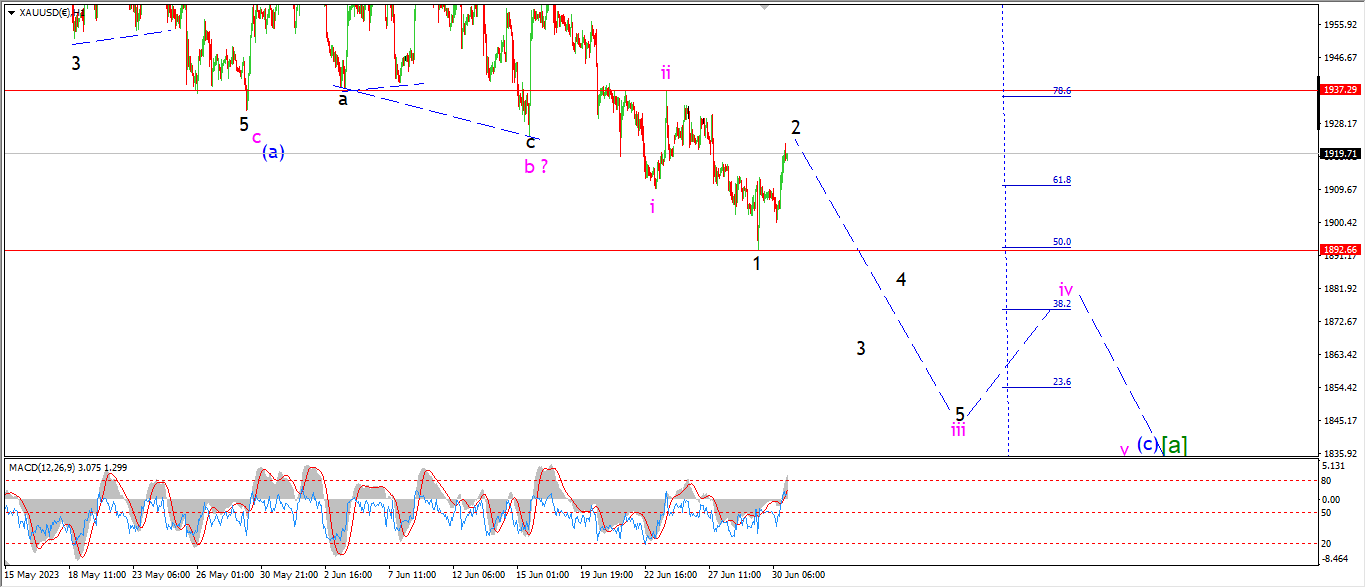
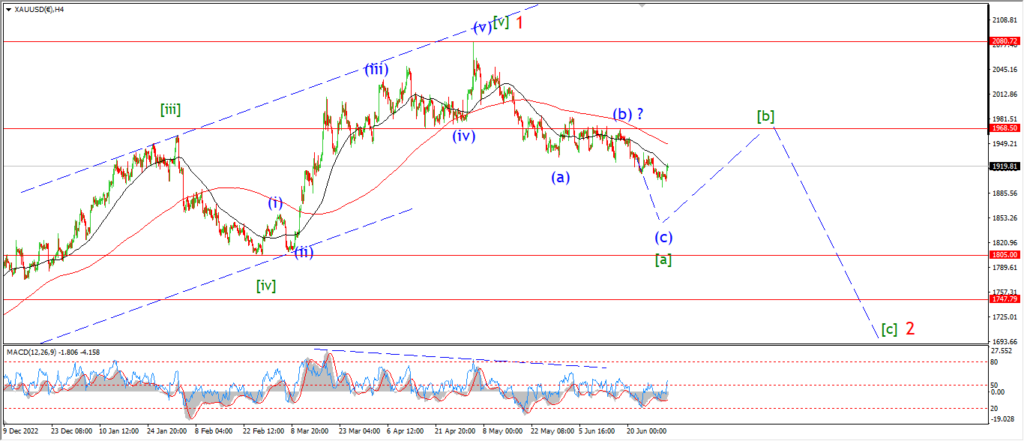
Gold has completed three waves up at todays highs.
This should be enough to complete wave ‘2’ of ‘iii’.
and as the wave count suggests,
next week should bring in wave ‘iii’ of (c) quite hard.
I am suggesting that wave (c) of [c] should bottom near 1850.
So there is work to do here next week.
Monday;
Watch for this three wave lower high to complete now and then we should see a drop back into 1892 again to signal wave ‘3’ of ‘iii’ is underway.
CRUDE OIL.
CRUDE OIL 1hr.
CRUDE OIL 4hr.
CRUDE OIL daily.
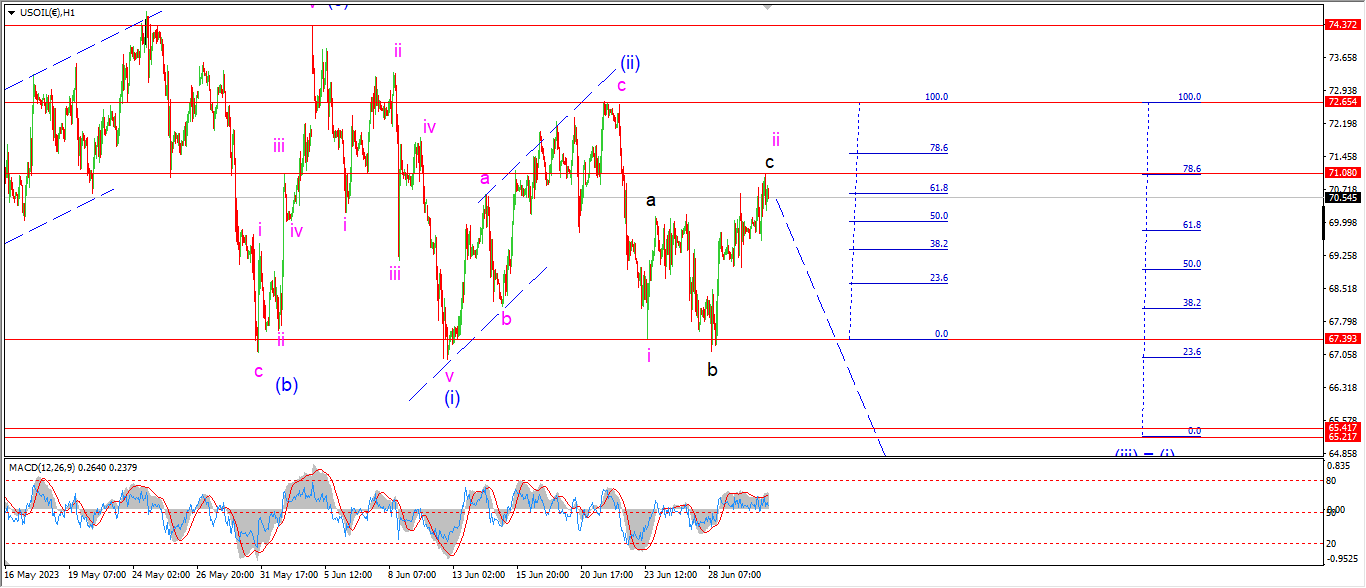
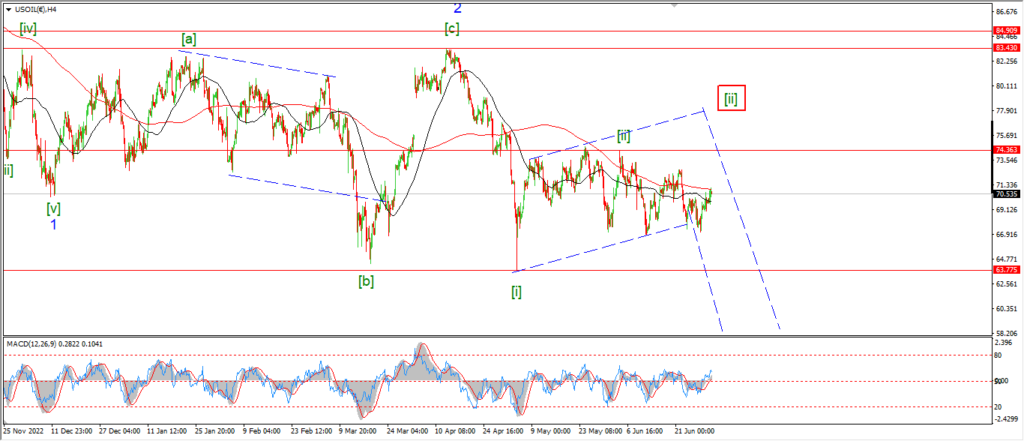
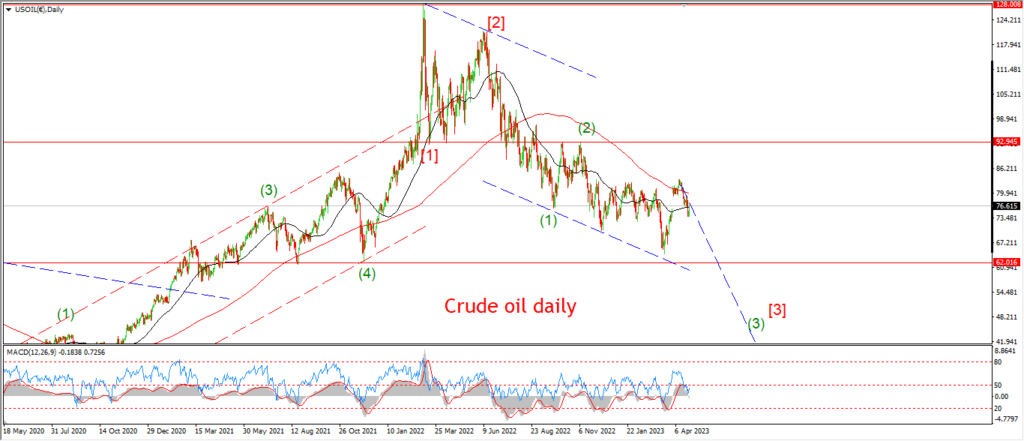
Crude has done very little but range around the 70.60 level today,
so wave ‘ii’ must still be in control here.
The top could be in at the session high,
but until we get an impulsive spike lower off the high then I’m afraid we have not much to go on yet.
The count for wave ‘ii’ as an expanded flat correction is solid.
But we need to confirm this early next week with another step lower.
Monday;
Watch for wave ‘ii’ to show signs of rolling over into wave ‘iii’.
A drop below 69.00 again will do just that.
a break of 67.40 again will confirm wave ‘iii’ is underway.
S&P 500.
S&P 500 1hr
S&P 500 4hr
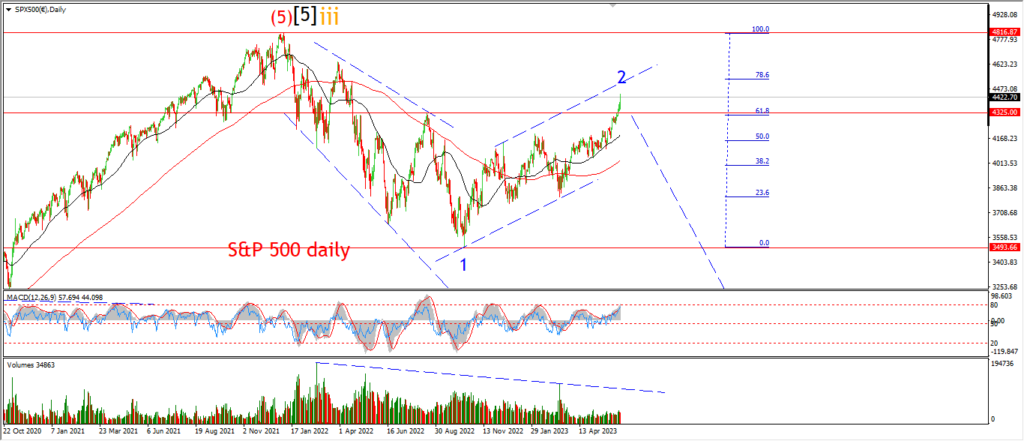
S&P 500 daily.
I have reworked the wave count in wave [c] of ‘2’ here today also.
A new high has finally ruled out last nights count.
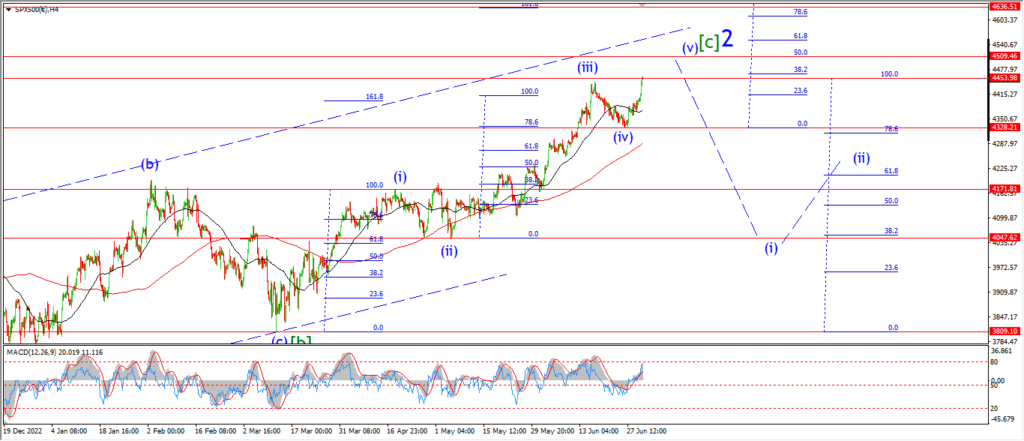
The 4hr chart is the best to begin with here.
Take a look at the overall rally in wave [c].
Wave (iii) reached just above equality with wave (i).
and wave (v) is now heading towards the 50% of wave (i) level.
on the larger pattern,
wave [c] has already reached equality with wave [a] even at todays high.
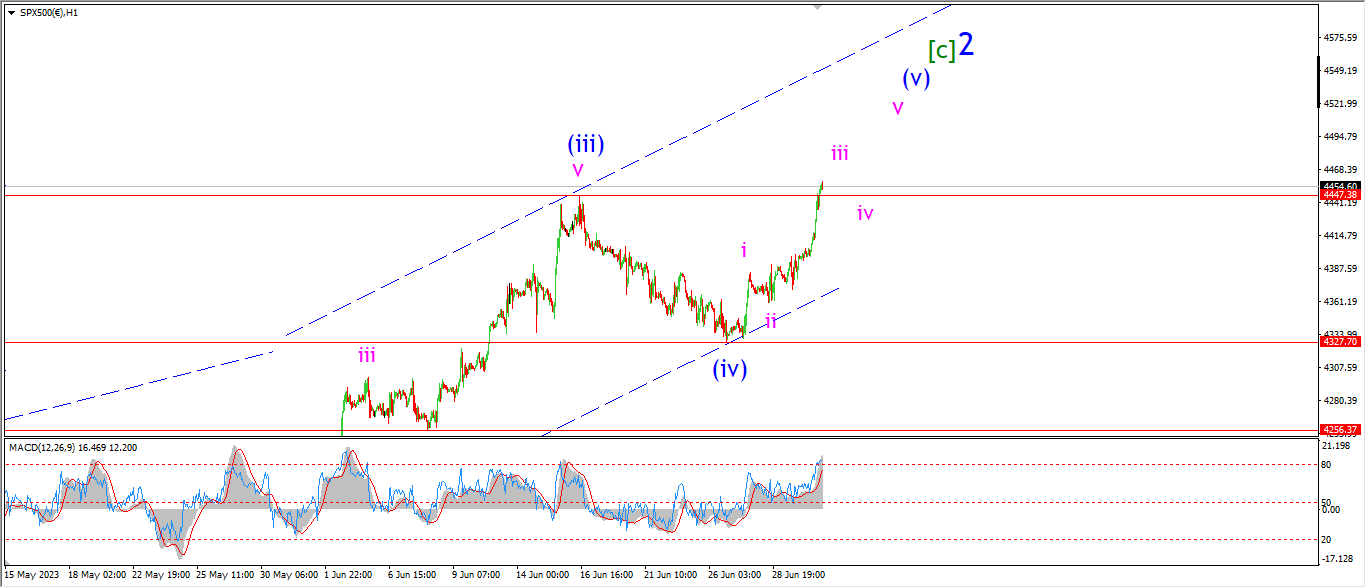
The hourly chart;
Wave (v) of [c] is tracing out five waves up overall,
and now wave ‘iii’ of (v) has broken to a new high above the previous wave (iii) high.
This count will allow for a little more upside to complete five waves up in wave (v) blue.
Next week;
Watch for wave (v) to complete after the 4th of July holiday break.
Another week has gone by without the big drop that I know is coming.
But this does not change my conviction here.
Wave ‘2’ will top out and wave ‘3’ will crash this market like you wouldn’t believe!
All in good time.
SILVER.
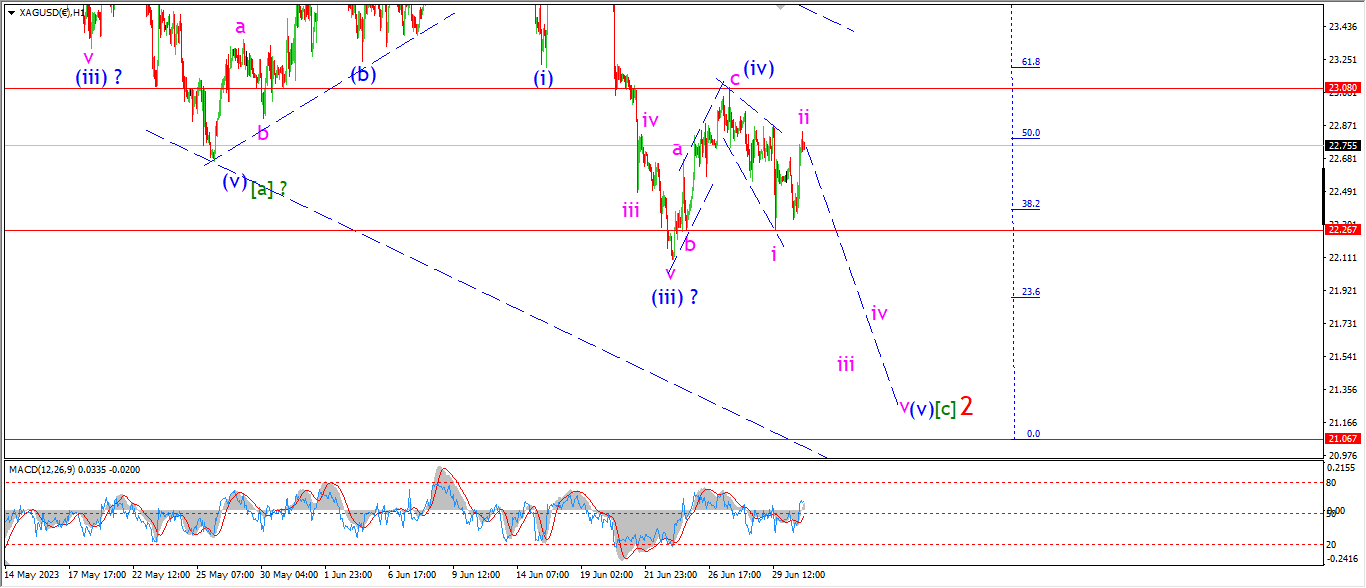
SILVER 1hr
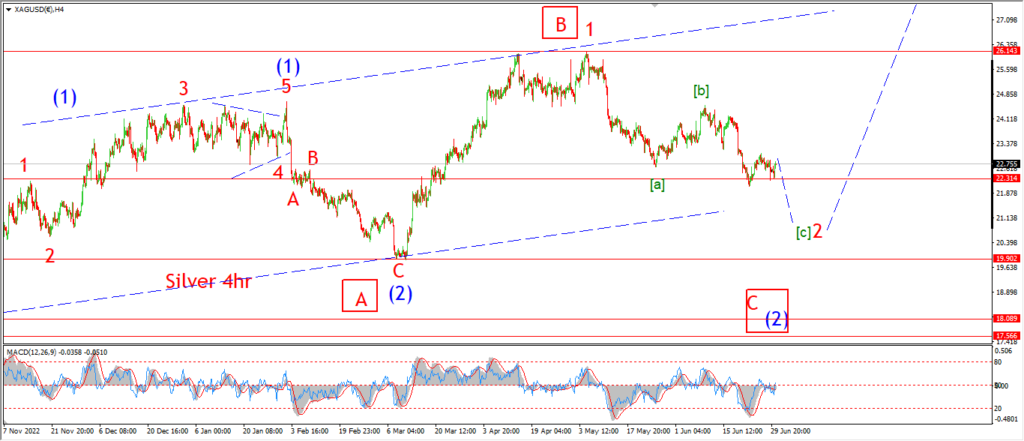
SILVER 4hr.
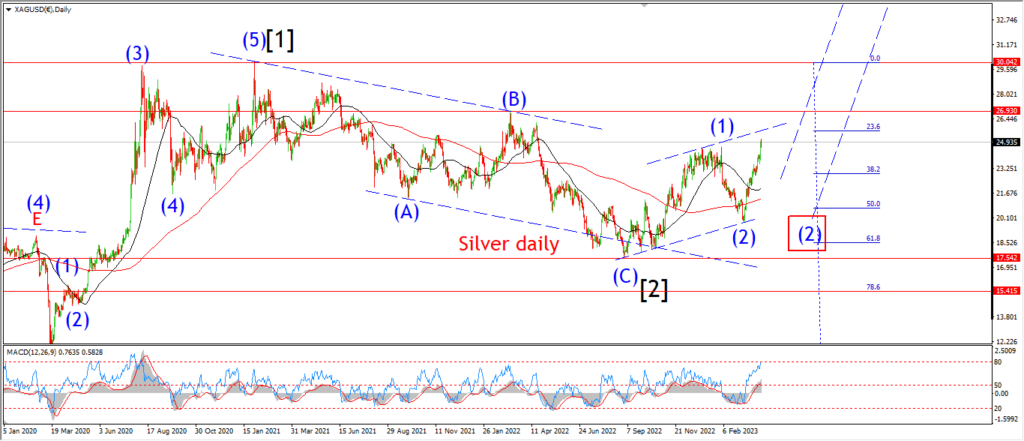
SILVER daily.
Three waves up in wave ‘ii’ have completed at todays high.
An impulse wave is now complete off the highs at wave (iv).
Wave ‘iii’ of (V) must now turn lower again early next week.
A break of the wave ‘i’ low at 22.26 again will signal wave ‘iii’ is underway.
Next week;
Watch for wave (v) down to continue in five waves towards the target lows at 21.00.
BITCOIN
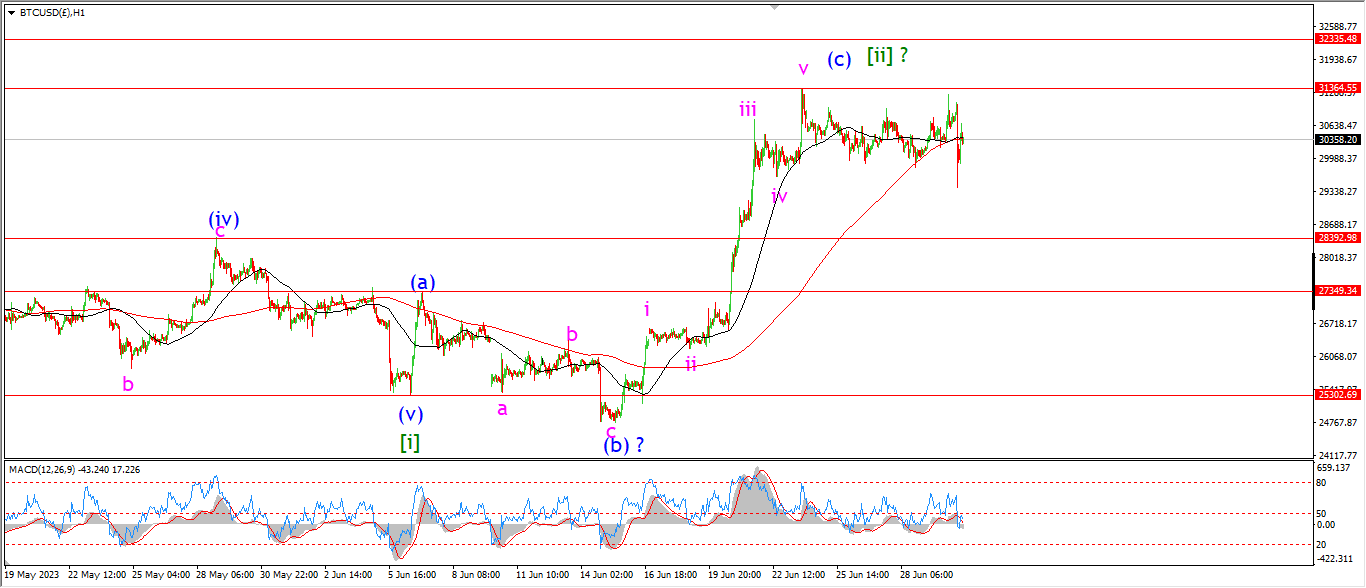
BITCOIN 1hr.
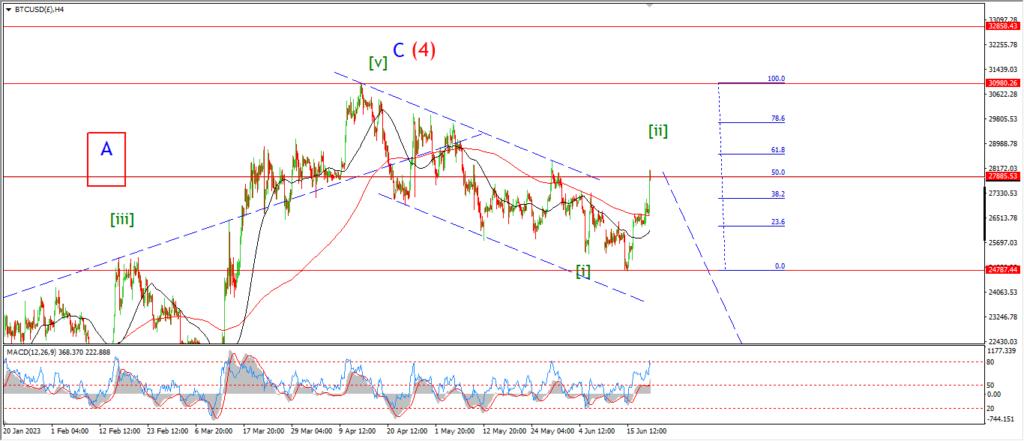
BITCOIN 4hr.
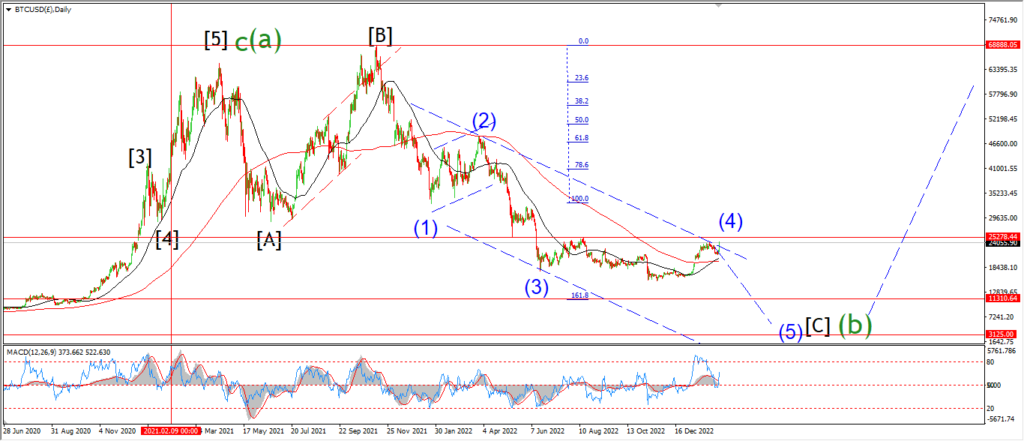
BITCOIN daily.
….
FTSE 100.
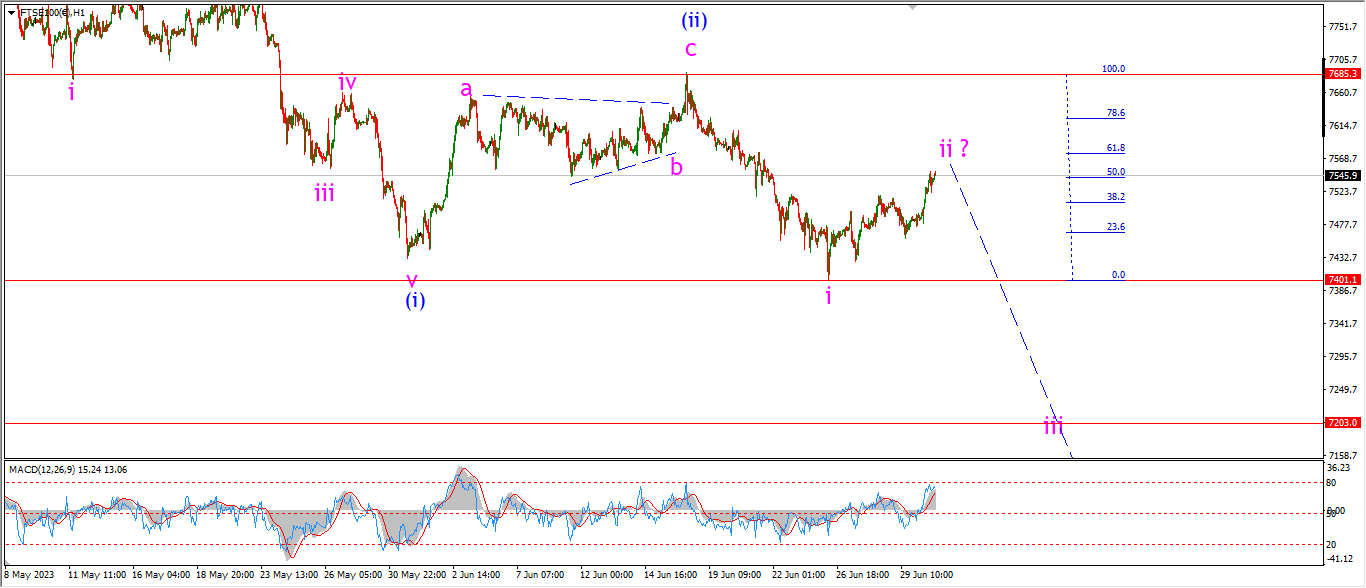
FTSE 100 1hr.
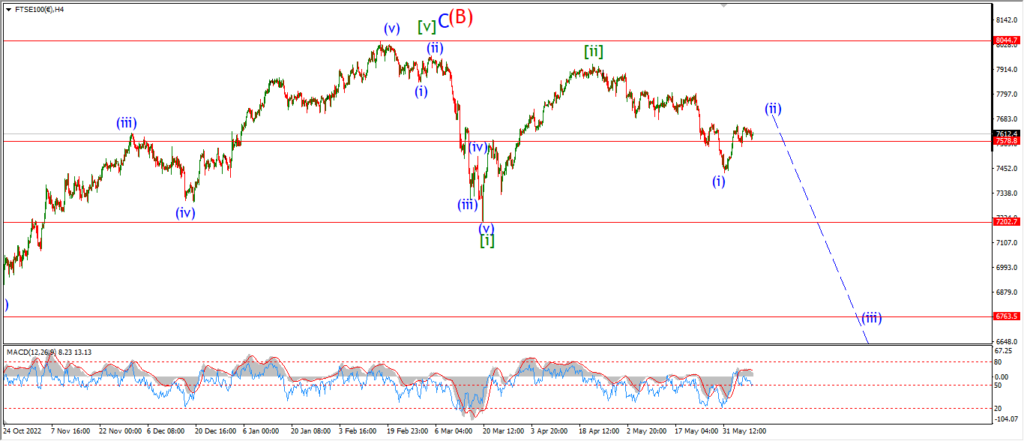
FTSE 100 4hr.
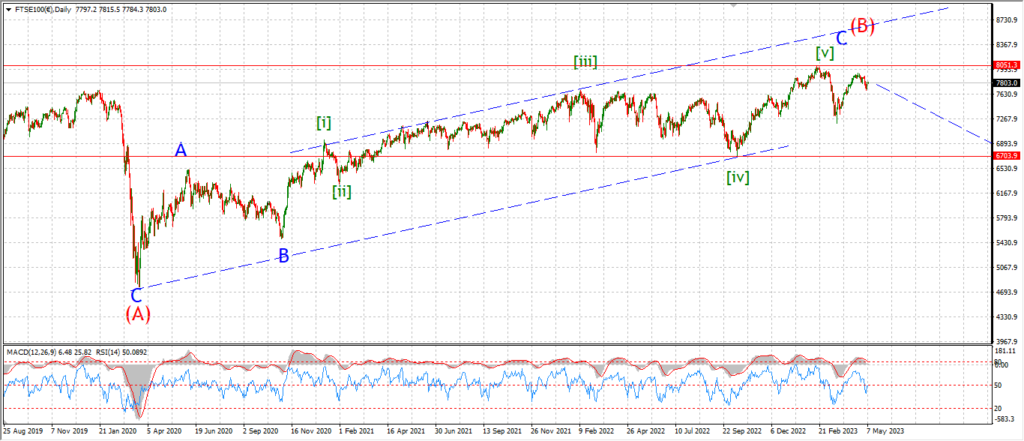
FTSE 100 daily.
….
DAX.
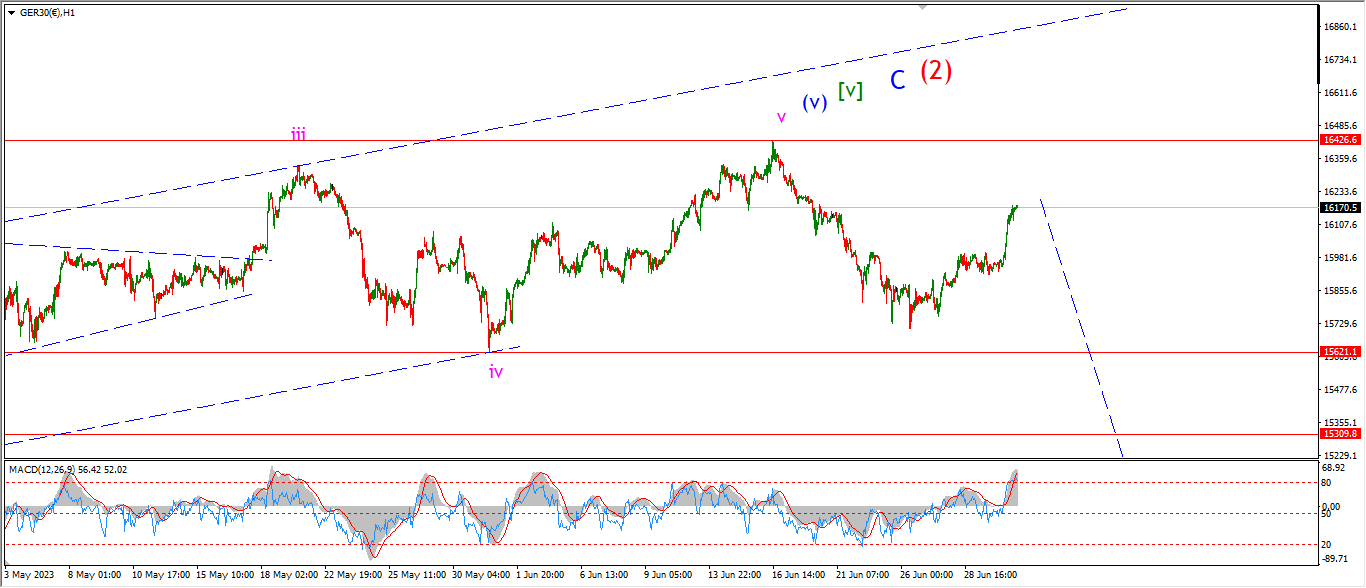
DAX 1hr
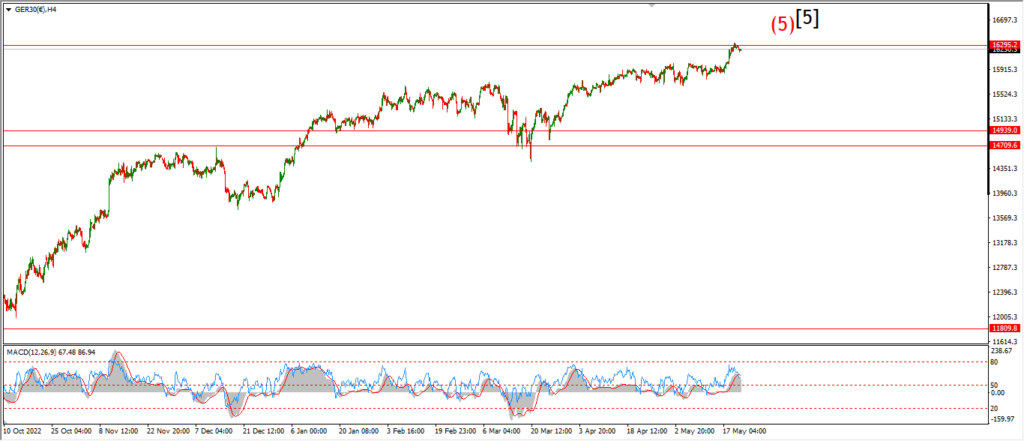
DAX 4hr
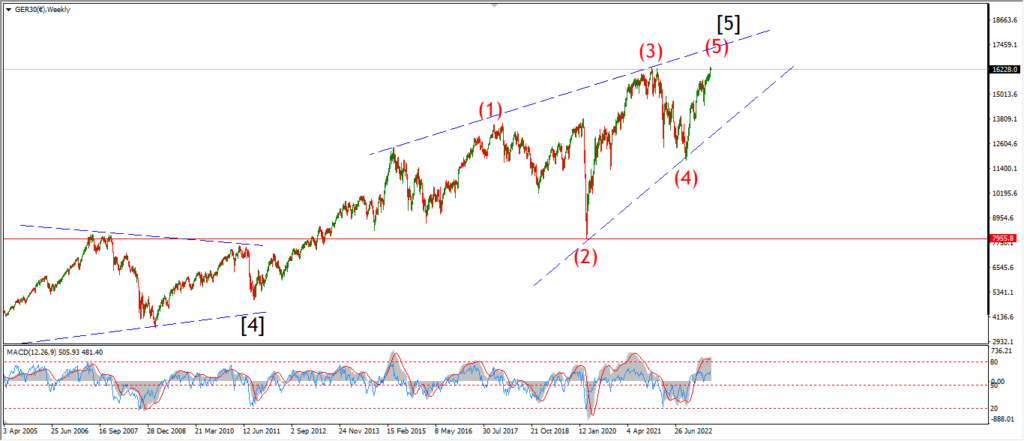
DAX daily.
….
NASDAQ 100.
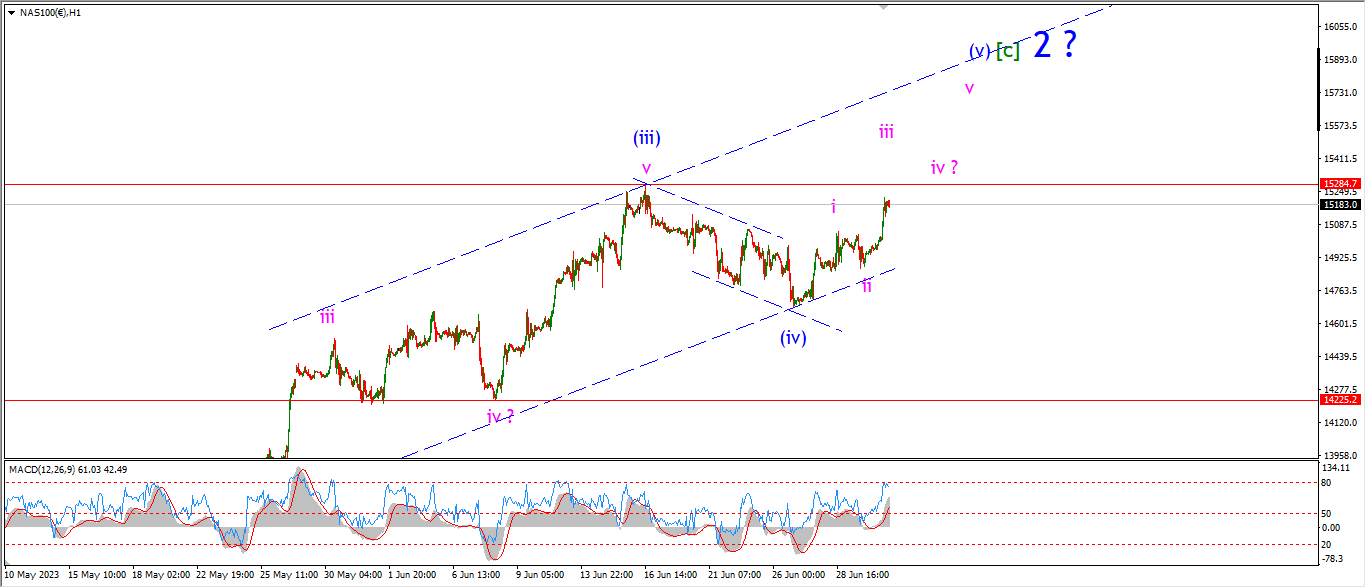
NASDAQ 1hr
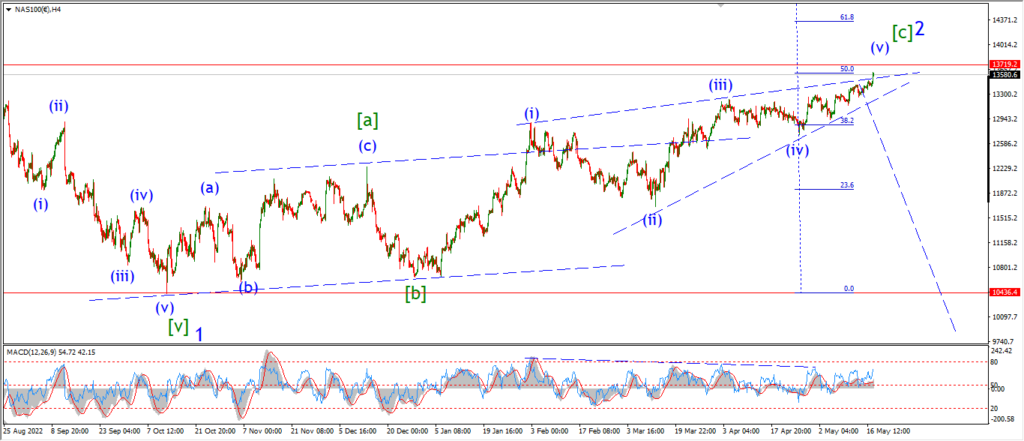
NASDAQ 4hr.

NASDAQ daily.
….