
[vc_row][vc_column][vc_separator border_width=”5″][/vc_column][/vc_row]
[vc_row][vc_column][vc_column_text]
Good evening all.
[/vc_column_text][/vc_column][/vc_row]
[vc_row][vc_column][vc_separator border_width=”5″][/vc_column][/vc_row]
[vc_row][vc_column][vc_column_text]
EURUSD
[/vc_column_text][/vc_column][/vc_row]
[vc_row][vc_column][vc_separator border_width=”5″][/vc_column][/vc_row][vc_row][vc_column width=”2/3″][vc_custom_heading text=”1 hr” use_theme_fonts=”yes”][vc_column_text]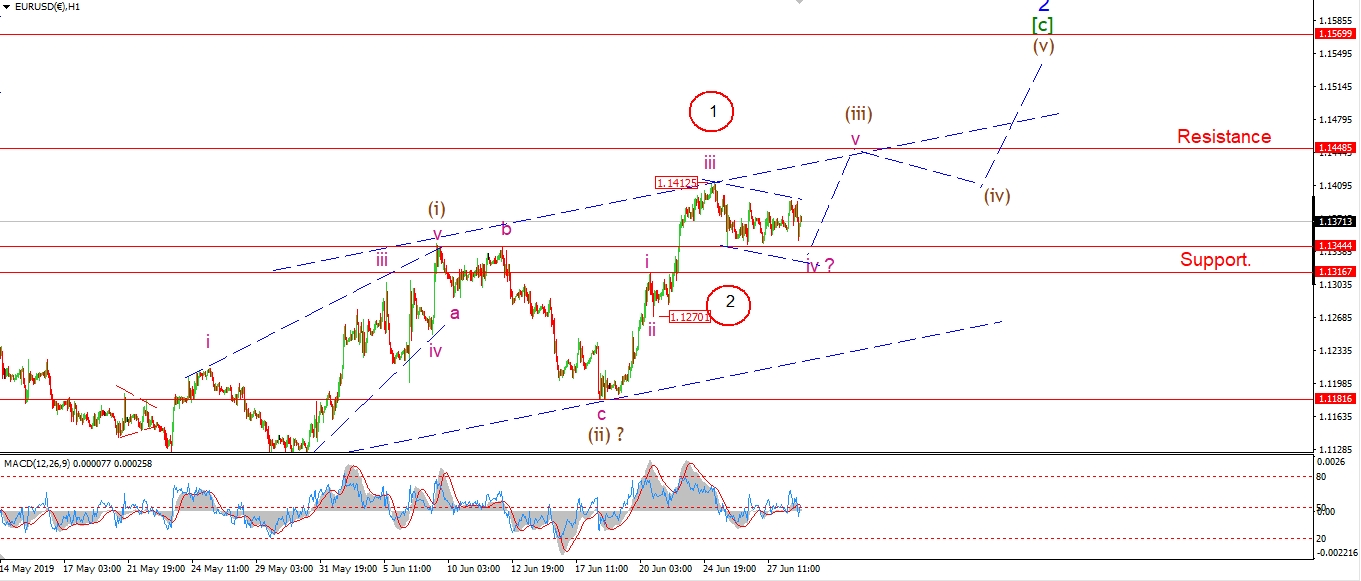 [/vc_column_text][/vc_column][vc_column width=”1/3″][vc_custom_heading text=”4 Hours” use_theme_fonts=”yes”][vc_column_text]
 [/vc_column_text][vc_custom_heading text=”Daily” use_theme_fonts=”yes”][vc_column_text]
 [/vc_column_text][/vc_column][/vc_row]
[vc_row][vc_column][vc_column_text]
Despite an early spike out of a triangle formation this morning,
the price has now fallen back again
and in doing so, ruled out the triangle pattern for wave ‘iv’.
I have now shown a possible flat correction in play.
the price should break 1.1344 to complete wave ‘iv’.
But the margin is quite tight below.
As wave ‘iv’ must also hold above 1.1316 in order for the larger five wave pattern to remain valid.
So at the moment,
we are walking a tightrope in EURUSD.
Monday;
Watch for wave ‘iv’ to complete above 1.1316.
Wave ‘v’ should break out above 1.1412 in order to complete wave (iii).
A break of 1.1181 will rule out this short term count.
[/vc_column_text][/vc_column][/vc_row]
[vc_row][vc_column][vc_separator border_width=”5″][/vc_column][/vc_row][vc_row][vc_column][vc_column_text]
GBPUSD
[/vc_column_text][/vc_column][/vc_row][vc_row][vc_column][vc_separator border_width=”5″][/vc_column][/vc_row][vc_row][vc_column width=”2/3″][vc_custom_heading text=”1 hr” use_theme_fonts=”yes”][vc_column_text]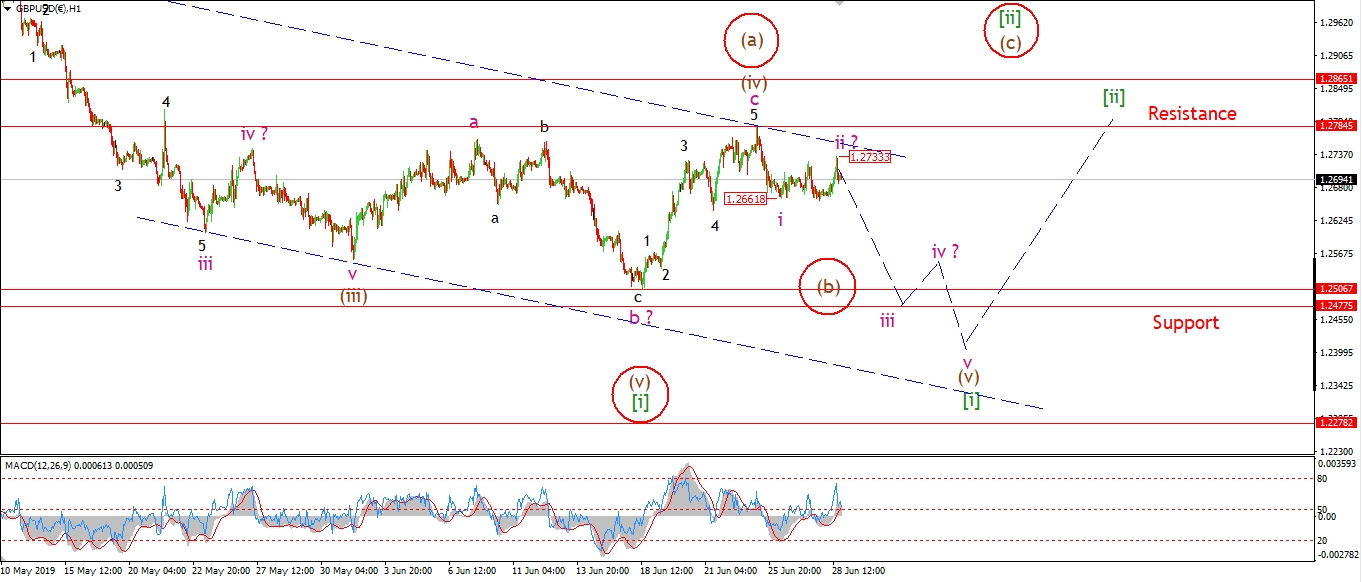 [/vc_column_text][/vc_column][vc_column width=”1/3″][vc_custom_heading text=”4 Hours” use_theme_fonts=”yes”][vc_column_text]
 [/vc_column_text][vc_custom_heading text=”Daily” use_theme_fonts=”yes”][vc_column_text]
 [/vc_column_text][/vc_column][/vc_row]
[vc_row][vc_column][vc_column_text]
Cable pushed to a small new high this afternoon at 1.2733.
This action has created a larger three wave pattern in wave ‘ii’ pink.
Wave ‘ii’ has now traced out an expanded flat correction and should be complete.
And wave ‘iii’ should now take over and push below 1.2600 to confirm the decline into wave (v).
As for the alternate count.
If the price completes a three wave decline off the recent high,
and then rallies back abouve 1.2784,
that will trigger the alternate count shown circled in red.
Monday;
Watch for wave ‘iii’ of (v) to continue lower off 1.2733.
[/vc_column_text][/vc_column][/vc_row]
[vc_row][vc_column][vc_separator border_width=”5″][/vc_column][/vc_row][vc_row][vc_column][vc_column_text]
USDJPY
[/vc_column_text][/vc_column][/vc_row][vc_row][vc_column][vc_separator border_width=”5″][/vc_column][/vc_row][vc_row][vc_column width=”2/3″][vc_custom_heading text=”1 hr” use_theme_fonts=”yes”][vc_column_text]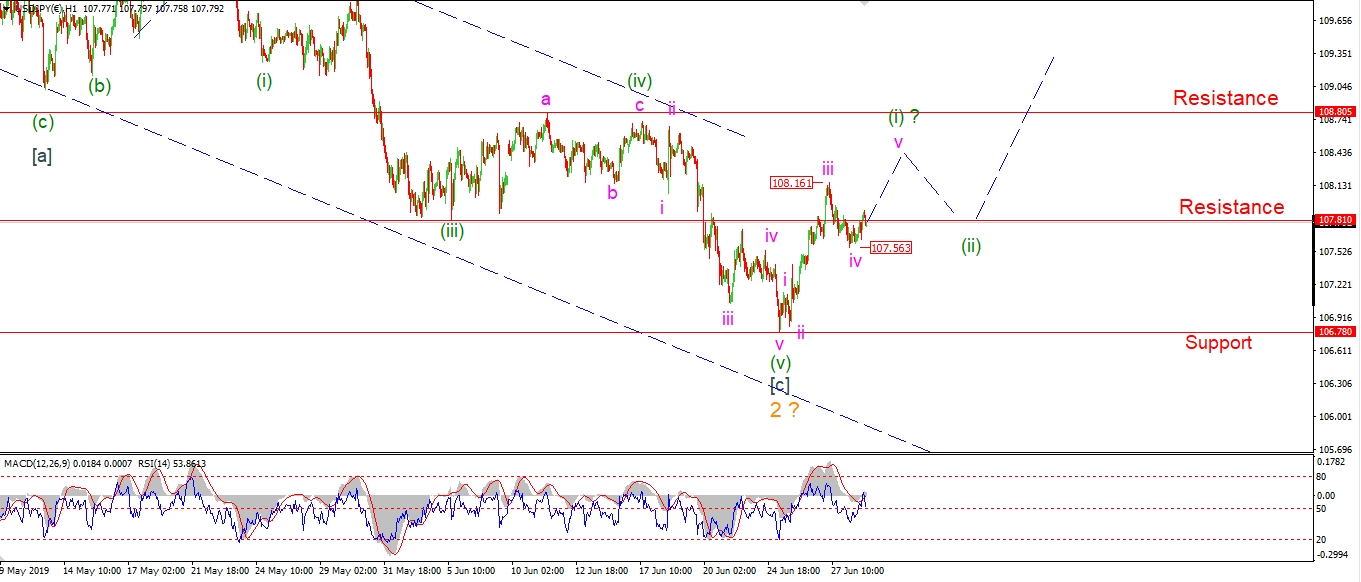 [/vc_column_text][/vc_column][vc_column width=”1/3″][vc_custom_heading text=”4 Hours” use_theme_fonts=”yes”][vc_column_text]
 [/vc_column_text][vc_custom_heading text=”Daily” use_theme_fonts=”yes”][vc_column_text]
 [/vc_column_text][/vc_column][/vc_row]
[vc_row][vc_column][vc_column_text]
USDJPY is up off the session lows at 107.56 this evening.
That low is labelled wave ‘iv’ of (i).
Wave ‘v’ should push higher to break 108.16 at a minimum early next week.
Once we have a clear five wave pattern in place off the low at 106.78.
Then I will look for a three wave corrective decline as show.
That action will complete a bullish signal.
And wave (iii) up will be ready to rally.
Monday:
watch for wave (i) to complete with a break of 108.16.
Wave (ii) should form a higher low above 106.78.
[/vc_column_text][/vc_column][/vc_row]
[vc_row][vc_column][vc_separator border_width=”5″][/vc_column][/vc_row][vc_row][vc_column][vc_column_text]
DOW JONES INDUSTRIALS
[/vc_column_text][/vc_column][/vc_row][vc_row][vc_column][vc_separator border_width=”5″][/vc_column][/vc_row][vc_row][vc_column width=”2/3″][vc_custom_heading text=”1 hr” use_theme_fonts=”yes”][vc_column_text]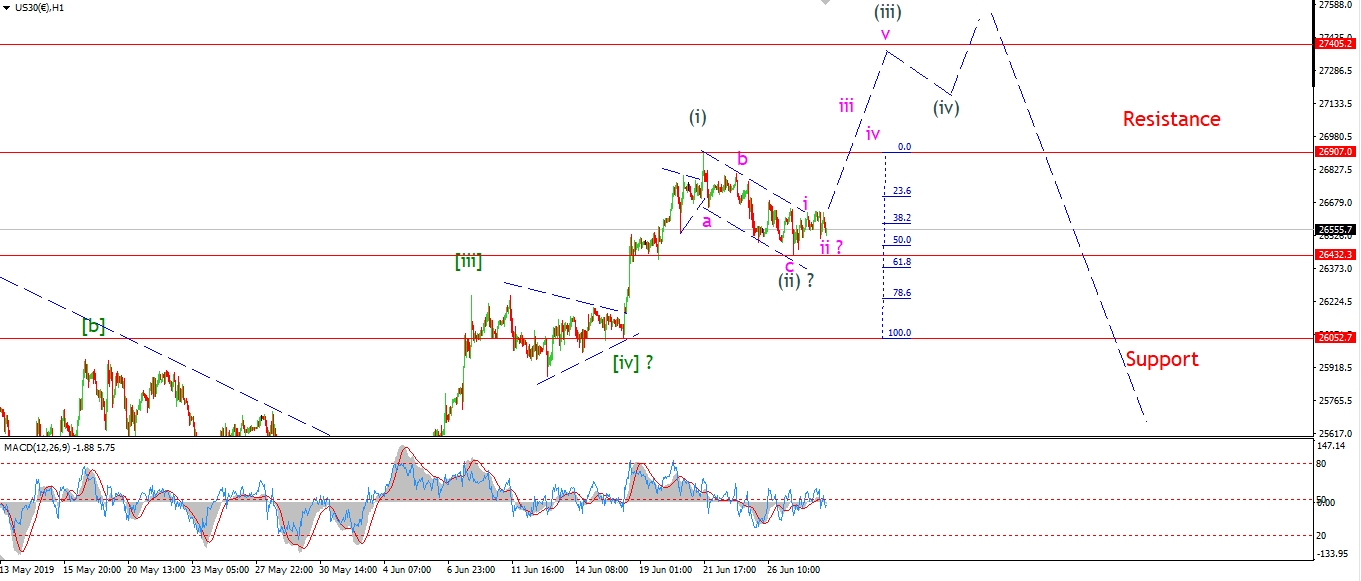 [/vc_column_text][/vc_column][vc_column width=”1/3″][vc_custom_heading text=”4 Hours” use_theme_fonts=”yes”][vc_column_text]
 [/vc_column_text][vc_custom_heading text=”Daily” use_theme_fonts=”yes”][vc_column_text]
 [/vc_column_text][/vc_column][/vc_row]
[vc_row][vc_column][vc_column_text]
The action over the last two sessions is looking positive,
and we may have completed a small bullish signal off the low at wave (ii) grey.
The slight rise off the wave (ii) low is labelled wave ‘i’ and ‘ii’ pink.
If this is correct,
then wave ‘iii’ up will rally to a new all time high later next week.
Price must hold above 26432 for this interpretation to remain valid.
A break of support at 26052 will rule out this bullish count completely.
Monday;
Watch for wave (iii) of [v] to continue higher next week.
Wave ‘iii’ of (iii) has the potential to rally to a new all time high.
[/vc_column_text][/vc_column][/vc_row]
[vc_row][vc_column][vc_separator border_width=”5″][/vc_column][/vc_row][vc_row][vc_column][vc_column_text]
GOLD
[/vc_column_text][/vc_column][/vc_row][vc_row][vc_column][vc_separator border_width=”5″][/vc_column][/vc_row][vc_row][vc_column width=”2/3″][vc_custom_heading text=”1 hr” use_theme_fonts=”yes”][vc_column_text]
 [/vc_column_text][/vc_column][vc_column width=”1/3″][vc_custom_heading text=”4 Hours” use_theme_fonts=”yes”][vc_column_text]
 [/vc_column_text][vc_custom_heading text=”Daily” use_theme_fonts=”yes”][vc_column_text]
 [/vc_column_text][/vc_column][/vc_row]
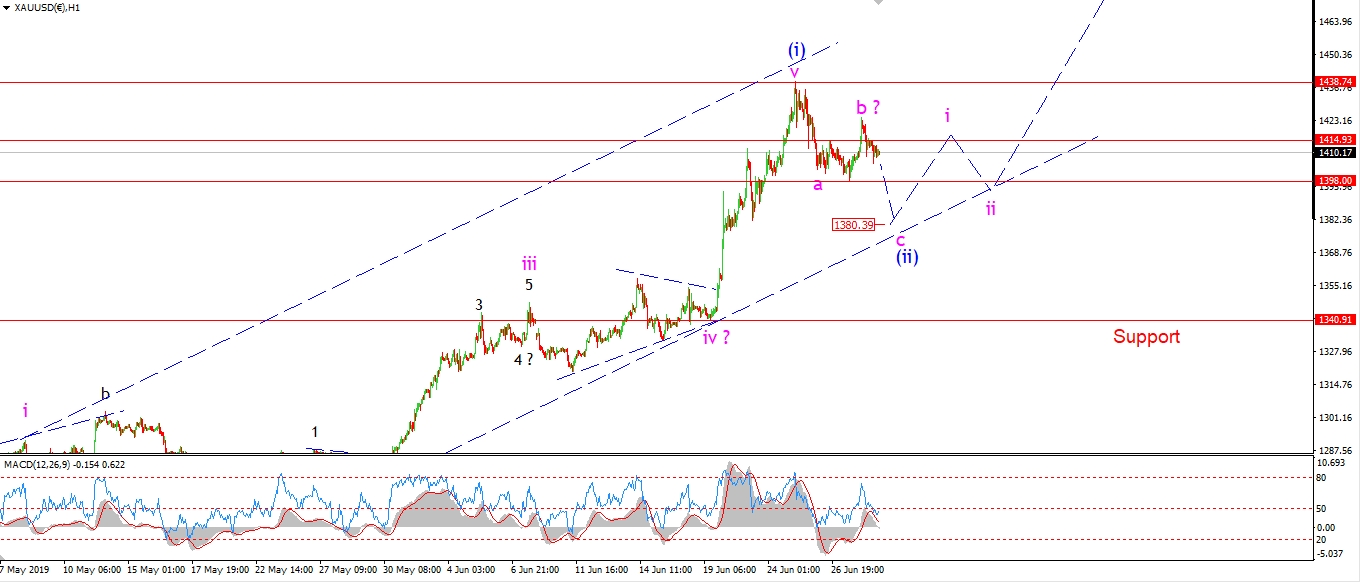
[vc_row][vc_column][vc_column_text]
I have shown a slightly different interpretation of wave (ii) this evening.
The spike early today created new a higher low.
Wave ‘b’ now fits an expanded flat correction.
And wave ‘c’ should now continue lower to break 1398 at a minimum.
the main target I am working with lies at 1380 where wave (ii) reaches the rising trend channel line again.
Once we reach that point I will begin to look higher again in wave (iii) of [iii].
and that wave has some serious bullish potential.
Monday;
Wave (ii) should complete at the trend channel line before working higher to begin wave (iii) as shown.
A break above 14.38 again will signal that wave (iii) has begun.
[/vc_column_text][/vc_column][/vc_row]
[vc_row][vc_column][vc_separator border_width=”5″][/vc_column][/vc_row][vc_row][vc_column][vc_column_text]
U.S CRUDE OIL
[/vc_column_text][/vc_column][/vc_row][vc_row][vc_column][vc_separator border_width=”5″][/vc_column][/vc_row][vc_row][vc_column width=”2/3″][vc_custom_heading text=”1 hr” use_theme_fonts=”yes”][vc_column_text] [/vc_column_text][/vc_column][vc_column width=”1/3″][vc_custom_heading text=”4 Hours” use_theme_fonts=”yes”][vc_column_text]
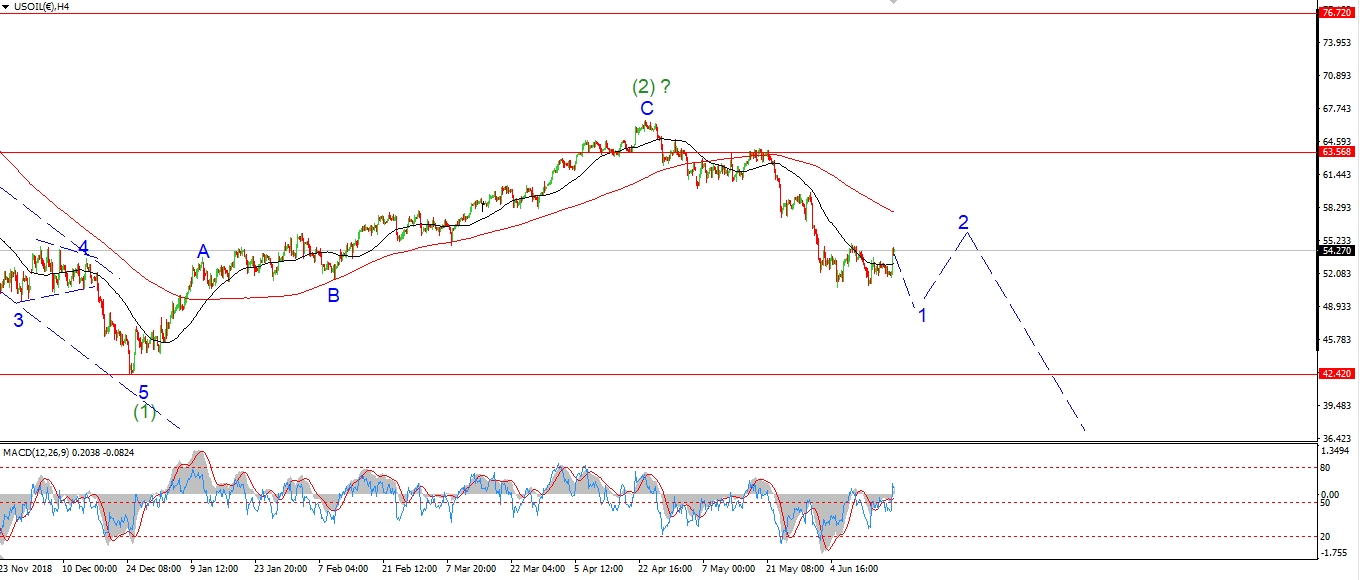 [/vc_column_text][vc_custom_heading text=”Daily” use_theme_fonts=”yes”][vc_column_text]
 [/vc_column_text][/vc_column][/vc_row]
[vc_row][vc_column][vc_column_text]
Crude is beginning to fall in wave (a) of [b] finally today.
The pattern off the recent high at wave [a] seems to be in the form of a flat correction.
Where waves ‘a’ and ‘b’ trace out a three waves each,
and wave ‘c’ will fall in five waves.
A break of the previous wave ‘iv’ low at 57.50 will be enough to confirm that wave [b] has begun.
Although that will not be enough to complete wave [b].
I expect wave [b] to continue lower for the next week at least,
and hit the 55.00 handle again before completing.
Monday;
Watch for wave (a) of [b] to find a low at about 56.50 and then correct higher again in wave (b) of [b].
[/vc_column_text][/vc_column][/vc_row]
[vc_row][vc_column][vc_separator border_width=”5″][/vc_column][/vc_row][vc_row][vc_column][vc_column_text]
US 10 yr Treasuries.
[/vc_column_text][/vc_column][/vc_row][vc_row][vc_column][vc_separator border_width=”5″][/vc_column][/vc_row][vc_row][vc_column width=”2/3″][vc_custom_heading text=”1 hr” use_theme_fonts=”yes”][vc_column_text]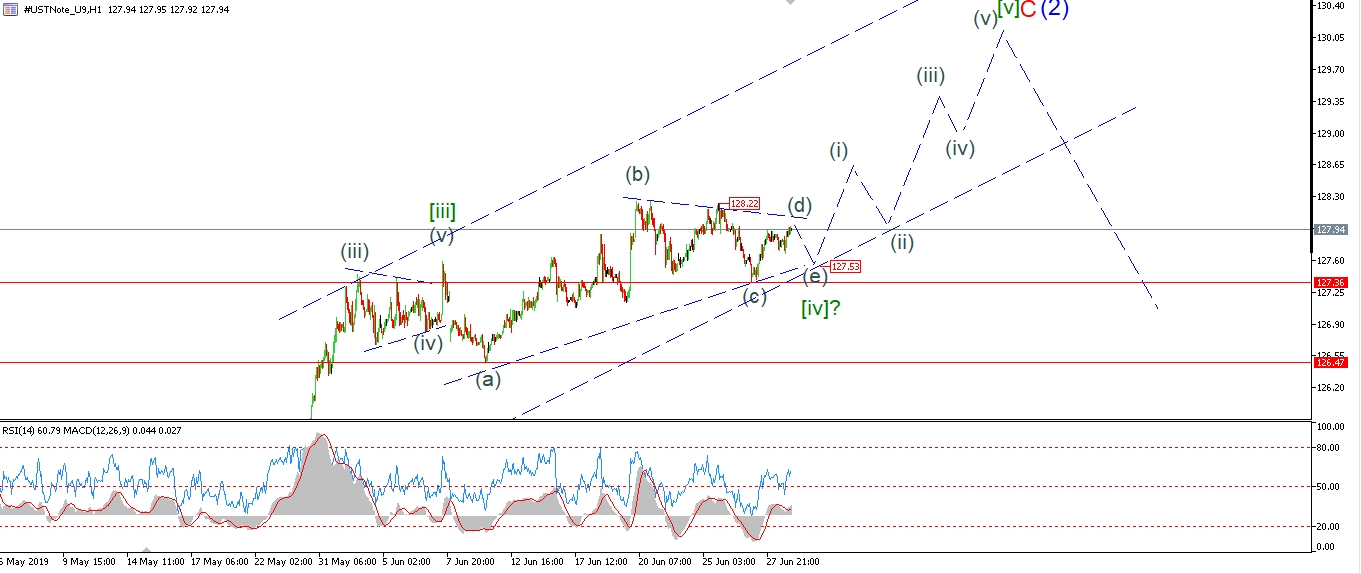 [/vc_column_text][/vc_column][vc_column width=”1/3″][vc_custom_heading text=”4 Hours” use_theme_fonts=”yes”][vc_column_text]
 [/vc_column_text][vc_custom_heading text=”Daily” use_theme_fonts=”yes”][vc_column_text]
 [/vc_column_text][/vc_column][/vc_row]
[vc_row][vc_column][vc_column_text]
The 10YR has continued to move sideways in a contracting triangle formation today.
The rise off the low at wave (c) is again in three waves at todays high.
This suggests wave (d) is now near to completion,
and wave (d) should complete below 128.22.
wave (e) should then decline again in three waves and fall into the rising trend channel line at 127.53 as shown.
The triangle wave [iv] will then be done.
And we can expect to see a rally off that low in wave [v] of ‘C’.
Monday;
Watch for wave (d) to top out at or below 128.22.
Wave (e) will likely take a few sessions to complete.
[/vc_column_text][/vc_column][/vc_row]
[vc_row][vc_column][vc_separator border_width=”5″][/vc_column][/vc_row][vc_row][vc_column][vc_column_text]
SILVER
[/vc_column_text][/vc_column][/vc_row][vc_row][vc_column][vc_separator border_width=”5″][/vc_column][/vc_row][vc_row][vc_column width=”2/3″][vc_custom_heading text=”1 hr” use_theme_fonts=”yes”][vc_column_text]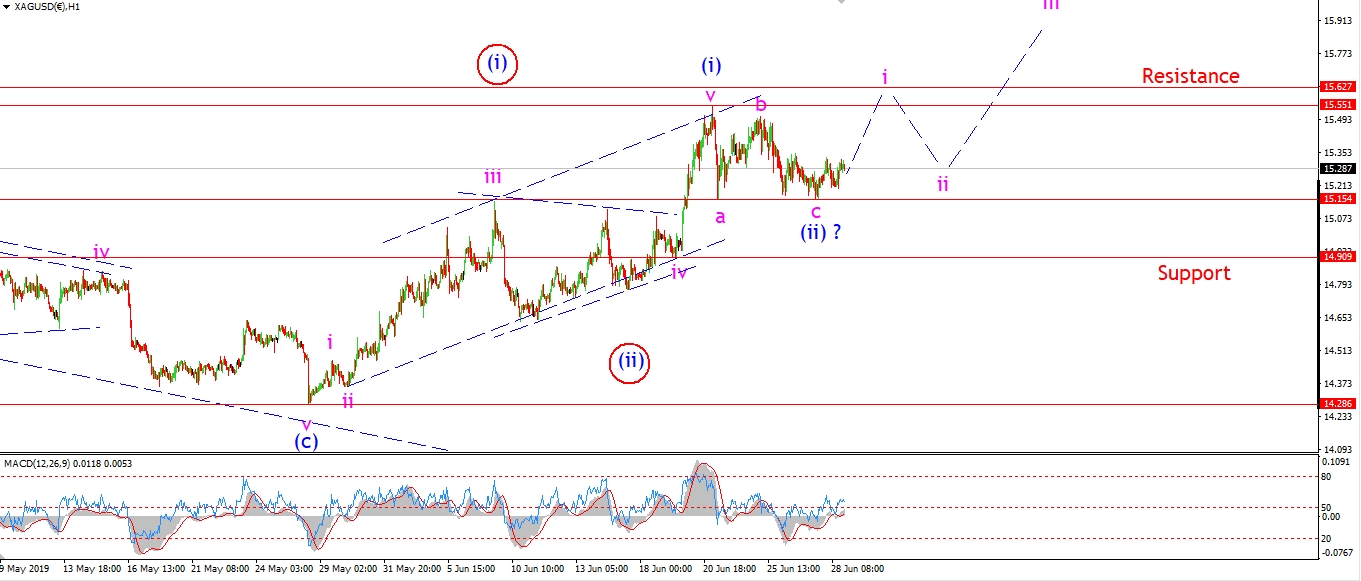 [/vc_column_text][/vc_column][vc_column width=”1/3″][vc_custom_heading text=”4 Hours” use_theme_fonts=”yes”][vc_column_text]
 [/vc_column_text][vc_custom_heading text=”Daily” use_theme_fonts=”yes”][vc_column_text]
 [/vc_column_text][/vc_column][/vc_row]
[vc_row][vc_column][vc_column_text]
Silver has traded flat today,
without much positive action to clear up the short term count so far.
The current wave count remains valid unless we get a decline below 15.15.
If that happens,
the wave (ii) will likely fall into 14.90 at the low of the previous triangle wave ‘iv’.
Both options remain bullish though,
as wave (iii) up should begin soon and carry the price far higher over the coming months.
[/vc_column_text][/vc_column][/vc_row]
[vc_row][vc_column][vc_separator border_width=”5″][/vc_column][/vc_row][vc_row][vc_column][vc_column_text]
S&P 500.
[/vc_column_text][/vc_column][/vc_row][vc_row][vc_column][vc_separator border_width=”5″][/vc_column][/vc_row][vc_row][vc_column width=”2/3″][vc_custom_heading text=”1 hr” use_theme_fonts=”yes”][vc_column_text]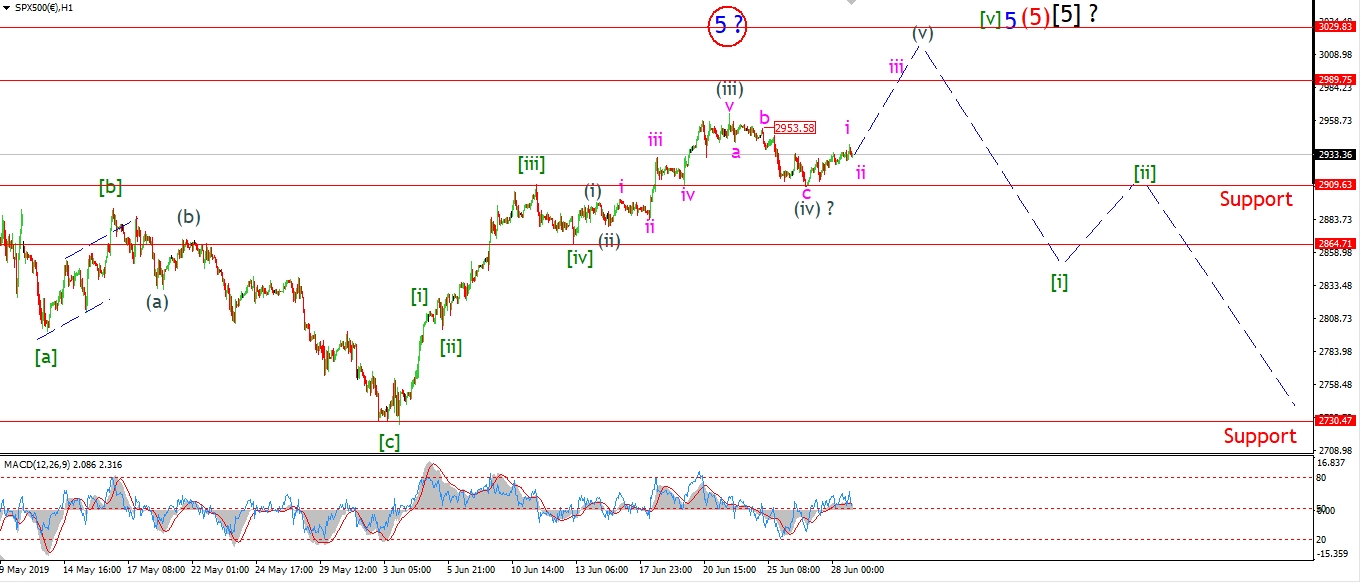 [/vc_column_text][/vc_column][vc_column width=”1/3″][vc_custom_heading text=”4 Hours” use_theme_fonts=”yes”][vc_column_text]
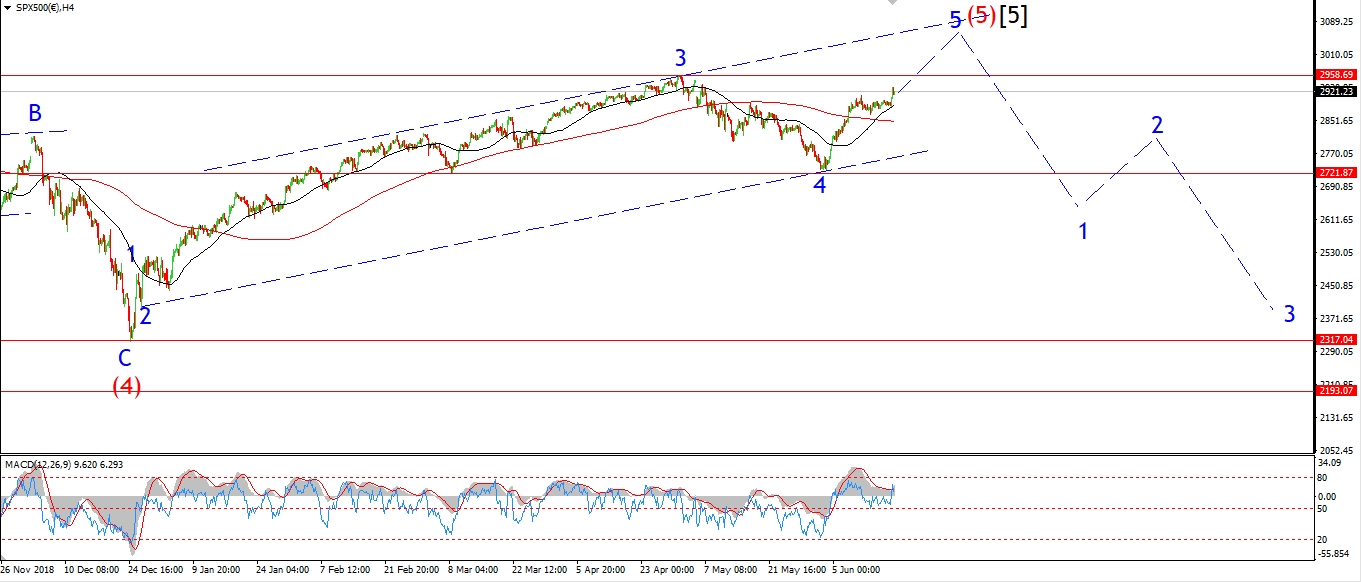 [/vc_column_text][vc_custom_heading text=”Daily” use_theme_fonts=”yes”][vc_column_text]
 [/vc_column_text][/vc_column][/vc_row]
[vc_row][vc_column][vc_column_text]
So far the S&P has drifted higher off the low at 2910,
this action is welcome,
but is less than inspiring so far.
I did expect to see a more impulsive move higher to begin wave (v).
I have labelled the rise over the last few sessions as a leading diagonal wave ‘i’.
Wave ‘ii’ should hold above 2910 next week.
And price should again push higher in wave ‘iii’ of [v] by the end of next week
once the holiday period is over.
next week;
Watch for a break of 2953 in wave ‘iii’ of (v).
2910 should hold.
That is it for the week on this end.
I wish you all an enjoyable weekend.
I will be off on my adventures next week,
to Brittany in Northern France we go,
with my little family all packed up in the car!
It should be a bit fun!
I will be back posting again on Monday the 10th as usual.
Until that time.
happy 4th of July to my American brothers and sisters!
Freedom is an awesome thing,
and I am grateful every day for mine!
God bless you all,
And God’s speed!
Enda.
[/vc_column_text][/vc_column][/vc_row]
[vc_row][vc_column][vc_separator border_width=”5″][/vc_column][/vc_row]