
[vc_row][vc_column][vc_separator border_width=”5″][/vc_column][/vc_row]
[vc_row][vc_column][vc_column_text]
I’m back!
Down to business.
[/vc_column_text][/vc_column][/vc_row]
[vc_row][vc_column][vc_separator border_width=”5″][/vc_column][/vc_row]
[vc_row][vc_column][vc_column_text]
EURUSD
[/vc_column_text][/vc_column][/vc_row]
[vc_row][vc_column][vc_separator border_width=”5″][/vc_column][/vc_row][vc_row][vc_column width=”2/3″][vc_custom_heading text=”1 hr” use_theme_fonts=”yes”][vc_column_text]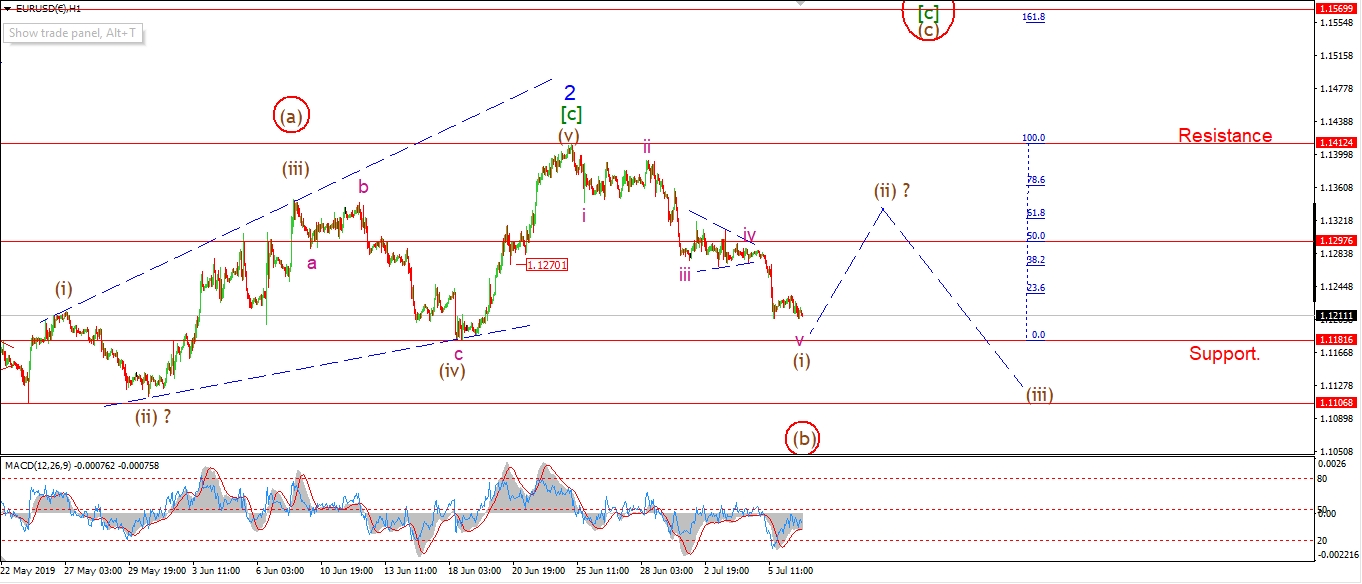 [/vc_column_text][/vc_column][vc_column width=”1/3″][vc_custom_heading text=”4 Hours” use_theme_fonts=”yes”][vc_column_text]
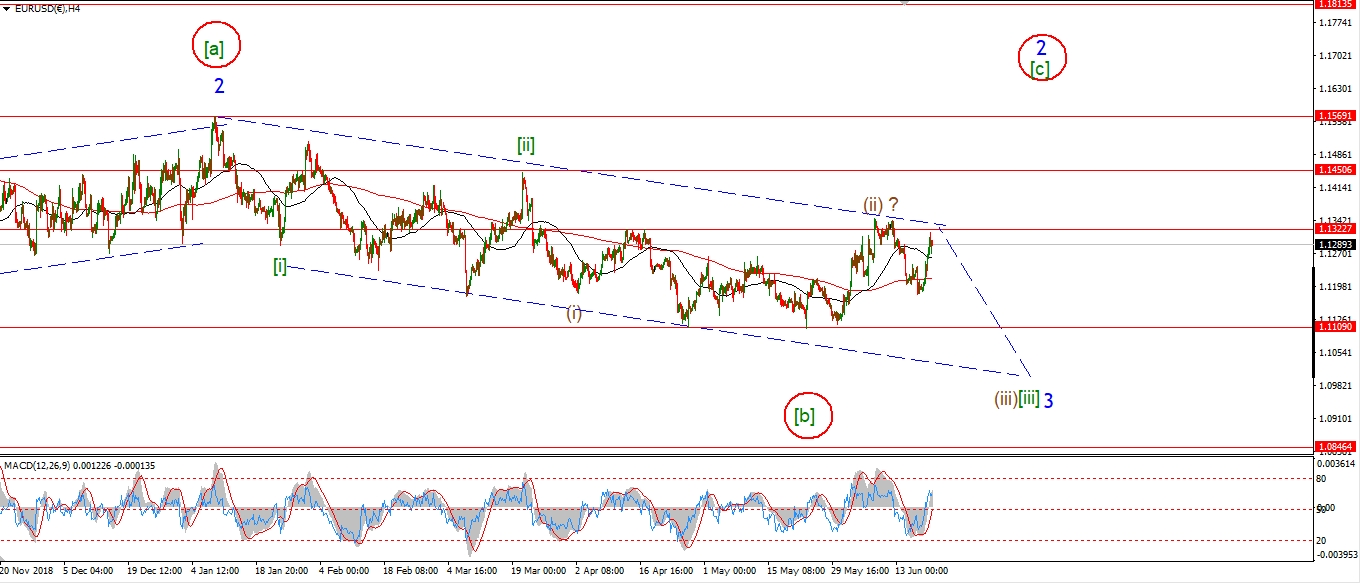 [/vc_column_text][vc_custom_heading text=”Daily” use_theme_fonts=”yes”][vc_column_text]
 [/vc_column_text][/vc_column][/vc_row]
[vc_row][vc_column][vc_column_text]
With the large decline last week in EURUSD taking a five wave form.
I have to consider that the top may be in again for wave ‘2’ blue.
If that is correct,
Then wave ‘3’ down is about to begin a long drawn out decline for the foreseeable future.
I have shown the five wave decline off the high as wave (i) down.
the structure is a reasonable five wave form.
with support at 1.1106 now close at hand,
this level should form a completion point for wave (i).
Wave (ii) should then complete a three wave corrective recovery to a lower high.
At that point we will have a trend change at hand again.
Tomorrow;
watch for wave (i) to complete at 1.1106.
Wave (ii) should reach 1.1297 at the 50% retracement level.
The alternate count shows a larger wave (b) of [c] underway.
We should know soon enough if this count is more fitting.
[/vc_column_text][/vc_column][/vc_row]
[vc_row][vc_column][vc_separator border_width=”5″][/vc_column][/vc_row][vc_row][vc_column][vc_column_text]
GBPUSD
[/vc_column_text][/vc_column][/vc_row][vc_row][vc_column][vc_separator border_width=”5″][/vc_column][/vc_row][vc_row][vc_column width=”2/3″][vc_custom_heading text=”1 hr” use_theme_fonts=”yes”][vc_column_text]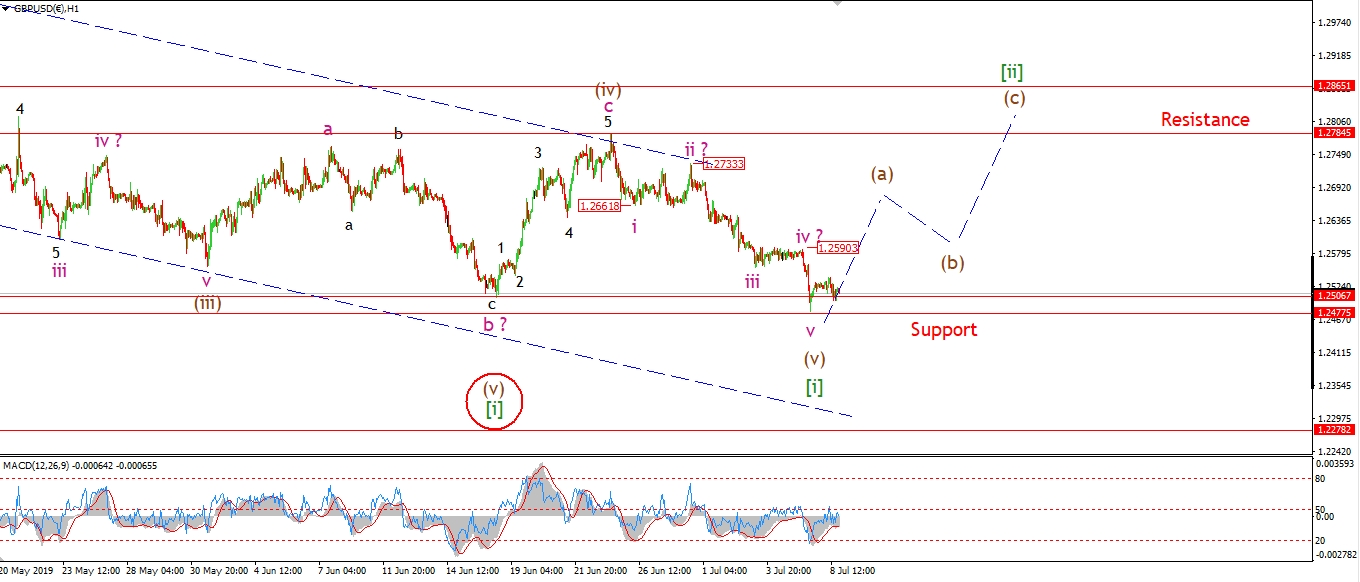 [/vc_column_text][/vc_column][vc_column width=”1/3″][vc_custom_heading text=”4 Hours” use_theme_fonts=”yes”][vc_column_text]
 [/vc_column_text][vc_custom_heading text=”Daily” use_theme_fonts=”yes”][vc_column_text]
 [/vc_column_text][/vc_column][/vc_row]
[vc_row][vc_column][vc_column_text]
Cable hit a new low last Friday right at the lower support level of 1.2477.
This level marks the December lows of wave [b] as shown on the 4hr chart.
The price has now completed a five wave structure off the high of late march,
this is labelled wave [i] down,
I am now open to a corrective recovery in wave [ii] to begin soon.
A 50% retracement from this level in wave [ii]
will carry us up to about 1.2930 over the coming weeks.
The initial target lies at the previous fourth wave at 1.2788.
Tomorrow;
It is still possible that wave (v) will break support again to complete.
We will have to wait and see on that front.
Watch for a rally back above 1.2590 again to begin wave (a) of [ii].
[/vc_column_text][/vc_column][/vc_row]
[vc_row][vc_column][vc_separator border_width=”5″][/vc_column][/vc_row][vc_row][vc_column][vc_column_text]
USDJPY
[/vc_column_text][/vc_column][/vc_row][vc_row][vc_column][vc_separator border_width=”5″][/vc_column][/vc_row][vc_row][vc_column width=”2/3″][vc_custom_heading text=”1 hr” use_theme_fonts=”yes”][vc_column_text] [/vc_column_text][/vc_column][vc_column width=”1/3″][vc_custom_heading text=”4 Hours” use_theme_fonts=”yes”][vc_column_text]
 [/vc_column_text][vc_custom_heading text=”Daily” use_theme_fonts=”yes”][vc_column_text]
 [/vc_column_text][/vc_column][/vc_row]
[vc_row][vc_column][vc_column_text]
So far so good in USDJPY!
USDJPY has now rallied again in five waves over the last week.
This is a clear signal that the tide is now turning and wave (iii) up may now be underway.
A correction in three waves to complete wave ‘ii’ is now expected.
This should complete above 107.53.
And that will clear the way for wave ‘iii’ of (iii) to rally above 110.00 again over the coming week.
Tomorrow;
Watch for wave ‘ii’ to begin with a break of 108.27.
Wave ‘ii’ should complete above 107.53 by the end of the week.
[/vc_column_text][/vc_column][/vc_row]
[vc_row][vc_column][vc_separator border_width=”5″][/vc_column][/vc_row][vc_row][vc_column][vc_column_text]
DOW JONES INDUSTRIALS
[/vc_column_text][/vc_column][/vc_row][vc_row][vc_column][vc_separator border_width=”5″][/vc_column][/vc_row][vc_row][vc_column width=”2/3″][vc_custom_heading text=”1 hr” use_theme_fonts=”yes”][vc_column_text]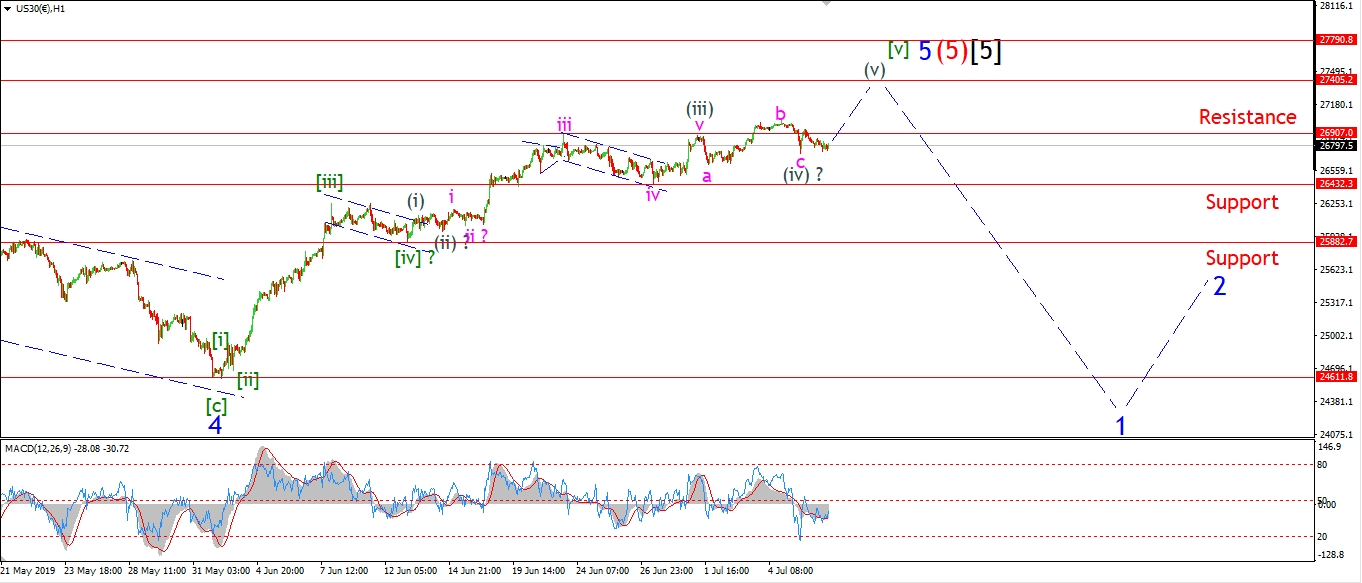 [/vc_column_text][/vc_column][vc_column width=”1/3″][vc_custom_heading text=”4 Hours” use_theme_fonts=”yes”][vc_column_text]
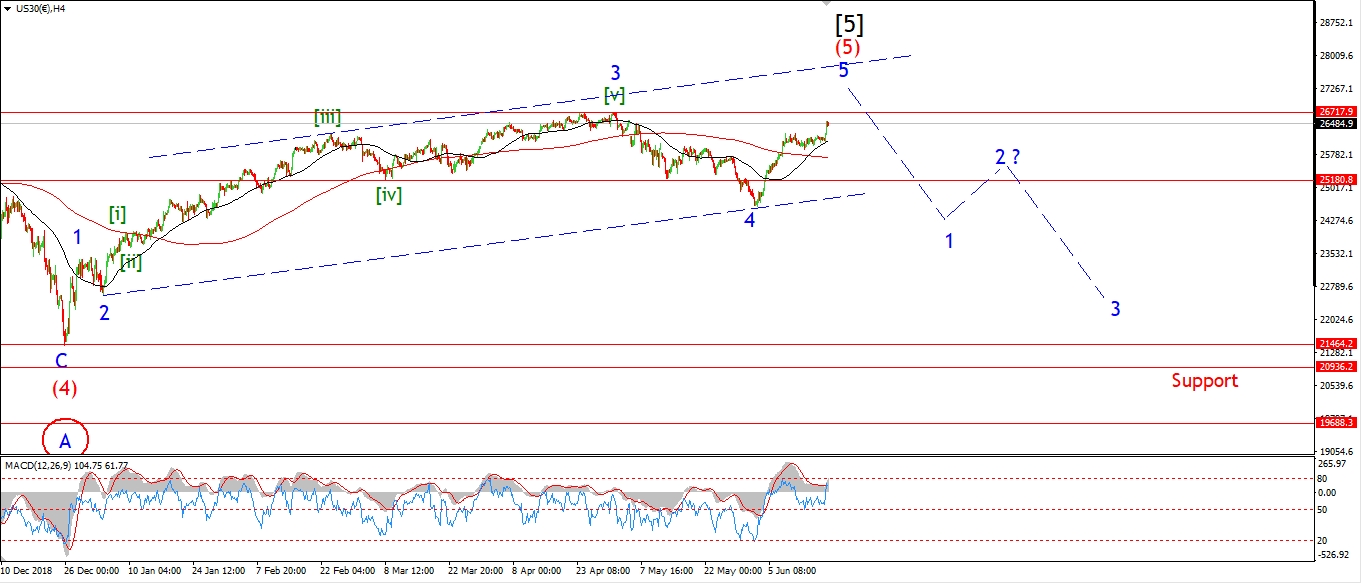 [/vc_column_text][vc_custom_heading text=”Daily” use_theme_fonts=”yes”][vc_column_text]
 [/vc_column_text][/vc_column][/vc_row]
[vc_row][vc_column][vc_column_text]
The DOW finally hit a new all time high last week.
The inflation game the fed is playing is working a treat eh!
I still figure this is the last gasp of a dying behemoth,
but there could be a little more in the tank for wave [v] yet before we turn down again into that long awaited bear-market.
The final leg up in wave ‘5’ blue is a tricky one to label.
There are a few different ways to interpret the structure.
for now,
I am looking at an extension in wave [v] green underway.
This allows for another rally in wave (v) of [v] to complete the larger structure.
Wave (iv) may be complete at Fridays low as a running flat.
A break of that low at 26725 will signal wave (iv) is extending a little more.
26430 is the next support level below that.
Wave (iv) should find a low by the end of this week though.
Tomorrow;
watch for wave 26725 to hold and wave (v) to rally again.
[/vc_column_text][/vc_column][/vc_row]
[vc_row][vc_column][vc_separator border_width=”5″][/vc_column][/vc_row][vc_row][vc_column][vc_column_text]
GOLD
[/vc_column_text][/vc_column][/vc_row][vc_row][vc_column][vc_separator border_width=”5″][/vc_column][/vc_row][vc_row][vc_column width=”2/3″][vc_custom_heading text=”1 hr” use_theme_fonts=”yes”][vc_column_text]
 [/vc_column_text][/vc_column][vc_column width=”1/3″][vc_custom_heading text=”4 Hours” use_theme_fonts=”yes”][vc_column_text]
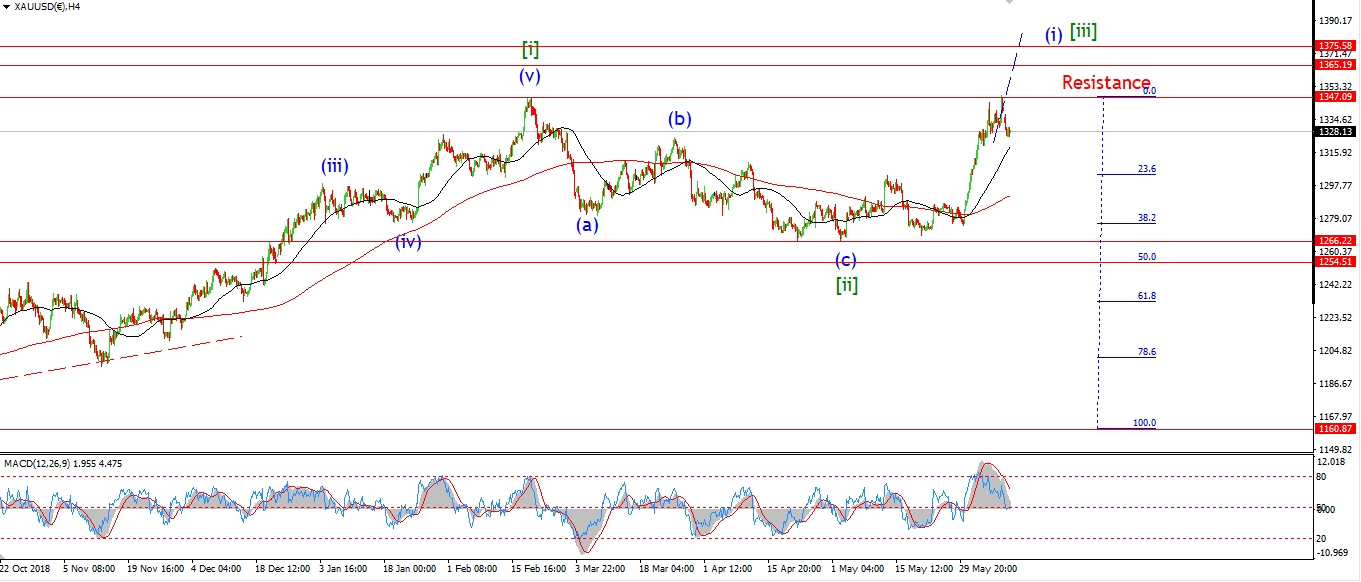 [/vc_column_text][vc_custom_heading text=”Daily” use_theme_fonts=”yes”][vc_column_text]
 [/vc_column_text][/vc_column][/vc_row]
[vc_row][vc_column][vc_column_text]
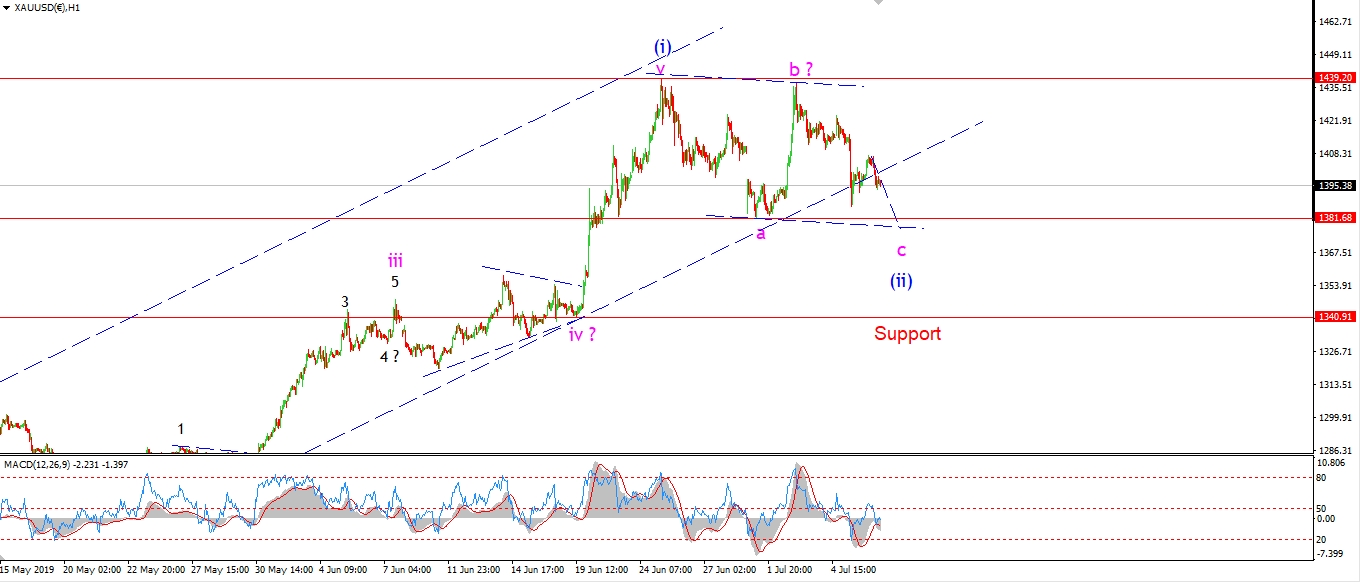
Gold has been stuck in a range over the last few weeks.
This is labelled as wave (ii) blue.
Wave (ii) is likely a large flat correction labelled ‘a,b,c’ in pink.
If this is correct,
wave ‘c’ pink is now tracing out a final five wave decline
ideally this should break 1381 again at the wave ‘a’ low to complete wave (ii).
At that point I will look for a rally again to begin wave (iii).
Tomorrow;
Watch for wave ‘c’ to break the wave ‘a’ low at 1381 and trace out a clear five wave decline.
[/vc_column_text][/vc_column][/vc_row]
[vc_row][vc_column][vc_separator border_width=”5″][/vc_column][/vc_row][vc_row][vc_column][vc_column_text]
U.S CRUDE OIL
[/vc_column_text][/vc_column][/vc_row][vc_row][vc_column][vc_separator border_width=”5″][/vc_column][/vc_row][vc_row][vc_column width=”2/3″][vc_custom_heading text=”1 hr” use_theme_fonts=”yes”][vc_column_text]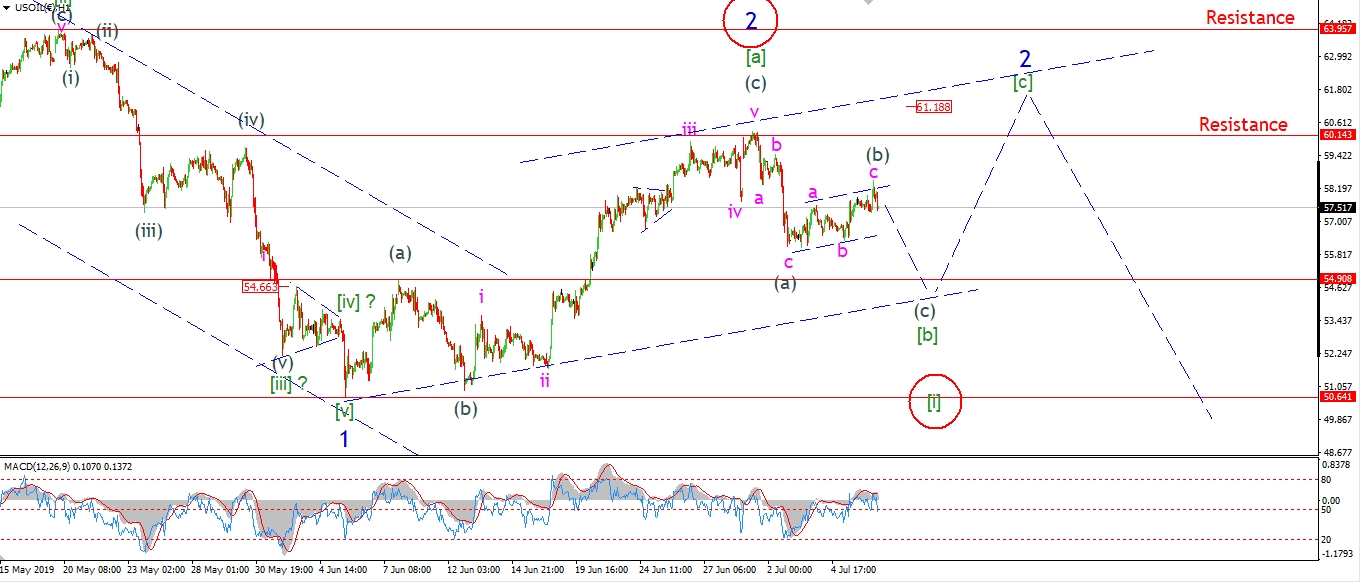 [/vc_column_text][/vc_column][vc_column width=”1/3″][vc_custom_heading text=”4 Hours” use_theme_fonts=”yes”][vc_column_text]
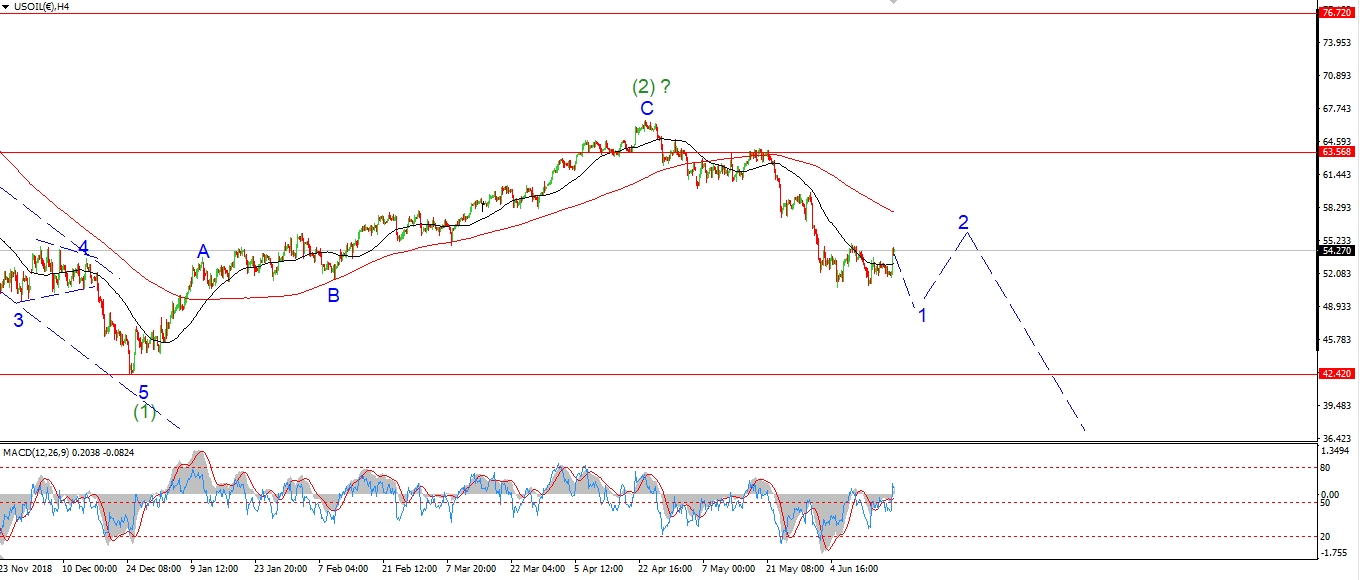 [/vc_column_text][vc_custom_heading text=”Daily” use_theme_fonts=”yes”][vc_column_text]
 [/vc_column_text][/vc_column][/vc_row]
[vc_row][vc_column][vc_column_text]
I am viewing this decline in crude as a large wave [b] of ‘2’ as shown.
These recent three wave rise over the last week is labelled wave (b) of [b].
Wave (c) down is now expected to carry price to support at 54.90 again to complete wave [b].
The price should then rally again in wave [c] of ‘2’ as shown.
The alternate count shown labelled the recent high at $60 as wave ‘2’ complete.
If we get a clear five wave decline off that high,
that action will favor the alternate count.
Tomorrow;
watch for wave (c) to continue lower towards 55.00 again for the rest of the week.
[/vc_column_text][/vc_column][/vc_row]
[vc_row][vc_column][vc_separator border_width=”5″][/vc_column][/vc_row][vc_row][vc_column][vc_column_text]
US 10 yr Treasuries.
[/vc_column_text][/vc_column][/vc_row][vc_row][vc_column][vc_separator border_width=”5″][/vc_column][/vc_row][vc_row][vc_column width=”2/3″][vc_custom_heading text=”1 hr” use_theme_fonts=”yes”][vc_column_text]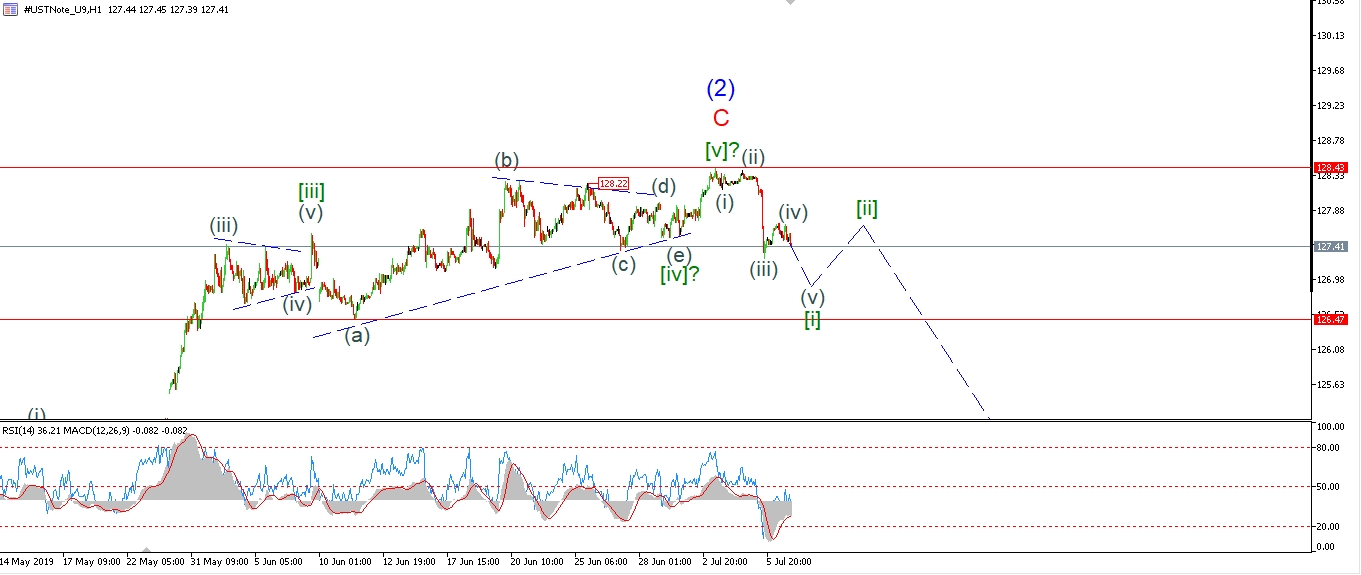 [/vc_column_text][/vc_column][vc_column width=”1/3″][vc_custom_heading text=”4 Hours” use_theme_fonts=”yes”][vc_column_text]
 [/vc_column_text][vc_custom_heading text=”Daily” use_theme_fonts=”yes”][vc_column_text]
 [/vc_column_text][/vc_column][/vc_row]
[vc_row][vc_column][vc_column_text]
The turn down in Bonds last week may have begun wave ‘3’ down sooner than expected.
The price rallied out of the triangle as expected,
then last week brought a complete retracement of that rally.
Price is now closing below the wave [iv] lows.
The price has not yet created a five wave decline off wave ‘2’,
but that should happen this week.
A bearish Elliott wave signal may be on the cards for next week now.
Tomorrow;
Watch for wave [i] to continue lower and trace out a clear five wave decline
before correcting higher in wave [ii] later this week.
[/vc_column_text][/vc_column][/vc_row]
[vc_row][vc_column][vc_separator border_width=”5″][/vc_column][/vc_row][vc_row][vc_column][vc_column_text]
SILVER
[/vc_column_text][/vc_column][/vc_row][vc_row][vc_column][vc_separator border_width=”5″][/vc_column][/vc_row][vc_row][vc_column width=”2/3″][vc_custom_heading text=”1 hr” use_theme_fonts=”yes”][vc_column_text]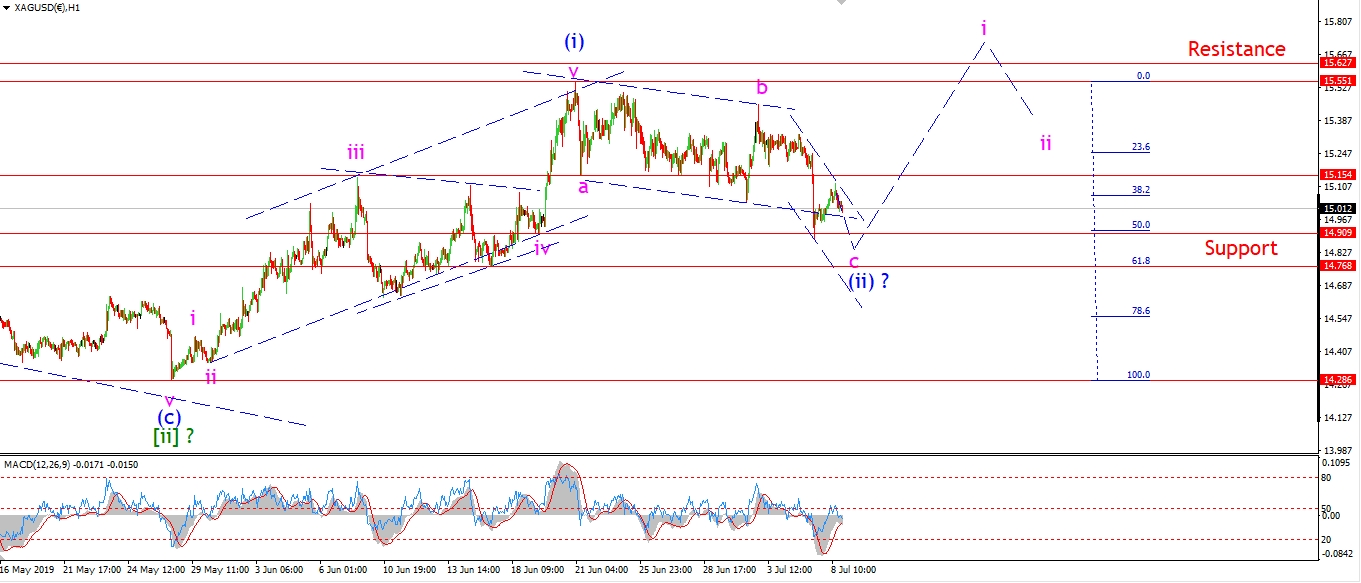 [/vc_column_text][/vc_column][vc_column width=”1/3″][vc_custom_heading text=”4 Hours” use_theme_fonts=”yes”][vc_column_text]
 [/vc_column_text][vc_custom_heading text=”Daily” use_theme_fonts=”yes”][vc_column_text]
 [/vc_column_text][/vc_column][/vc_row]
[vc_row][vc_column][vc_column_text]
I have shown this decline in silver as wave ‘c’ of (ii) also this evening.
As with Gold,
Silver is tracing out a five wave decline in wave ‘c’
to complete a 3,3,5 overall structure in a flat correction.
Wave ‘c’ should hit about 14.80 again before finding a final low and turning higher in wave (iii).
The price is hovering just above the 50% retracement level of wave (i) now.
The 62% retracement level lies at 14.76.
Tomorrow;
Watch for wave ‘c’ to complete soon.
Wave (iii) up is set to begin this week once wave ‘c’ is out of the way.
[/vc_column_text][/vc_column][/vc_row]
[vc_row][vc_column][vc_separator border_width=”5″][/vc_column][/vc_row][vc_row][vc_column][vc_column_text]
S&P 500.
[/vc_column_text][/vc_column][/vc_row][vc_row][vc_column][vc_separator border_width=”5″][/vc_column][/vc_row][vc_row][vc_column width=”2/3″][vc_custom_heading text=”1 hr” use_theme_fonts=”yes”][vc_column_text]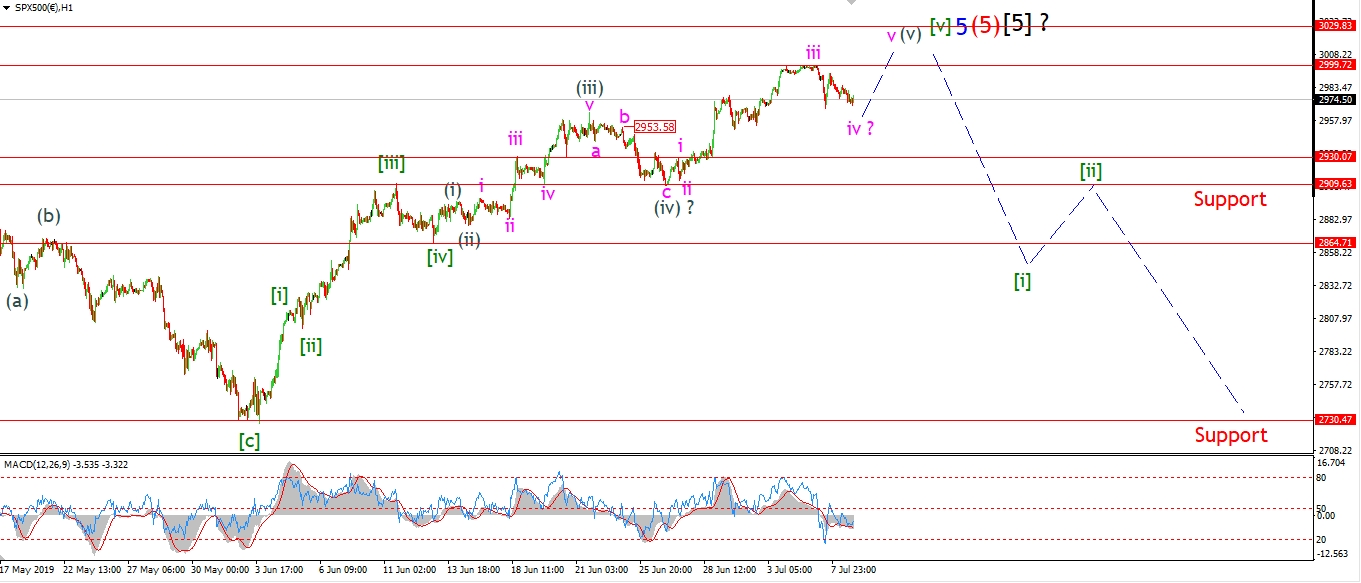 [/vc_column_text][/vc_column][vc_column width=”1/3″][vc_custom_heading text=”4 Hours” use_theme_fonts=”yes”][vc_column_text]
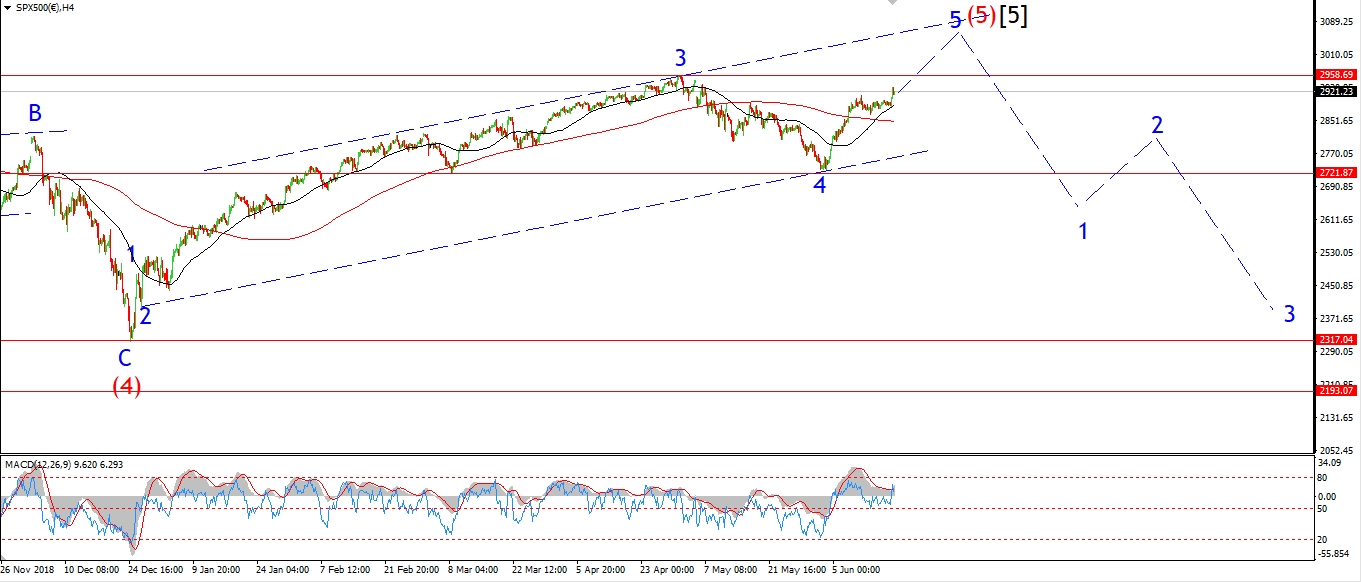 [/vc_column_text][vc_custom_heading text=”Daily” use_theme_fonts=”yes”][vc_column_text]
 [/vc_column_text][/vc_column][/vc_row]
[vc_row][vc_column][vc_column_text]
The S&P is faltering at that 3000 level now as we trace out the last few internal waves up in wave ‘5’ blue.
The market seems to be correcting lower in three waves over the last few sessions.
This is labelled as wave ‘iv’ pink,
and this short term count allows for another run at 3000 again in wave ‘v’ pink to complete the larger structure.
If the market holds above Fridays lows and turns higher again tomorrow,
That will signal wave ‘v’ has already begun.
Tomorrow;
Watch for wave ‘iv’ to complete a three wave correction above 2930 at wave ‘i’ pink.
Wave ‘v’ is likely to carry us higher again towards the end of the week.
[/vc_column_text][/vc_column][/vc_row]
[vc_row][vc_column][vc_separator border_width=”5″][/vc_column][/vc_row]