
[vc_row][vc_column][vc_separator border_width=”5″][/vc_column][/vc_row]
[vc_row][vc_column][vc_column_text]
Hi there everyone.
[/vc_column_text][/vc_column][/vc_row]
[vc_row][vc_column][vc_separator border_width=”5″][/vc_column][/vc_row]
[vc_row][vc_column][vc_column_text]
EURUSD
[/vc_column_text][/vc_column][/vc_row]
[vc_row][vc_column][vc_separator border_width=”5″][/vc_column][/vc_row][vc_row][vc_column width=”2/3″][vc_custom_heading text=”1 hr” use_theme_fonts=”yes”][vc_column_text]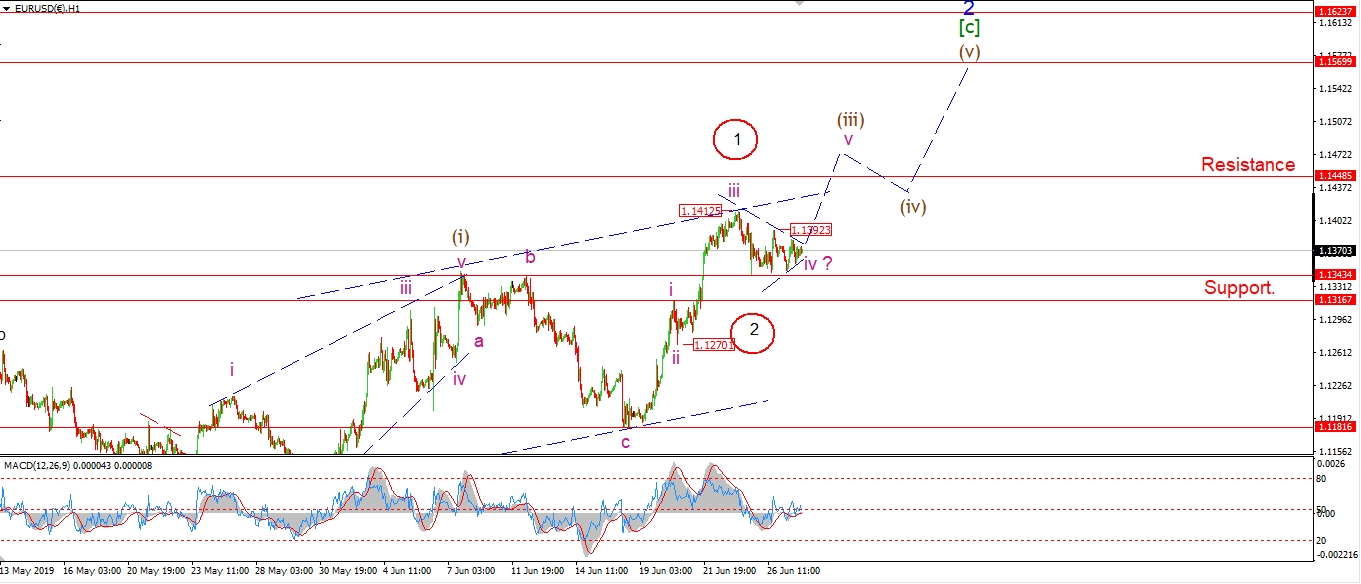 [/vc_column_text][/vc_column][vc_column width=”1/3″][vc_custom_heading text=”4 Hours” use_theme_fonts=”yes”][vc_column_text]
 [/vc_column_text][vc_custom_heading text=”Daily” use_theme_fonts=”yes”][vc_column_text]
 [/vc_column_text][/vc_column][/vc_row]
[vc_row][vc_column][vc_column_text]
Another day without the rally in wave ‘v’,
but the price is inching higher none the less.
I have shown a possible triangle as the next best interpretation for wave ‘iv’ pink.
This wave form must hold above 1.1343 to remain valid as a triangle.
And then we must expect a rally above 1.1412 at a minimum in wave ‘v’.
Tomorrow;
Watch for price to push above 1.1392 to signal that wave ‘v’ has begun.
[/vc_column_text][/vc_column][/vc_row]
[vc_row][vc_column][vc_separator border_width=”5″][/vc_column][/vc_row][vc_row][vc_column][vc_column_text]
GBPUSD
[/vc_column_text][/vc_column][/vc_row][vc_row][vc_column][vc_separator border_width=”5″][/vc_column][/vc_row][vc_row][vc_column width=”2/3″][vc_custom_heading text=”1 hr” use_theme_fonts=”yes”][vc_column_text] [/vc_column_text][/vc_column][vc_column width=”1/3″][vc_custom_heading text=”4 Hours” use_theme_fonts=”yes”][vc_column_text]
 [/vc_column_text][vc_custom_heading text=”Daily” use_theme_fonts=”yes”][vc_column_text]
 [/vc_column_text][/vc_column][/vc_row]
[vc_row][vc_column][vc_column_text]
Cable did create a slight new high at 1.2724 in wave ‘ii’ this morning.
This completes a three wave rise to a lower high,
and the price is falling again this evening.
The low of wave ‘i’ is on the verge of breaking this evening.
If we see a spike lower tomorrow which pushes down into the 1.25 handle
that will signal wave ‘iii’ of (v) has begun.
The current action is also explained well by the alternate count.
So I cant rule this out yet.
Tomorrow;
Watch for wave ‘iii’ for (v) to continue lower towards the minimum target at 1.2506.
[/vc_column_text][/vc_column][/vc_row]
[vc_row][vc_column][vc_separator border_width=”5″][/vc_column][/vc_row][vc_row][vc_column][vc_column_text]
USDJPY
[/vc_column_text][/vc_column][/vc_row][vc_row][vc_column][vc_separator border_width=”5″][/vc_column][/vc_row][vc_row][vc_column width=”2/3″][vc_custom_heading text=”1 hr” use_theme_fonts=”yes”][vc_column_text]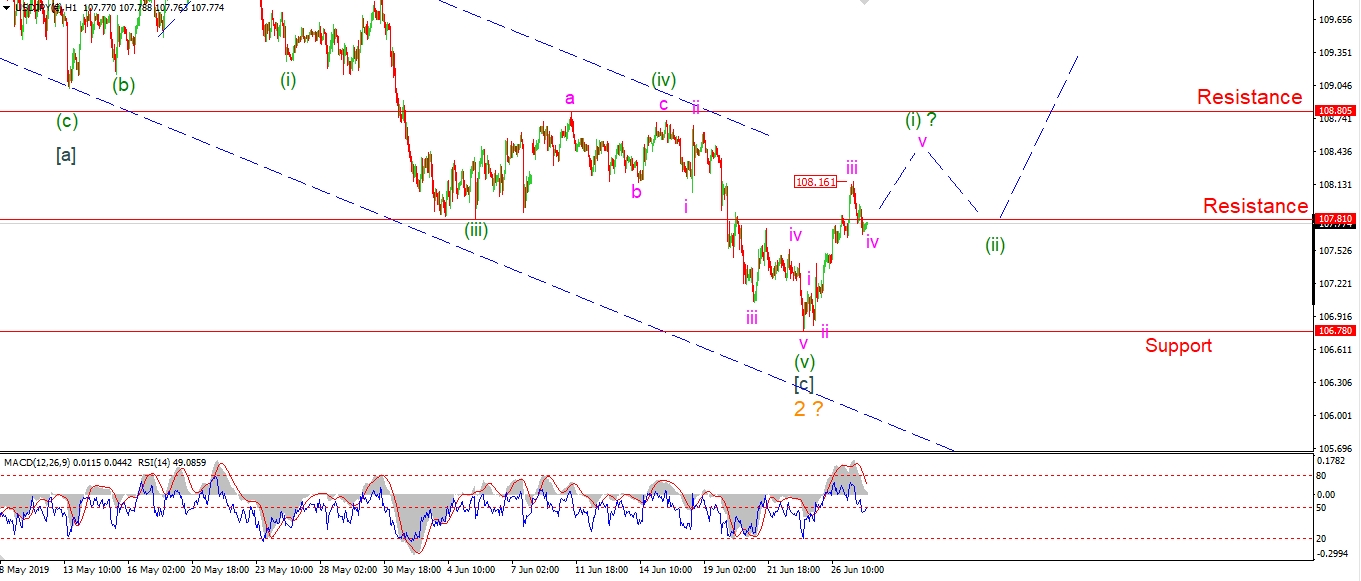 [/vc_column_text][/vc_column][vc_column width=”1/3″][vc_custom_heading text=”4 Hours” use_theme_fonts=”yes”][vc_column_text]
 [/vc_column_text][vc_custom_heading text=”Daily” use_theme_fonts=”yes”][vc_column_text]
 [/vc_column_text][/vc_column][/vc_row]
[vc_row][vc_column][vc_column_text]
The overnight trade brought USDJPY up to 108.16 at the top.
This is a positive move for the bullish outlook,
as wave (i) has now broken the initial resistance formed by the previous wave (iii).
Price is now falling again off that high in a possible wave ‘iv’ pink.
A three wave pattern has already formed in wave ‘iv’
so this correction may well complete soon.
A rally above the wave ‘iii’ high at 108.16 will confirm wave ‘v’.
Tomorrow;
Watch for wave ‘iv’ to find a low soon and then return higher in wave ‘v’ of (i).
[/vc_column_text][/vc_column][/vc_row]
[vc_row][vc_column][vc_separator border_width=”5″][/vc_column][/vc_row][vc_row][vc_column][vc_column_text]
DOW JONES INDUSTRIALS
[/vc_column_text][/vc_column][/vc_row][vc_row][vc_column][vc_separator border_width=”5″][/vc_column][/vc_row][vc_row][vc_column width=”2/3″][vc_custom_heading text=”1 hr” use_theme_fonts=”yes”][vc_column_text]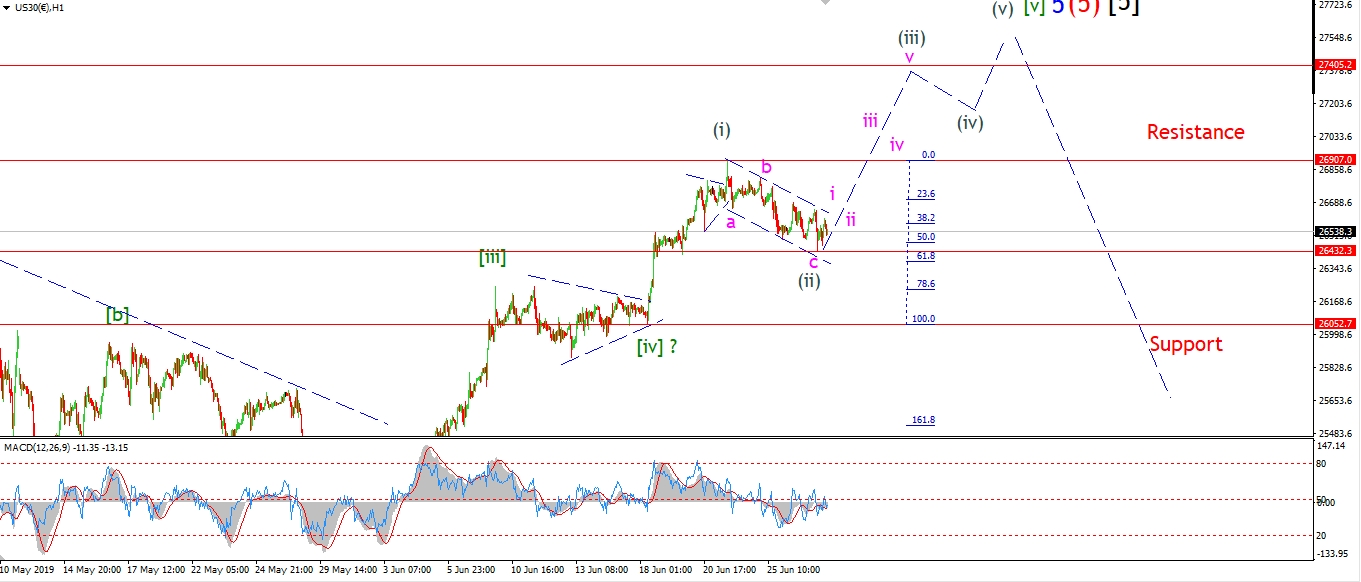 [/vc_column_text][/vc_column][vc_column width=”1/3″][vc_custom_heading text=”4 Hours” use_theme_fonts=”yes”][vc_column_text]
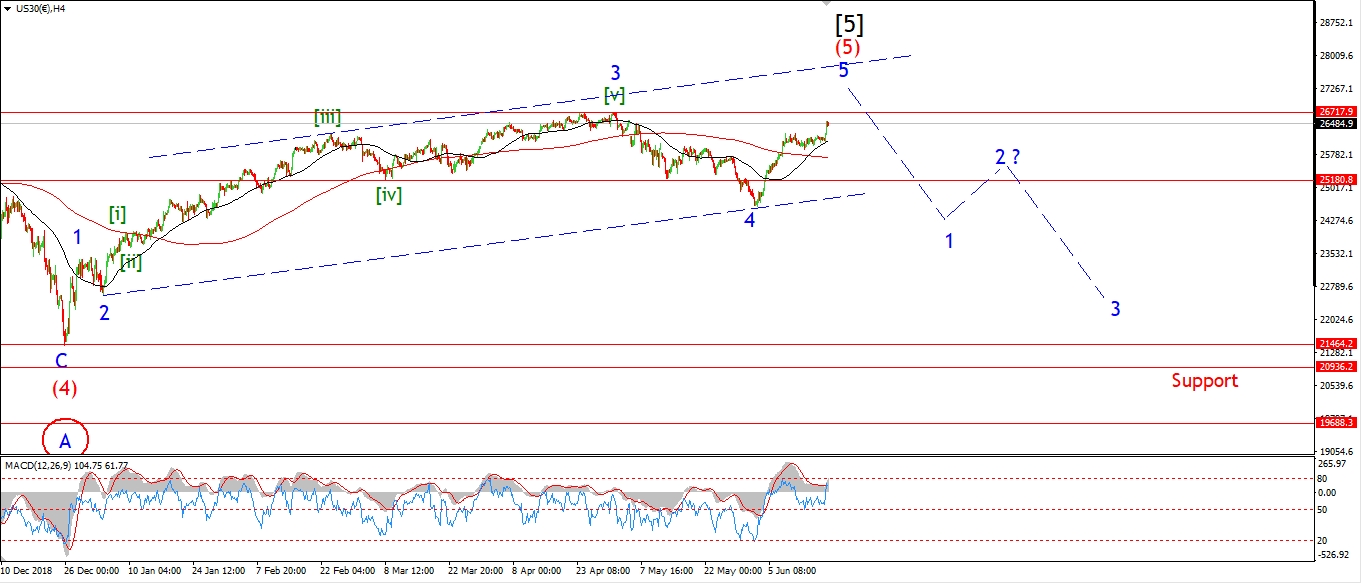 [/vc_column_text][vc_custom_heading text=”Daily” use_theme_fonts=”yes”][vc_column_text]
 [/vc_column_text][/vc_column][/vc_row]
[vc_row][vc_column][vc_column_text]
Although the Dow has not rallied just yet to begin wave (iii).
I do expect that to begin very soon.
The action off the high labelled wave (i) is very corrective looking so far,
There is very little conviction evident in the selling.
Wave (ii) has now hit the 50% retracement of wave (i)
which is a common retracement level,
and the price is holding above that low this evening.
It looks like the DOW is setting up for a rally now to take us to a new all time high.
A new high that will not last long I believe.
Tomorrow;
Wave (iii) should begin tomorrow with a spike higher in wave ‘i’
and then a bullish higher low in wave ‘ii’.
[/vc_column_text][/vc_column][/vc_row]
[vc_row][vc_column][vc_separator border_width=”5″][/vc_column][/vc_row][vc_row][vc_column][vc_column_text]
GOLD
[/vc_column_text][/vc_column][/vc_row][vc_row][vc_column][vc_separator border_width=”5″][/vc_column][/vc_row][vc_row][vc_column width=”2/3″][vc_custom_heading text=”1 hr” use_theme_fonts=”yes”][vc_column_text]
 [/vc_column_text][/vc_column][vc_column width=”1/3″][vc_custom_heading text=”4 Hours” use_theme_fonts=”yes”][vc_column_text]
 [/vc_column_text][vc_custom_heading text=”Daily” use_theme_fonts=”yes”][vc_column_text]
 [/vc_column_text][/vc_column][/vc_row]
[vc_row][vc_column][vc_column_text]
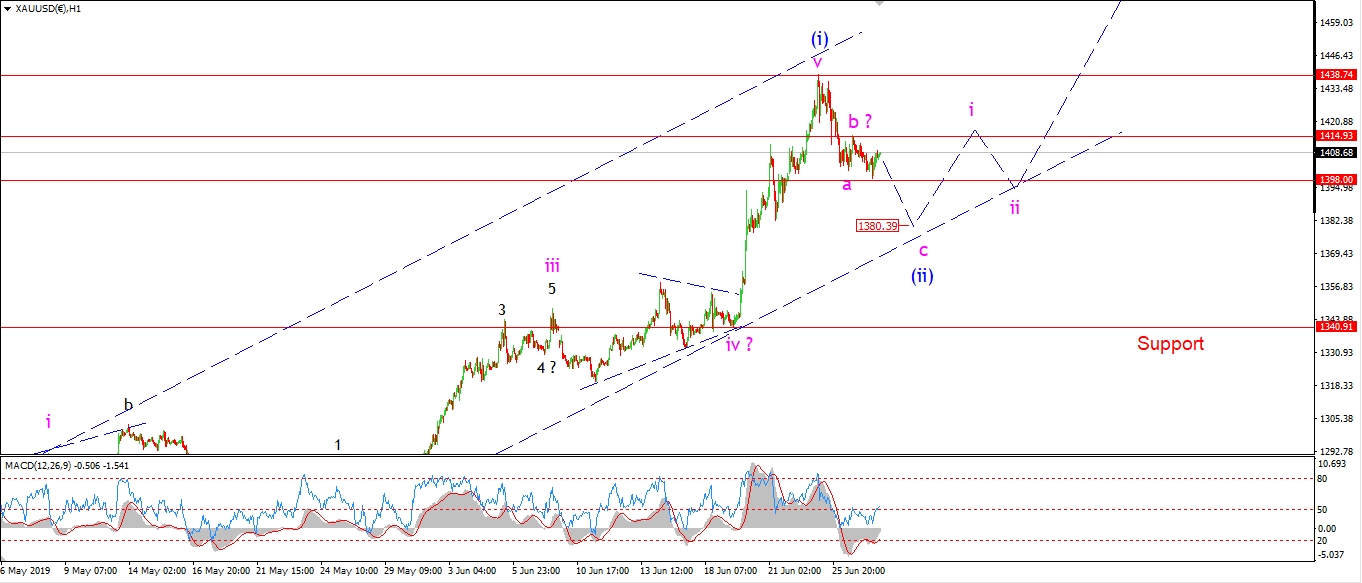
Gold is falling again off a very short lived wave ‘b’ high at 1414.
I did expect wave ‘b’ to create a larger structure.
And it is still possible that this new low is part of a larger wave ‘b’,
but I will just have to wait and see on that front.
The price is falling now, so wave ‘c’ is more likely than not!
Wave ‘c’ will reach equality with wave ‘a’ at 1380,
and the rising trend channel is right in that area also.
So the target for wave (ii) is on track now.
Tomorrow;
Watch for wave ‘c’ to continue lower towards that lower trend channel line.
Wave ‘c’ could complete by tomorrow evening.
[/vc_column_text][/vc_column][/vc_row]
[vc_row][vc_column][vc_separator border_width=”5″][/vc_column][/vc_row][vc_row][vc_column][vc_column_text]
U.S CRUDE OIL
[/vc_column_text][/vc_column][/vc_row][vc_row][vc_column][vc_separator border_width=”5″][/vc_column][/vc_row][vc_row][vc_column width=”2/3″][vc_custom_heading text=”1 hr” use_theme_fonts=”yes”][vc_column_text]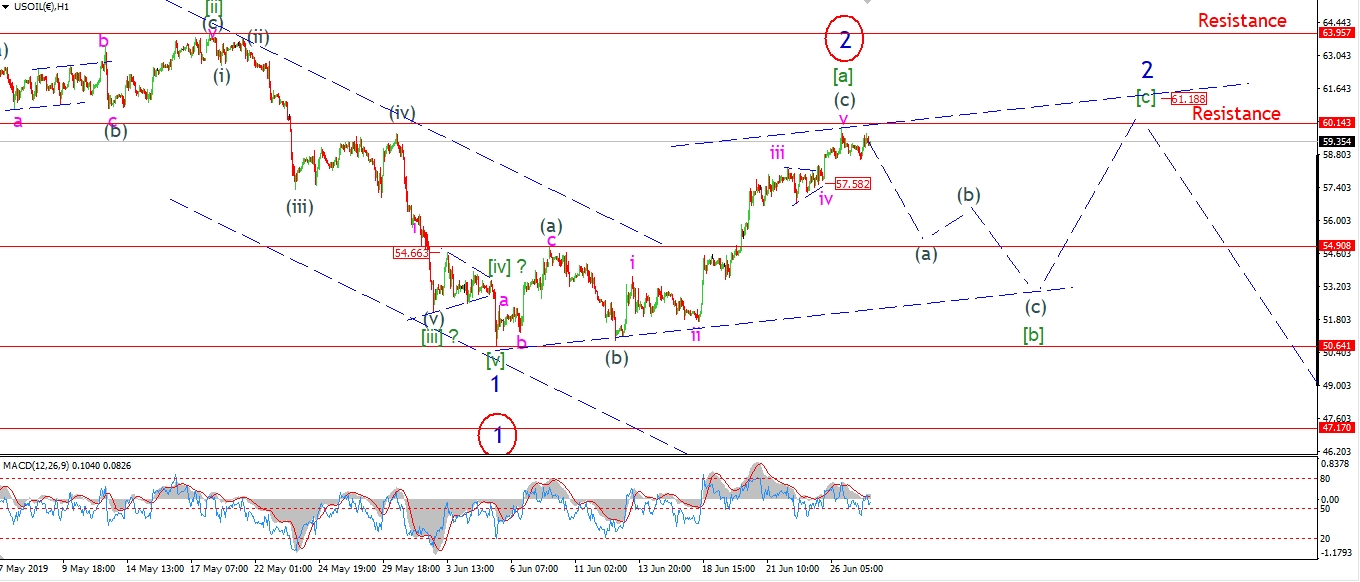 [/vc_column_text][/vc_column][vc_column width=”1/3″][vc_custom_heading text=”4 Hours” use_theme_fonts=”yes”][vc_column_text]
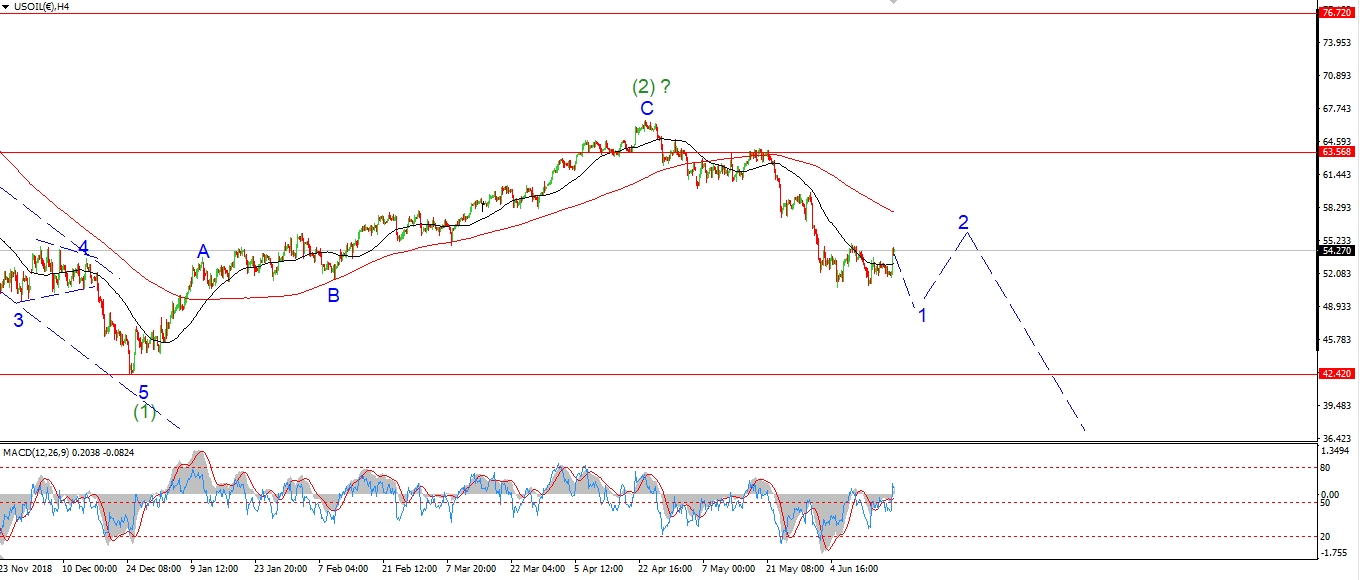 [/vc_column_text][vc_custom_heading text=”Daily” use_theme_fonts=”yes”][vc_column_text]
 [/vc_column_text][/vc_column][/vc_row]
[vc_row][vc_column][vc_column_text]
Crude is holding onto the highs for dear life this evening.
But I think the price is about to give way soon in wave [b] as shown.
The price is still below Wednesdays high so far,
so I am taking the view that wave (a) of [b] is now underway.
A decline below 57.00 again will likely confirm wave (a).
Tomorrow;
Watch for resistance to hold at 60.14.
Wave (a) should move lower pretty rapidly when it does begin.
A break of the previous triangle low at 57.58
will be the first sign that wave (a) has begun.
[/vc_column_text][/vc_column][/vc_row]
[vc_row][vc_column][vc_separator border_width=”5″][/vc_column][/vc_row][vc_row][vc_column][vc_column_text]
US 10 yr Treasuries.
[/vc_column_text][/vc_column][/vc_row][vc_row][vc_column][vc_separator border_width=”5″][/vc_column][/vc_row][vc_row][vc_column width=”2/3″][vc_custom_heading text=”1 hr” use_theme_fonts=”yes”][vc_column_text] [/vc_column_text][/vc_column][vc_column width=”1/3″][vc_custom_heading text=”4 Hours” use_theme_fonts=”yes”][vc_column_text]
 [/vc_column_text][vc_custom_heading text=”Daily” use_theme_fonts=”yes”][vc_column_text]
 [/vc_column_text][/vc_column][/vc_row]
[vc_row][vc_column][vc_column_text]
The 10YR created a slight new low this morning with a break of 127.45.
The triangle idea for wave [iv] is still in play though,
wave (c) of [iv] has just extended into a larger structure and that wave completed at 127.36 today.
The rally off that low is viewed as wave (d),
and this should complete below 128.22 tomorrow.
Wave (e) will complete the larger triangle and then we can expect wave [v] of ‘C’ to begin.
Tomorrow;
The price range should continue to contract into early next week.
Watch for wave (d) to complete tomorrow.
[/vc_column_text][/vc_column][/vc_row]
[vc_row][vc_column][vc_separator border_width=”5″][/vc_column][/vc_row][vc_row][vc_column][vc_column_text]
SILVER
[/vc_column_text][/vc_column][/vc_row][vc_row][vc_column][vc_separator border_width=”5″][/vc_column][/vc_row][vc_row][vc_column width=”2/3″][vc_custom_heading text=”1 hr” use_theme_fonts=”yes”][vc_column_text]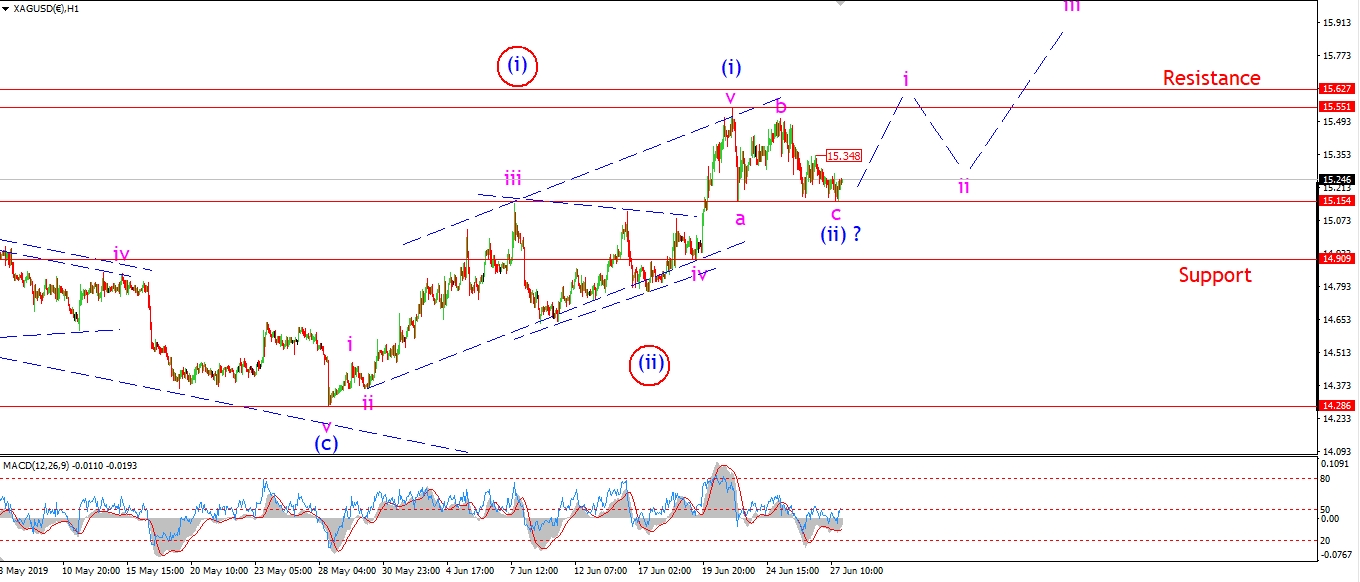 [/vc_column_text][/vc_column][vc_column width=”1/3″][vc_custom_heading text=”4 Hours” use_theme_fonts=”yes”][vc_column_text]
 [/vc_column_text][vc_custom_heading text=”Daily” use_theme_fonts=”yes”][vc_column_text]
 [/vc_column_text][/vc_column][/vc_row]
[vc_row][vc_column][vc_column_text]
Silver actually hit the 15.15 level at the low of the day today.
this was the minimum target for wave ‘c’ of (ii).
So I think we can begin to look for a turn higher now to begin wave (iii).
The action over the last week is the picture of a corrective move,
it was choppy and overlapping with very little conviction behind it.
so I expect this decline to be fully retraced to the upside next week
as wave (iii) begins.
Tomorrow;
Lets see if wave ‘i’ of (iii) now begins off 15.15.
We should be looking for a bullish higher low to complete next week in waves ‘i’ and ‘ii’.
[/vc_column_text][/vc_column][/vc_row]
[vc_row][vc_column][vc_separator border_width=”5″][/vc_column][/vc_row][vc_row][vc_column][vc_column_text]
S&P 500.
[/vc_column_text][/vc_column][/vc_row][vc_row][vc_column][vc_separator border_width=”5″][/vc_column][/vc_row][vc_row][vc_column width=”2/3″][vc_custom_heading text=”1 hr” use_theme_fonts=”yes”][vc_column_text]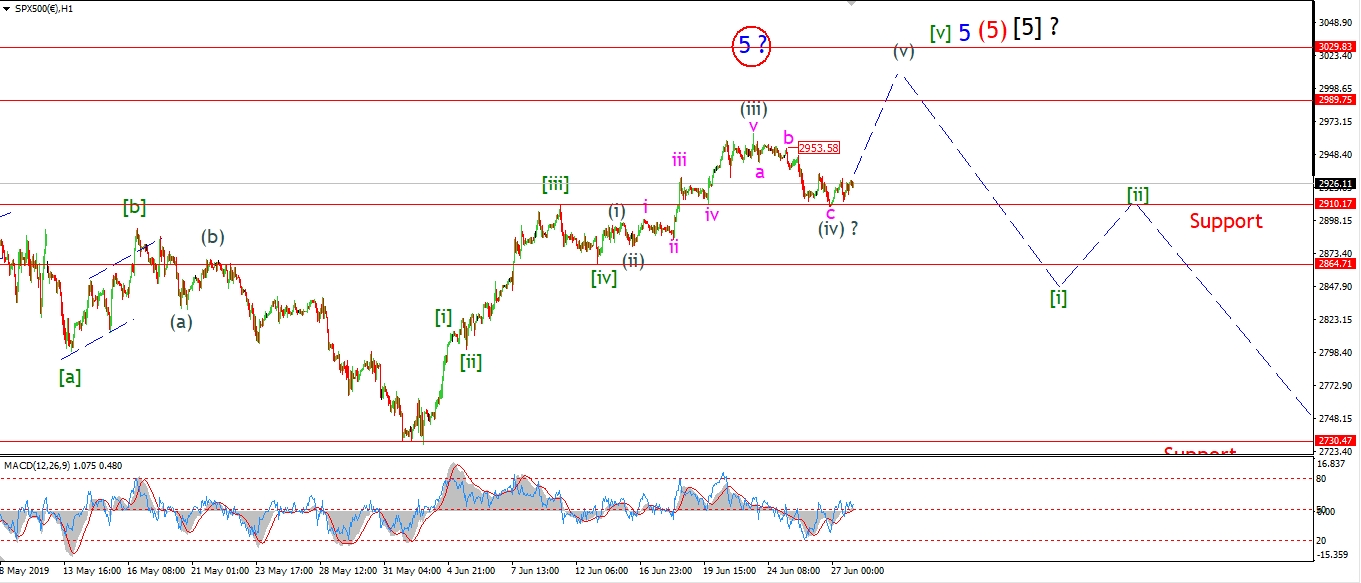 [/vc_column_text][/vc_column][vc_column width=”1/3″][vc_custom_heading text=”4 Hours” use_theme_fonts=”yes”][vc_column_text]
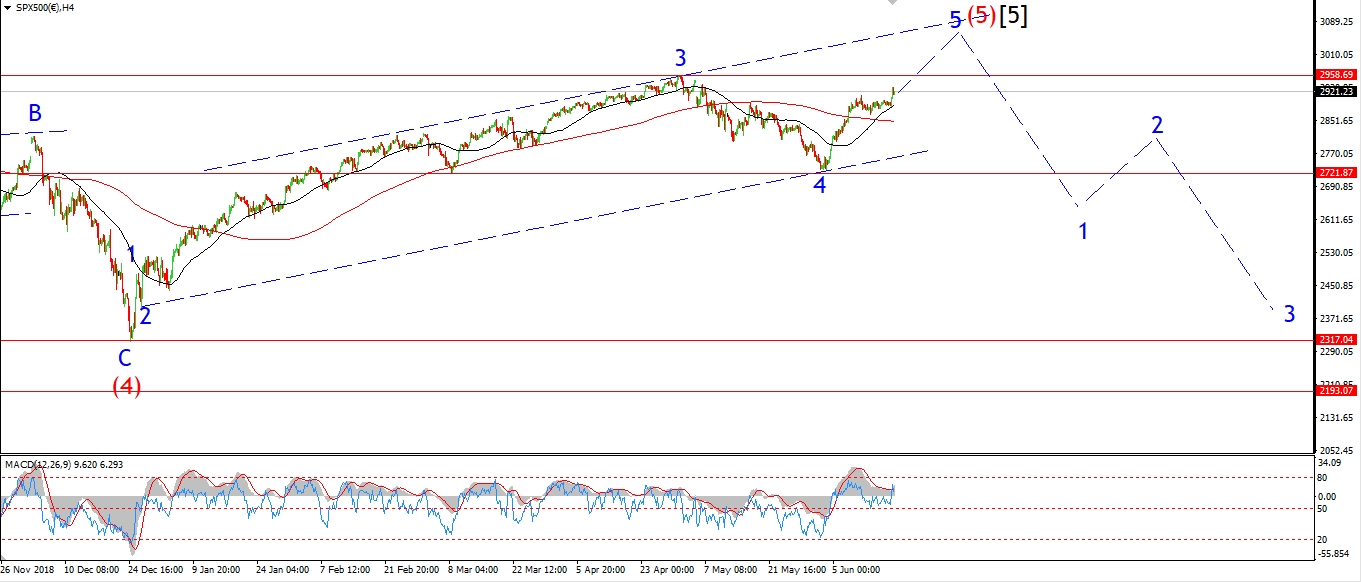 [/vc_column_text][vc_custom_heading text=”Daily” use_theme_fonts=”yes”][vc_column_text]
 [/vc_column_text][/vc_column][/vc_row]
[vc_row][vc_column][vc_column_text]
The S&P is up slightly off the low created last night.
So it is possible that wave (v) is now underway.
Price must hold above 2910 for this short tern count to remain valid.
If we take the wave ‘b’ high at 2953,
then wave ‘c’ has a clear five wave decline in place off that level.
So this suggests wave (iv) is now complete
and the price should rally from here in wave (v).
A final run up above 3000 is not crucial to the larger pattern,
but it would definitely complete the bull market with a fitting ceremonial number so to say!
So lets see if we can kick off that final run up tomorrow.
Tomorrow;
watch for wave (v) to begin off 2910.
A break above 2953 should confirm wave (v) has begun.
[/vc_column_text][/vc_column][/vc_row]
[vc_row][vc_column][vc_separator border_width=”5″][/vc_column][/vc_row]