
[vc_row][vc_column][vc_separator border_width=”5″][/vc_column][/vc_row]
[vc_row][vc_column][vc_column_text]
Good evening all.
Some house-keeping first.
I will be heading off for a few weeks camping with the Family on the first week of July.
So,
I will not be posting any nightly analysis from the 1st to the 5th of July.
I will pick up the ball again on the 8th from the campsite bar,
or where ever the best wifi connection is!
It’s the time of year for a break from the markets, and news for a few days to try to clear my head, recharge, and then start a-fresh!
Ok, lets get into it.
[/vc_column_text][/vc_column][/vc_row]
[vc_row][vc_column][vc_separator border_width=”5″][/vc_column][/vc_row]
[vc_row][vc_column][vc_column_text]
EURUSD
[/vc_column_text][/vc_column][/vc_row]
[vc_row][vc_column][vc_separator border_width=”5″][/vc_column][/vc_row][vc_row][vc_column width=”2/3″][vc_custom_heading text=”1 hr” use_theme_fonts=”yes”][vc_column_text]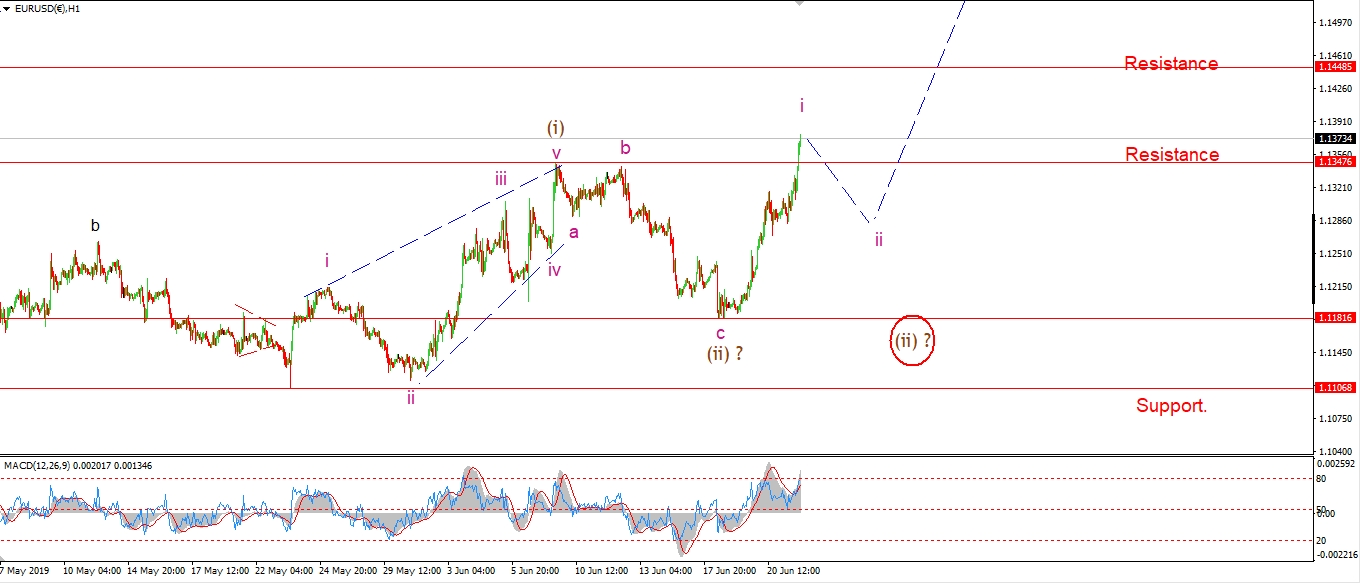 [/vc_column_text][/vc_column][vc_column width=”1/3″][vc_custom_heading text=”4 Hours” use_theme_fonts=”yes”][vc_column_text]
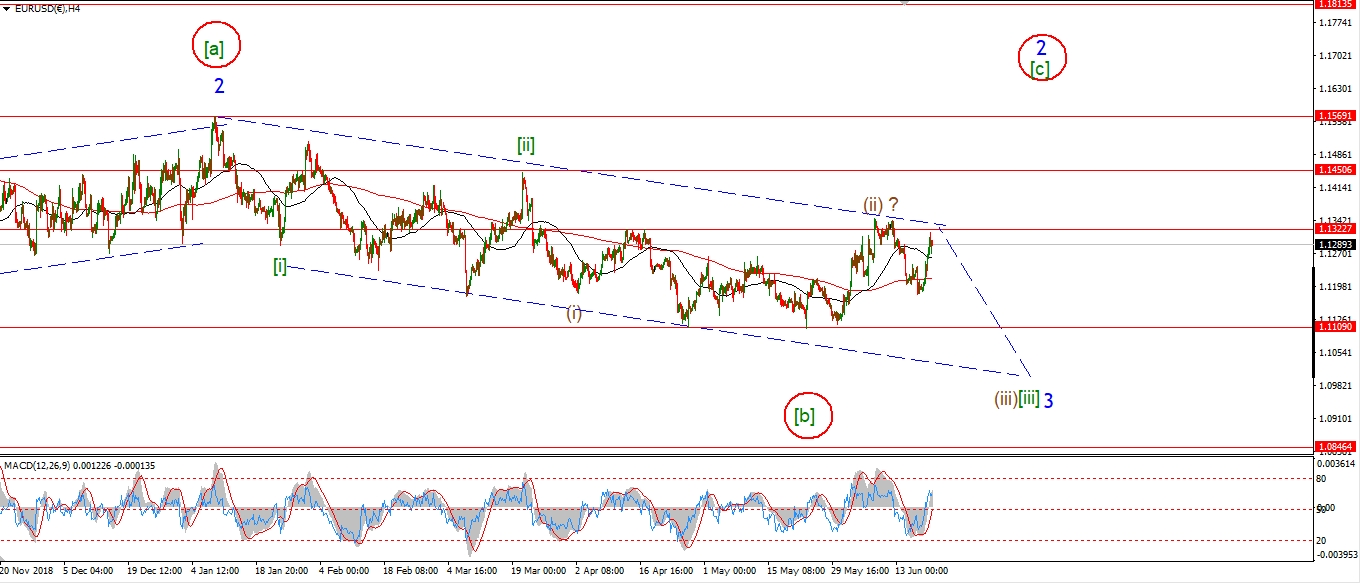 [/vc_column_text][vc_custom_heading text=”Daily” use_theme_fonts=”yes”][vc_column_text]
 [/vc_column_text][/vc_column][/vc_row]
[vc_row][vc_column][vc_column_text]
I have switched to the alternate count this evening in EURUSD.
In the video I recorded earlier,
the price was on the verge of breaking above resistance.
Which has now happened, and this action warrants a consideration of the alternate count.
Wave ‘2’ blue is now still in force.
The rise off the recent low is now viewed as the beginning of wave [c] of ‘2’.
This rally should continue up to 1.1570 at a minimum.
And wave [c] should trace out a five wave pattern overall.
Wave (i) and (ii) are possibly complete this week.
And wave (iii) of [c] is now underway.
Monday;
Watch for Wave (iii) to continue higher over the coming week.
Wave ‘ii’ of (iii) should correct to about 1.1250 on Monday.
That will create an opportunity to enter long into wave ‘iii’ of (iii) of [c].
[/vc_column_text][/vc_column][/vc_row]
[vc_row][vc_column][vc_separator border_width=”5″][/vc_column][/vc_row][vc_row][vc_column][vc_column_text]
GBPUSD
[/vc_column_text][/vc_column][/vc_row][vc_row][vc_column][vc_separator border_width=”5″][/vc_column][/vc_row][vc_row][vc_column width=”2/3″][vc_custom_heading text=”1 hr” use_theme_fonts=”yes”][vc_column_text]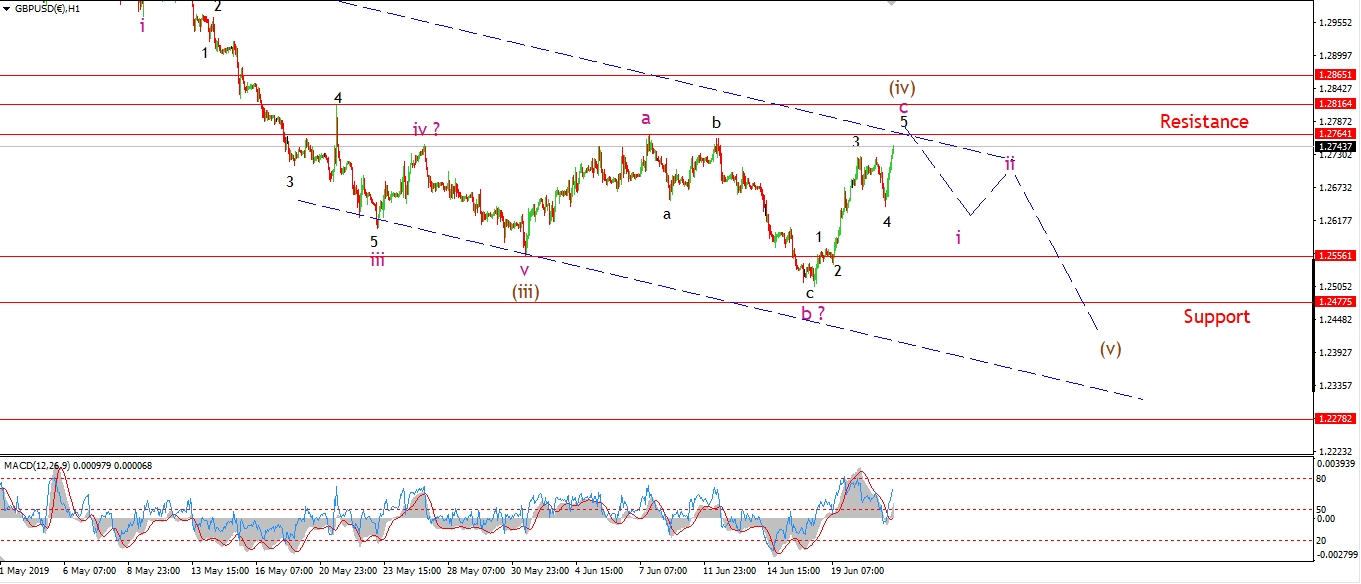 [/vc_column_text][/vc_column][vc_column width=”1/3″][vc_custom_heading text=”4 Hours” use_theme_fonts=”yes”][vc_column_text]
 [/vc_column_text][vc_custom_heading text=”Daily” use_theme_fonts=”yes”][vc_column_text]
 [/vc_column_text][/vc_column][/vc_row]
[vc_row][vc_column][vc_column_text]
Cable is on the rise today after a three wave correction overnight in wave ‘4’.
The price is now rising in wave ‘5’ of ‘c’.
Wave (iv) should complete on Monday below 1.2865.
And then we should head lower again into wave (v) of [i].
Monday;
Watch for wave ‘c’ to complete at resistance.
Waves ‘i’ and ‘ii’ should create a lower high by Tuesday evening.
[/vc_column_text][/vc_column][/vc_row]
[vc_row][vc_column][vc_separator border_width=”5″][/vc_column][/vc_row][vc_row][vc_column][vc_column_text]
USDJPY
[/vc_column_text][/vc_column][/vc_row][vc_row][vc_column][vc_separator border_width=”5″][/vc_column][/vc_row][vc_row][vc_column width=”2/3″][vc_custom_heading text=”1 hr” use_theme_fonts=”yes”][vc_column_text]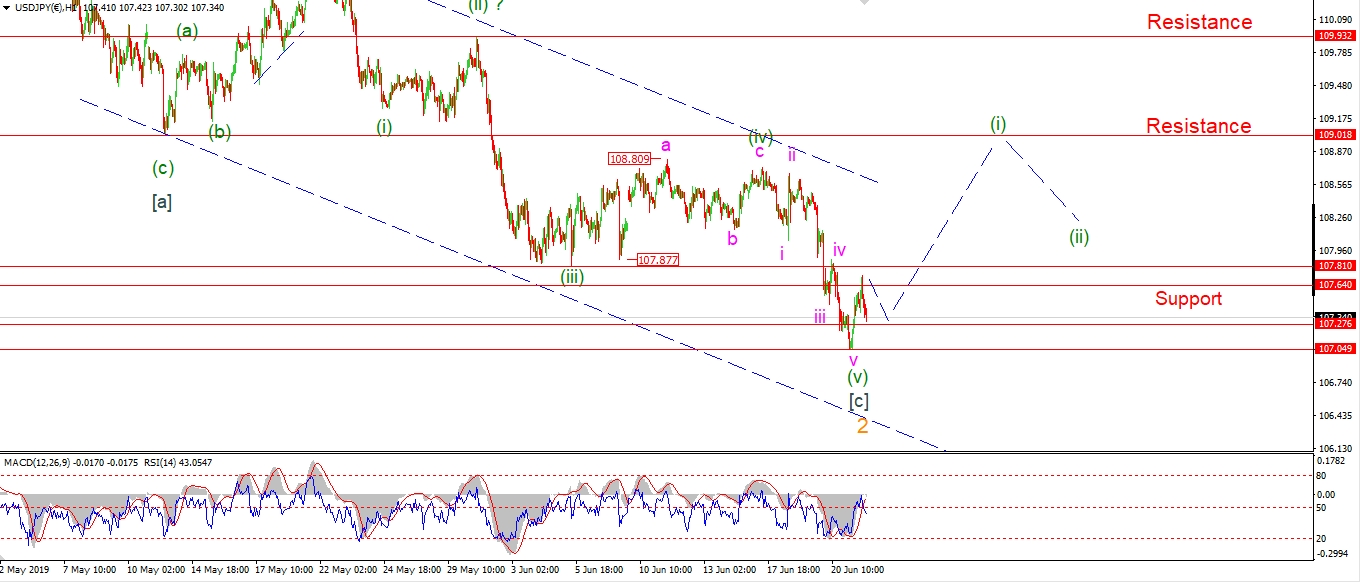 [/vc_column_text][/vc_column][vc_column width=”1/3″][vc_custom_heading text=”4 Hours” use_theme_fonts=”yes”][vc_column_text]
 [/vc_column_text][vc_custom_heading text=”Daily” use_theme_fonts=”yes”][vc_column_text]
 [/vc_column_text][/vc_column][/vc_row]
[vc_row][vc_column][vc_column_text]
USDJPY is creating some interesting action again this evening.
The price hit the lower target level at 107.27,
And then rallied off that level with a nice bullish spike.
The price is again dropping off the high this evening.
If we hold above the low created overnight at 107.04 on Monday,
and then rally in five waves over the coming week.
Then we are on course to create a bullish higher low at wave (ii).
And wave (iii) up could be quite powerful.
Monday;
Watch for a bullish turn higher in five waves to begin next week in wave (i) green.
[/vc_column_text][/vc_column][/vc_row]
[vc_row][vc_column][vc_separator border_width=”5″][/vc_column][/vc_row][vc_row][vc_column][vc_column_text]
DOW JONES INDUSTRIALS
[/vc_column_text][/vc_column][/vc_row][vc_row][vc_column][vc_separator border_width=”5″][/vc_column][/vc_row][vc_row][vc_column width=”2/3″][vc_custom_heading text=”1 hr” use_theme_fonts=”yes”][vc_column_text]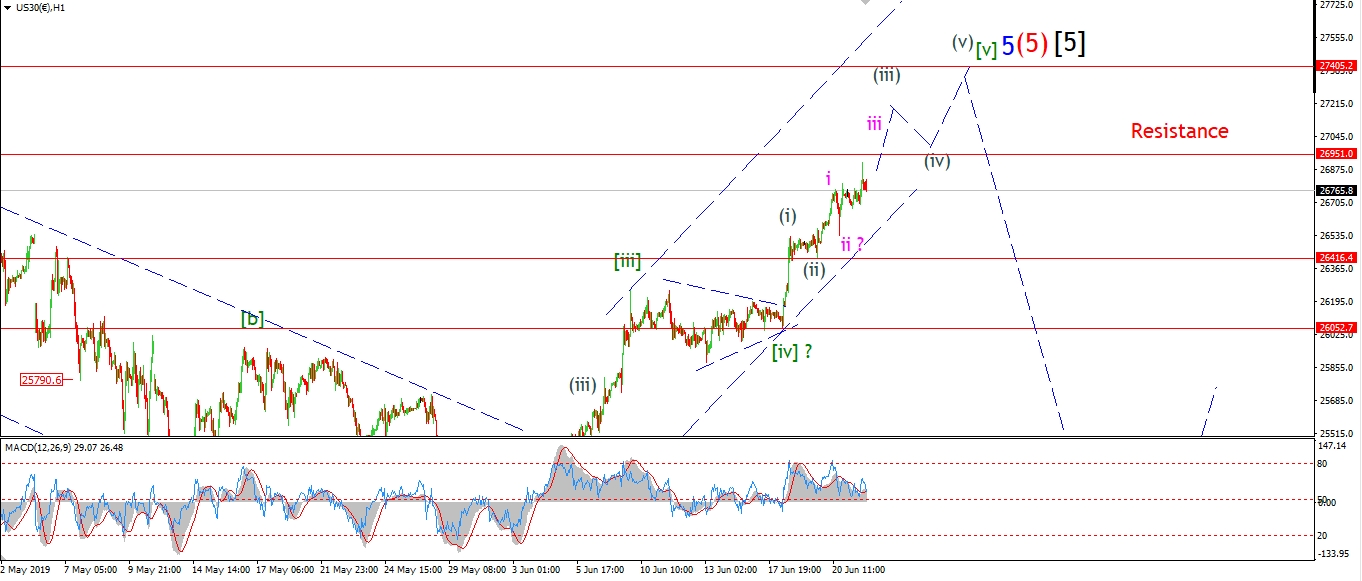 [/vc_column_text][/vc_column][vc_column width=”1/3″][vc_custom_heading text=”4 Hours” use_theme_fonts=”yes”][vc_column_text]
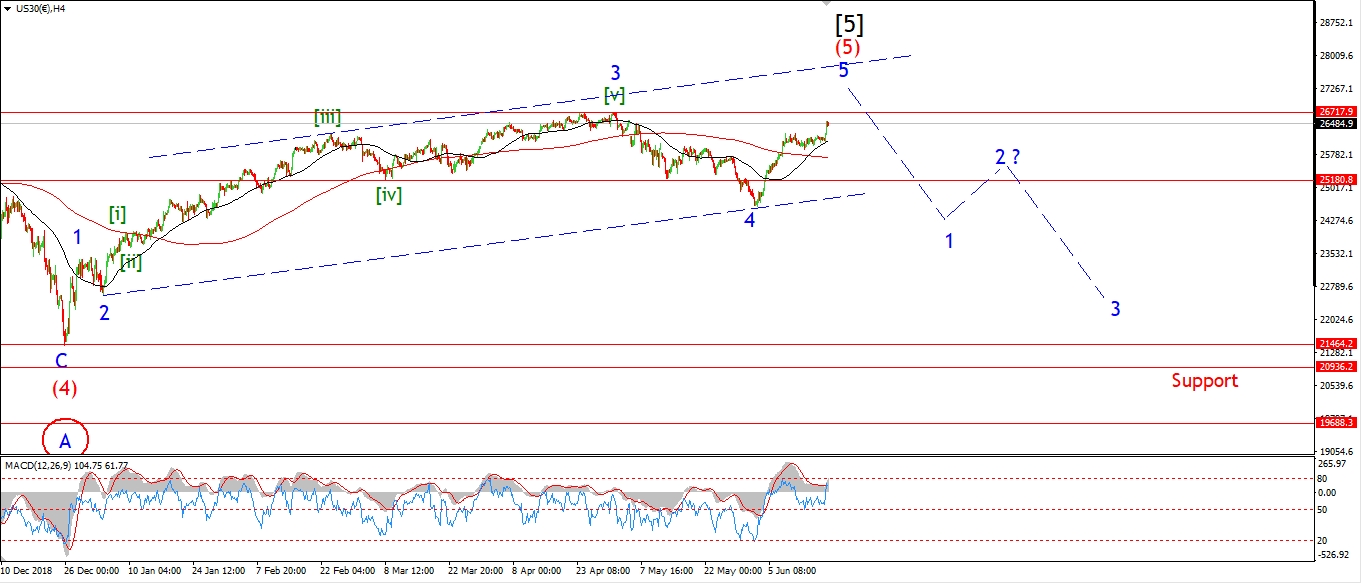 [/vc_column_text][vc_custom_heading text=”Daily” use_theme_fonts=”yes”][vc_column_text]
 [/vc_column_text][/vc_column][/vc_row]
[vc_row][vc_column][vc_column_text]
The DOW came within a whisker of creating a new all time high today,
reaching a up to 26908.
The market has cooled off this evening,
but this action should prove corrective within in wave ‘iii’ pink.
If wave (iii) grey is in force now,
then the price must hold above the low of wave (ii) at 26416 early next week.
The next few weeks looks bullish as wave [v] green completes.
There is an interesting target at 27800,
this is where wave (5) red reaches equality with wave (1) red.
Where wave (1) red is the initial move off the 2009 low,
the move which began this bull market 10 years ago!
Back to the present.
Monday;
Watch for wave (ii) to hold at 26416.
Wave (iii) should carry to a new all time high next week.
[/vc_column_text][/vc_column][/vc_row]
[vc_row][vc_column][vc_separator border_width=”5″][/vc_column][/vc_row][vc_row][vc_column][vc_column_text]
GOLD
[/vc_column_text][/vc_column][/vc_row][vc_row][vc_column][vc_separator border_width=”5″][/vc_column][/vc_row][vc_row][vc_column width=”2/3″][vc_custom_heading text=”1 hr” use_theme_fonts=”yes”][vc_column_text]
 [/vc_column_text][/vc_column][vc_column width=”1/3″][vc_custom_heading text=”4 Hours” use_theme_fonts=”yes”][vc_column_text]
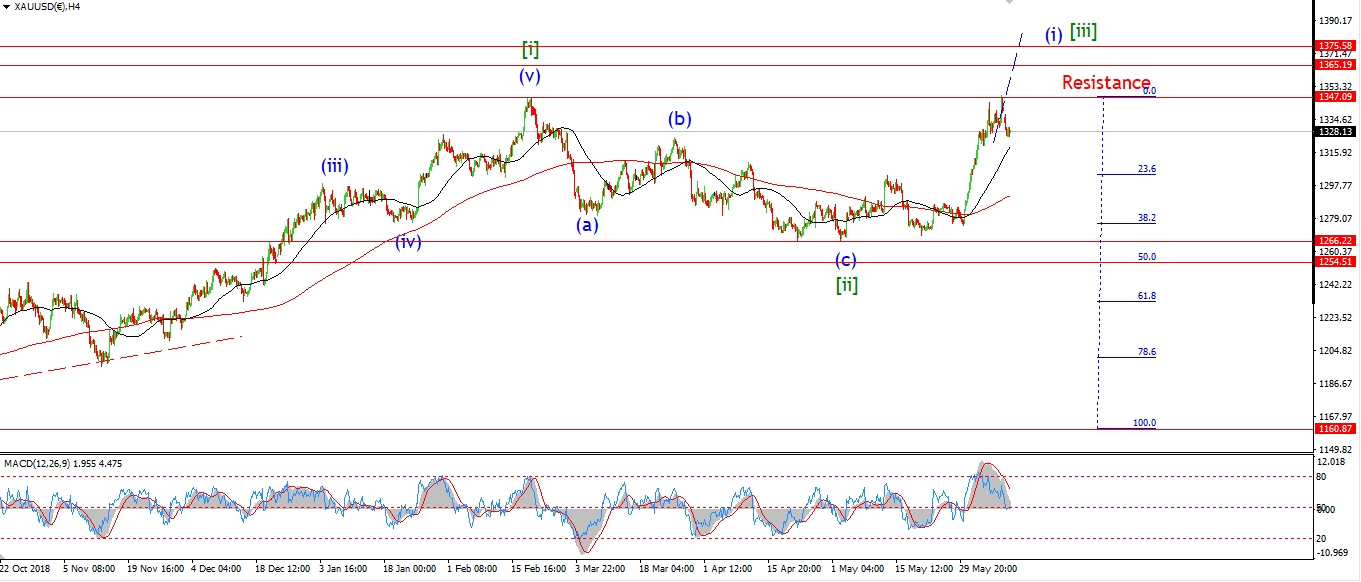 [/vc_column_text][vc_custom_heading text=”Daily” use_theme_fonts=”yes”][vc_column_text]
 [/vc_column_text][/vc_column][/vc_row]
[vc_row][vc_column][vc_column_text]
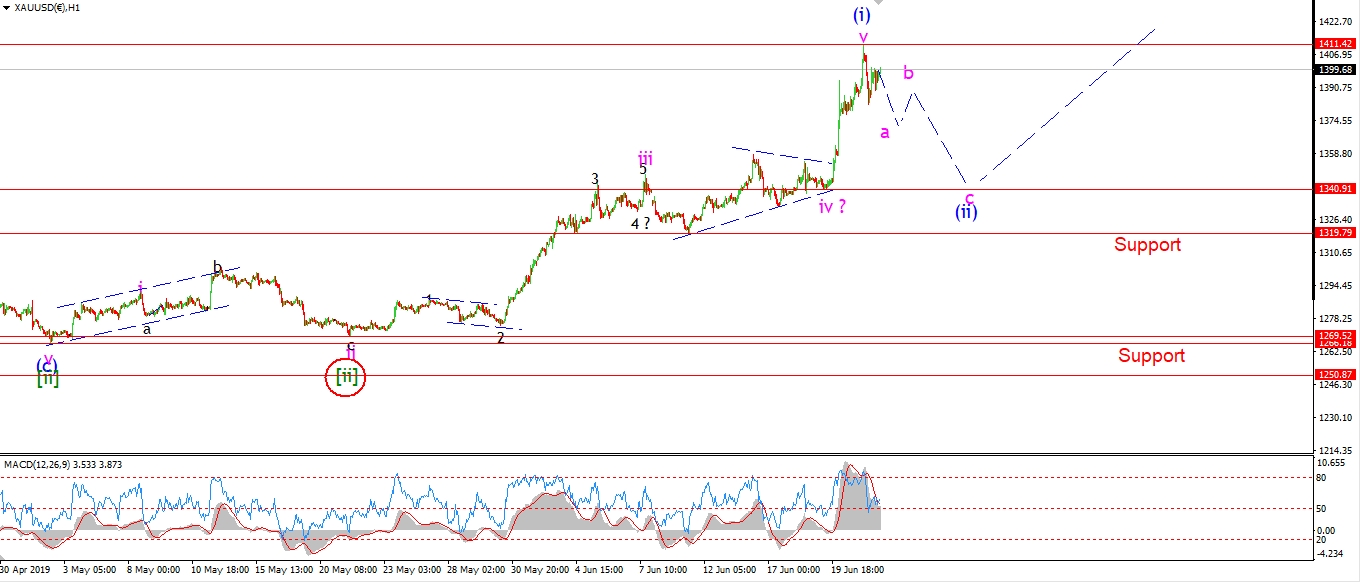
I have moved the wave count up by one degree today.
The top that just occurred today above 1400 is now viewed as wave (i) blue.
Wave (ii) is now underway.
With the initial decline off the high labelled as wave ‘a’ of (ii).
Wave ‘a’ should trace out three waves lower and this will complete by Monday evening.
And the pattern is suggesting that next week will be dominated by the downside.
Major support comes in at 1340 at the previous fourth wave.
Next week;
Watch for wave (ii) to carry us lower in three waves.
We should see another significant buying opportunity arrive at the low of wave (ii).
[/vc_column_text][/vc_column][/vc_row]
[vc_row][vc_column][vc_separator border_width=”5″][/vc_column][/vc_row][vc_row][vc_column][vc_column_text]
U.S CRUDE OIL
[/vc_column_text][/vc_column][/vc_row][vc_row][vc_column][vc_separator border_width=”5″][/vc_column][/vc_row][vc_row][vc_column width=”2/3″][vc_custom_heading text=”1 hr” use_theme_fonts=”yes”][vc_column_text]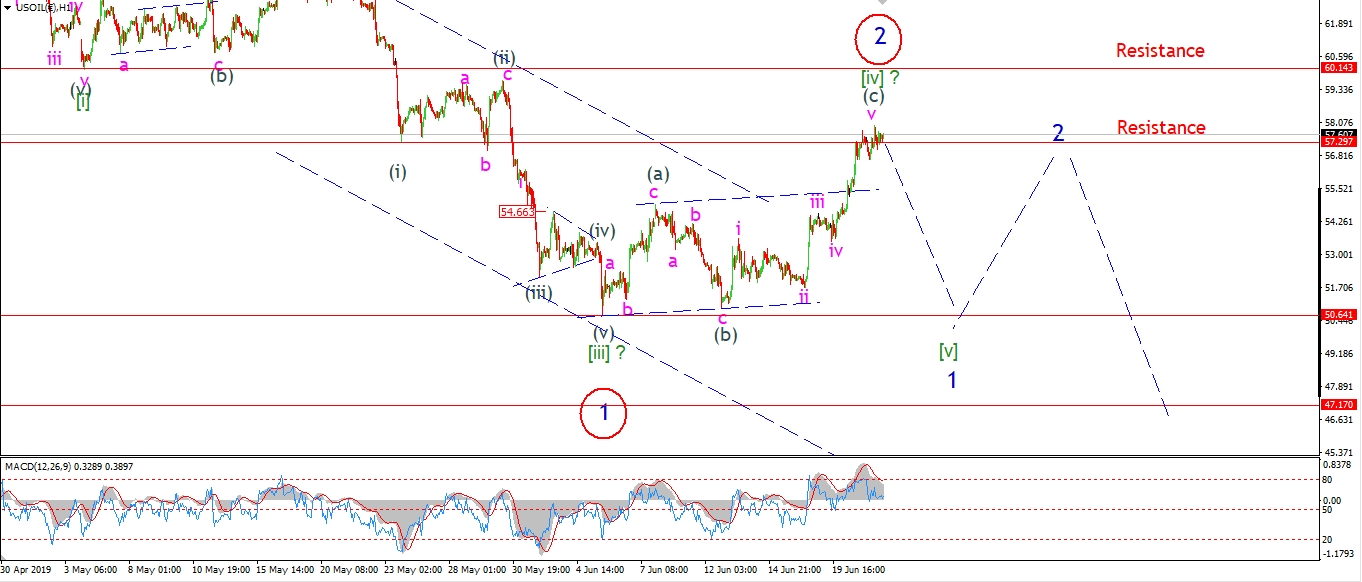 [/vc_column_text][/vc_column][vc_column width=”1/3″][vc_custom_heading text=”4 Hours” use_theme_fonts=”yes”][vc_column_text]
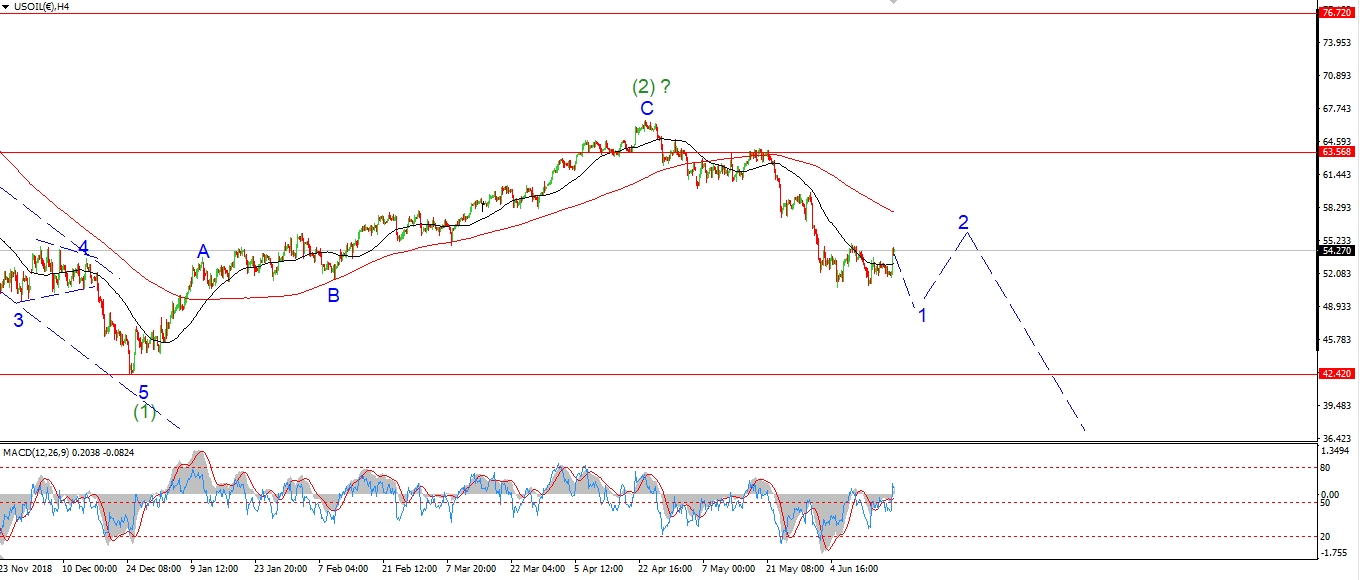 [/vc_column_text][vc_custom_heading text=”Daily” use_theme_fonts=”yes”][vc_column_text]
 [/vc_column_text][/vc_column][/vc_row]
[vc_row][vc_column][vc_column_text]
I am wrestling with the wave count in Crude now!
While the count was calling for a correction higher in wave [iv],
I did not expect the rally to extend this far.
The price seems to be stalled now at resistance.
But I will just have to wait and see if the price turns lower into wave [v] of ‘1’ next week,
or if we move to the alternate count in wave ‘2’ blue.
Monday;
Next week will likely bring some form of decline after the rally over the last few days.
If we see a three wave decline off this high,
that will signal the alternate count is more likely.
Watch for wave [v] down to begin with a push back below 56.00 again.
[/vc_column_text][/vc_column][/vc_row]
[vc_row][vc_column][vc_separator border_width=”5″][/vc_column][/vc_row][vc_row][vc_column][vc_column_text]
US 10 yr Treasuries.
[/vc_column_text][/vc_column][/vc_row][vc_row][vc_column][vc_separator border_width=”5″][/vc_column][/vc_row][vc_row][vc_column width=”2/3″][vc_custom_heading text=”1 hr” use_theme_fonts=”yes”][vc_column_text]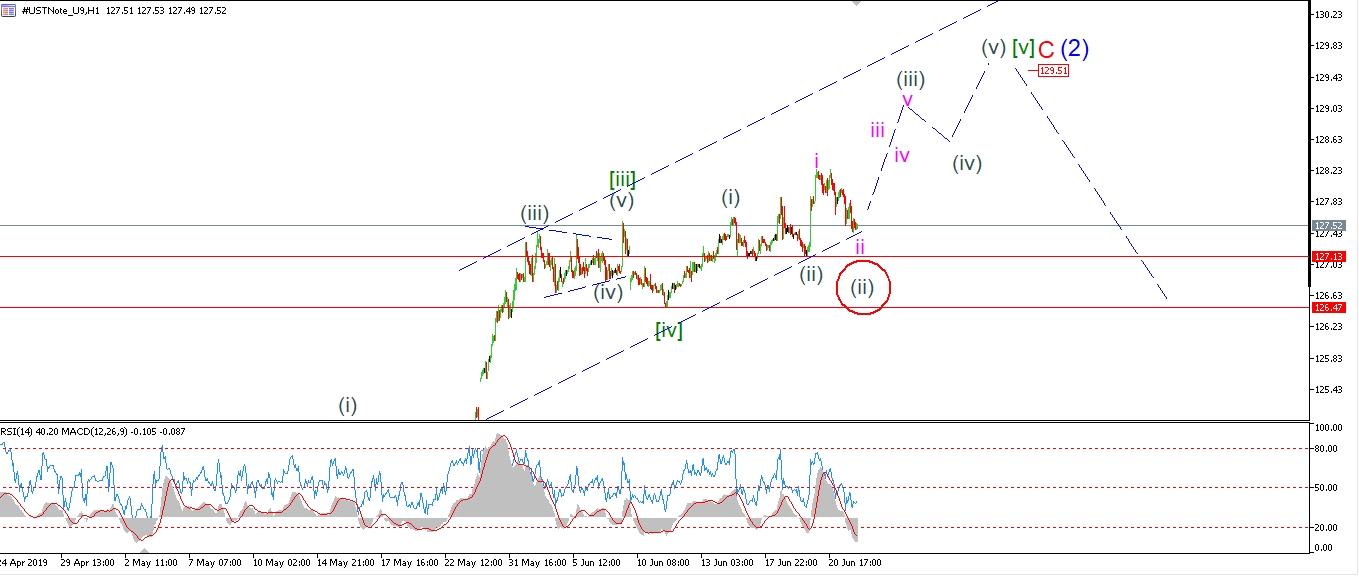 [/vc_column_text][/vc_column][vc_column width=”1/3″][vc_custom_heading text=”4 Hours” use_theme_fonts=”yes”][vc_column_text]
 [/vc_column_text][vc_custom_heading text=”Daily” use_theme_fonts=”yes”][vc_column_text]
 [/vc_column_text][/vc_column][/vc_row]
[vc_row][vc_column][vc_column_text]
Bonds are falling off the high labelled wave ‘i’ of (iii) today.
This decline is viewed as wave ‘ii’ of (iii) and should complete above 127.13
If 127.13 breaks,
that will trigger the alternate count shown circled in red.
This allows for a larger wave (ii) to form in an expanded flat correction.
Both counts call for a rally in wave (iii) over the coming days.
Monday;
Watch for wave ‘ii’ to hold above 127.13 and rally from there.
[/vc_column_text][/vc_column][/vc_row]
[vc_row][vc_column][vc_separator border_width=”5″][/vc_column][/vc_row][vc_row][vc_column][vc_column_text]
SILVER
[/vc_column_text][/vc_column][/vc_row][vc_row][vc_column][vc_separator border_width=”5″][/vc_column][/vc_row][vc_row][vc_column width=”2/3″][vc_custom_heading text=”1 hr” use_theme_fonts=”yes”][vc_column_text]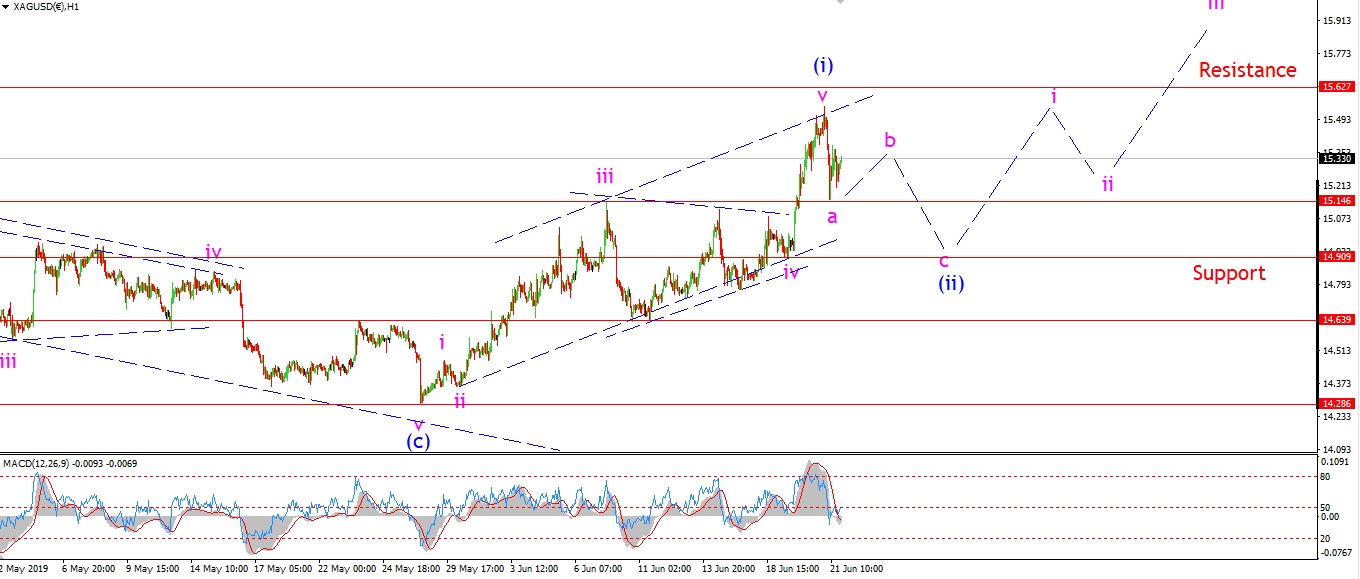 [/vc_column_text][/vc_column][vc_column width=”1/3″][vc_custom_heading text=”4 Hours” use_theme_fonts=”yes”][vc_column_text]
 [/vc_column_text][vc_custom_heading text=”Daily” use_theme_fonts=”yes”][vc_column_text]
 [/vc_column_text][/vc_column][/vc_row]
[vc_row][vc_column][vc_column_text]
Silver has dropped off the high today at wave (i) blue in a fairly sharp fashion.
I have labelled this decline as wave ‘a’ of (ii),
Where wave (ii) should create a three wave correction lower
and fall into support at 14.90 over the coming week.
14.90 marks the low of wave ‘iv’ and this is the initial target for wave (ii) to complete.
Monday;
watch for wave ‘b’ to complete early at a lower high below 15.54.
Wave ‘c’ should begin by Monday evening.
[/vc_column_text][/vc_column][/vc_row]
[vc_row][vc_column][vc_separator border_width=”5″][/vc_column][/vc_row][vc_row][vc_column][vc_column_text]
S&P 500.
[/vc_column_text][/vc_column][/vc_row][vc_row][vc_column][vc_separator border_width=”5″][/vc_column][/vc_row][vc_row][vc_column width=”2/3″][vc_custom_heading text=”1 hr” use_theme_fonts=”yes”][vc_column_text]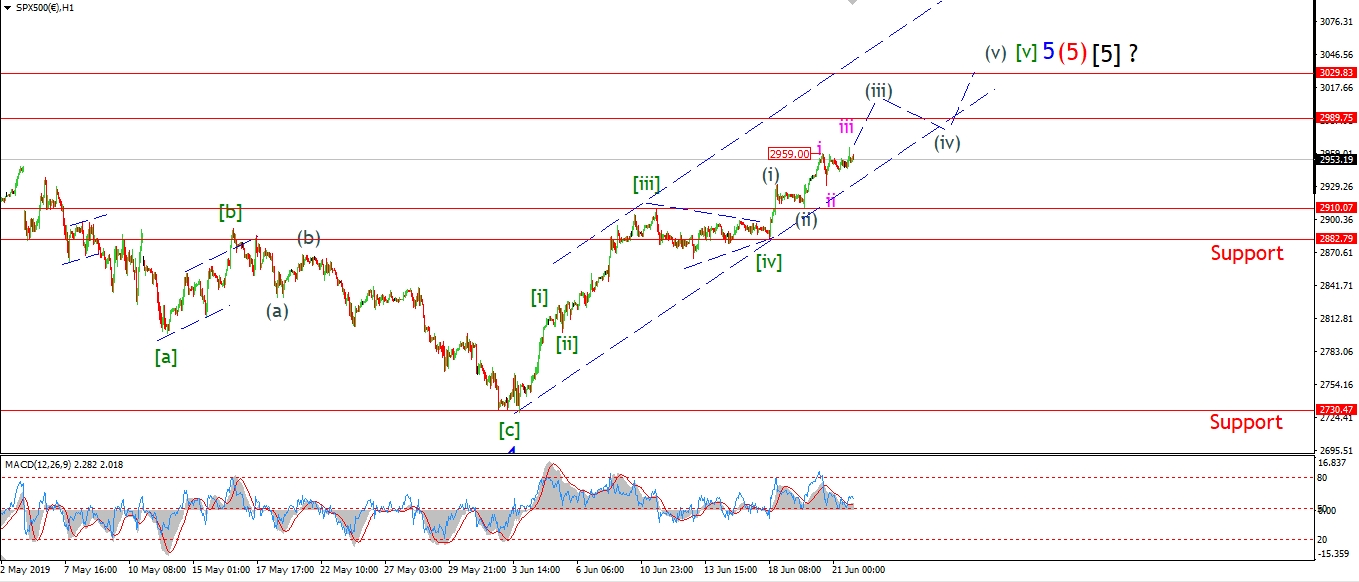 [/vc_column_text][/vc_column][vc_column width=”1/3″][vc_custom_heading text=”4 Hours” use_theme_fonts=”yes”][vc_column_text]
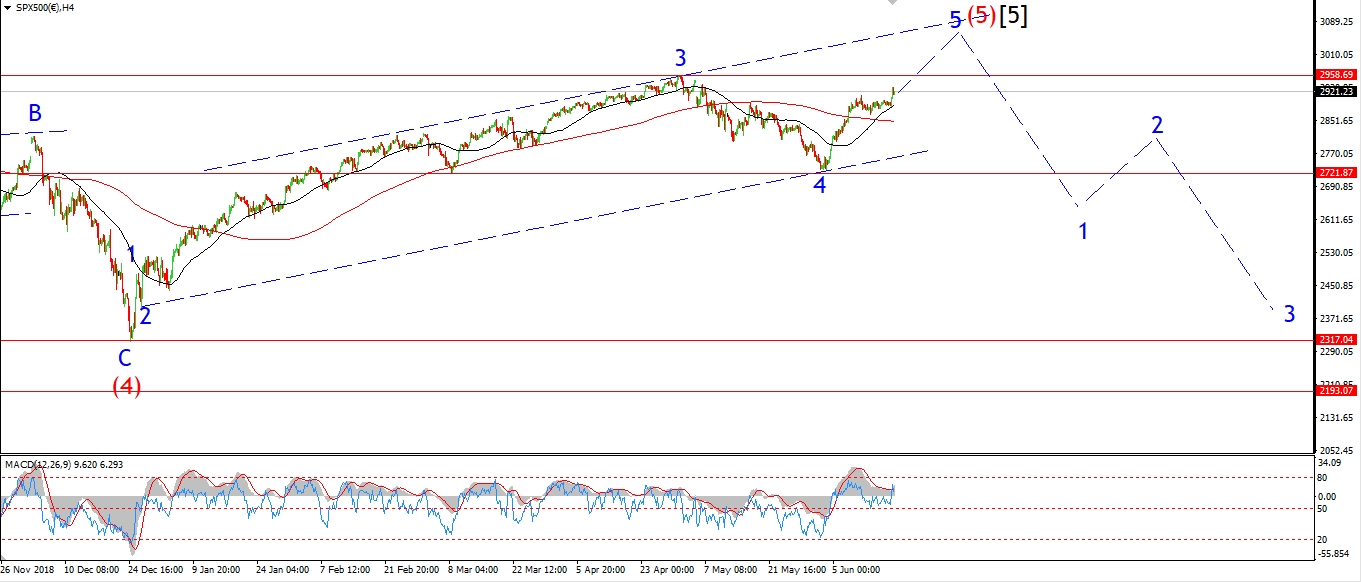 [/vc_column_text][vc_custom_heading text=”Daily” use_theme_fonts=”yes”][vc_column_text]
 [/vc_column_text][/vc_column][/vc_row]
[vc_row][vc_column][vc_column_text]
The S&P did create a new all time high today and is now closing above the previous high of early May.
The outlook for next week is for wave (iii) to continue higher.
Wave ‘iii’ of (iii) should carry us up towards the 3000 level for the first time.
And wave (v) of [v] is set to carry the price up to the 3050 – 3100 region.
Monday;
Wave (ii) lies at 2910.
This level must now hold as wave (iii) unfolds to the upside.
Watch for wave ‘iii’ of (iii) to carry us higher on Monday.
[/vc_column_text][/vc_column][/vc_row]
[vc_row][vc_column][vc_separator border_width=”5″][/vc_column][/vc_row]