
[vc_row][vc_column][vc_separator border_width=”5″][/vc_column][/vc_row]
[vc_row][vc_column][vc_column_text]
Good evening to one and all.
[/vc_column_text][/vc_column][/vc_row]
[vc_row][vc_column][vc_separator border_width=”5″][/vc_column][/vc_row]
[vc_row][vc_column][vc_column_text]
EURUSD
[/vc_column_text][/vc_column][/vc_row]
[vc_row][vc_column][vc_separator border_width=”5″][/vc_column][/vc_row][vc_row][vc_column width=”2/3″][vc_custom_heading text=”1 hr” use_theme_fonts=”yes”][vc_column_text]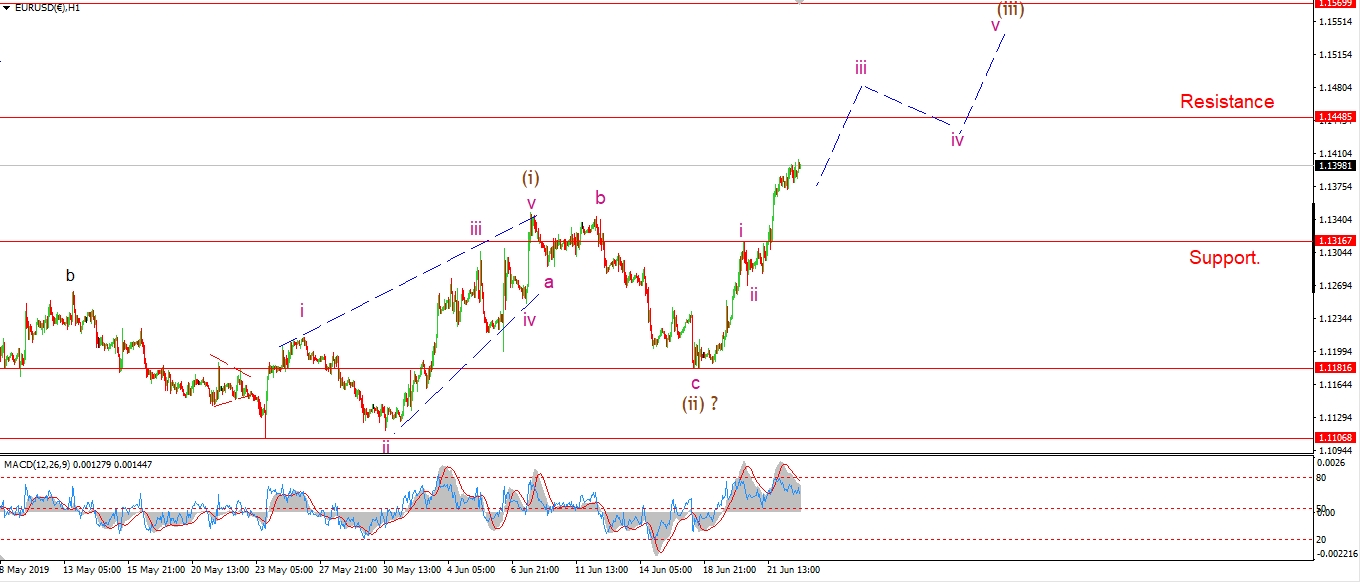 [/vc_column_text][/vc_column][vc_column width=”1/3″][vc_custom_heading text=”4 Hours” use_theme_fonts=”yes”][vc_column_text]
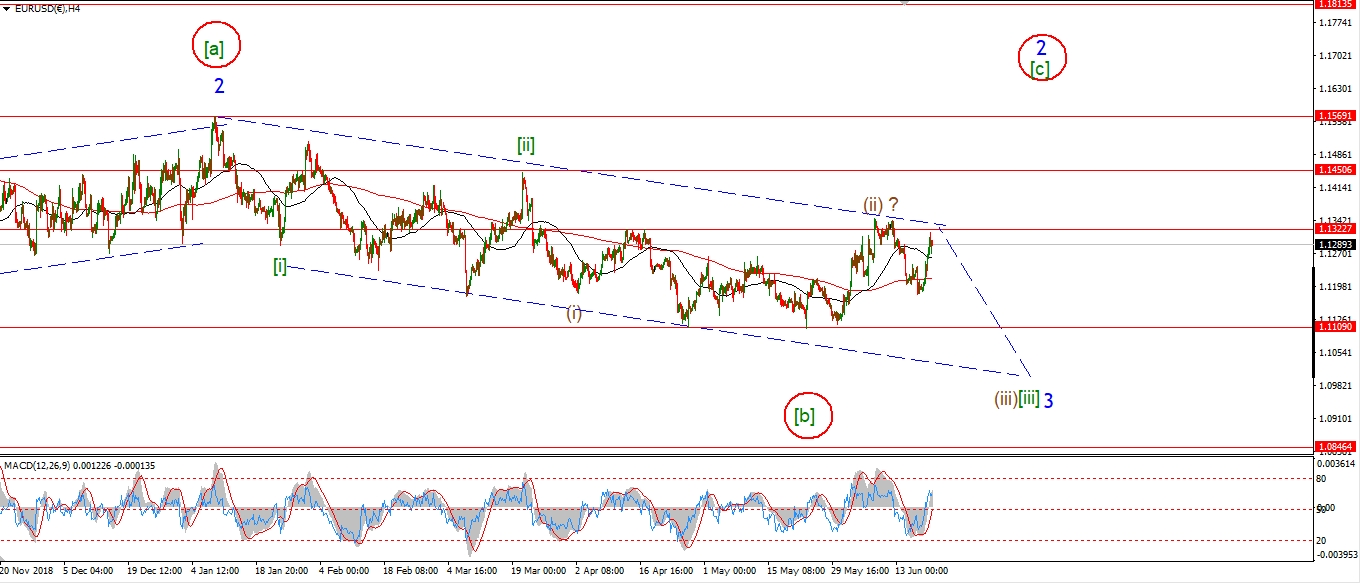 [/vc_column_text][vc_custom_heading text=”Daily” use_theme_fonts=”yes”][vc_column_text]
 [/vc_column_text][/vc_column][/vc_row]
[vc_row][vc_column][vc_column_text]
There is a five wave rally now in place off the low of June 18th.
This rally is labelled as wave ‘iii’ of (iii) of [c].
where the larger wave [c] has a minimum target at 1.1570.
This is best viewed on the 4hr chart.
If wave ‘iii’ of (iii) is now underway,
Then price should hold above the wave ‘i’ high at 1.1316 from now on.
I expect a break of 1.1485 as wave (iii) completes.
Tomorrow;
Wave ‘iii’ should continue higher and complete above 1.1485.
A break of 1.1316 will invalidate this short term count.
[/vc_column_text][/vc_column][/vc_row]
[vc_row][vc_column][vc_separator border_width=”5″][/vc_column][/vc_row][vc_row][vc_column][vc_column_text]
GBPUSD
[/vc_column_text][/vc_column][/vc_row][vc_row][vc_column][vc_separator border_width=”5″][/vc_column][/vc_row][vc_row][vc_column width=”2/3″][vc_custom_heading text=”1 hr” use_theme_fonts=”yes”][vc_column_text]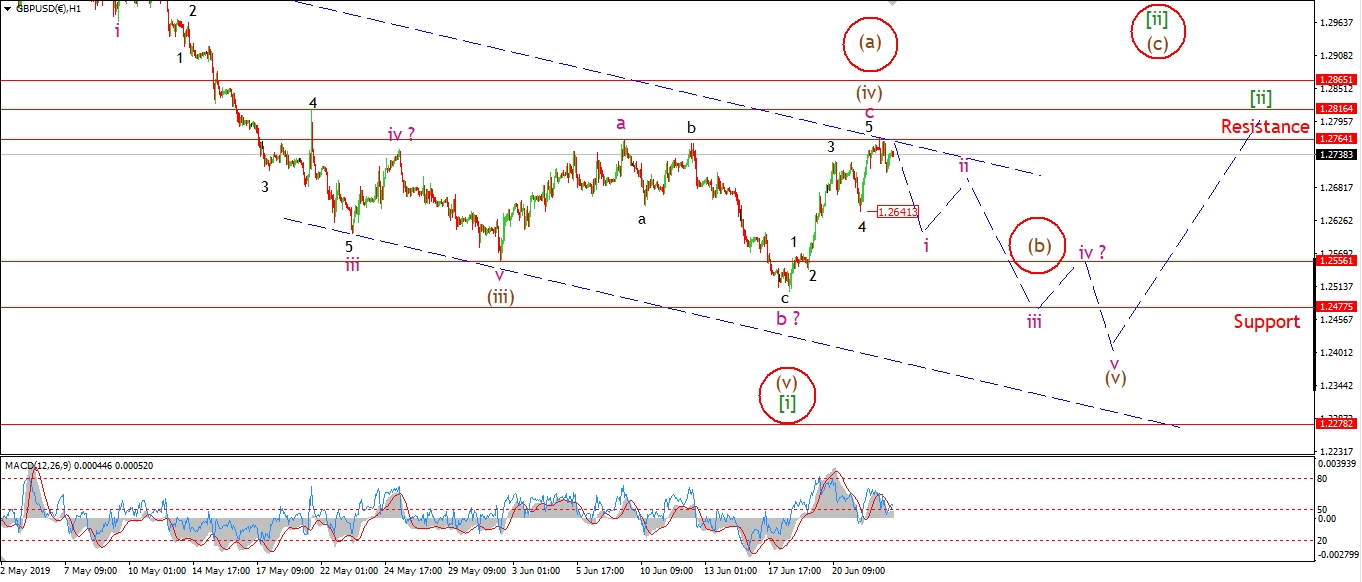 [/vc_column_text][/vc_column][vc_column width=”1/3″][vc_custom_heading text=”4 Hours” use_theme_fonts=”yes”][vc_column_text]
 [/vc_column_text][vc_custom_heading text=”Daily” use_theme_fonts=”yes”][vc_column_text]
 [/vc_column_text][/vc_column][/vc_row]
[vc_row][vc_column][vc_column_text]
The alternate count in cable allows for the possibility that wave [ii] green is already underway.
This scenario involves similar action to the current wave count.
The main difference being that the decline expected now in that alternate count will be corrective and shallow in wave (b) of [ii].
And then wave (c) will rally and complete wave [ii].
This count will be triggered if we see a three wave decline to a higher low over the coming days.
Back the the current wave count.
Wave (v) of [i] can still create a new low below 1.2477 over the coming week.
but the price must begin to fall tomorrow in wave ‘i’ of (v) to stay with this count.
Tomorrow;
Watch for a decline in wave ‘i’ to break 1.2641.
[/vc_column_text][/vc_column][/vc_row]
[vc_row][vc_column][vc_separator border_width=”5″][/vc_column][/vc_row][vc_row][vc_column][vc_column_text]
USDJPY
[/vc_column_text][/vc_column][/vc_row][vc_row][vc_column][vc_separator border_width=”5″][/vc_column][/vc_row][vc_row][vc_column width=”2/3″][vc_custom_heading text=”1 hr” use_theme_fonts=”yes”][vc_column_text] [/vc_column_text][/vc_column][vc_column width=”1/3″][vc_custom_heading text=”4 Hours” use_theme_fonts=”yes”][vc_column_text]
 [/vc_column_text][vc_custom_heading text=”Daily” use_theme_fonts=”yes”][vc_column_text]
 [/vc_column_text][/vc_column][/vc_row]
[vc_row][vc_column][vc_column_text]
USDJPY has held above Fridays lows so far today.
The price has corrected off 107.73 in a possible wave ‘ii’ pink.
So the bullish pattern in wave (i) is still possible.
Wave ‘ii’ must hold above 107.05 and then rally to break 107.73 and continue higher in wave ‘iii’ of (i).
If we see that happen this week,
then we are on for a bullish signal to form by next week.
Tomorrow;
Wave ‘2’ must hold at 107.05.
Wave ‘iii’ must then carry higher for the next few sessions.
[/vc_column_text][/vc_column][/vc_row]
[vc_row][vc_column][vc_separator border_width=”5″][/vc_column][/vc_row][vc_row][vc_column][vc_column_text]
DOW JONES INDUSTRIALS
[/vc_column_text][/vc_column][/vc_row][vc_row][vc_column][vc_separator border_width=”5″][/vc_column][/vc_row][vc_row][vc_column width=”2/3″][vc_custom_heading text=”1 hr” use_theme_fonts=”yes”][vc_column_text]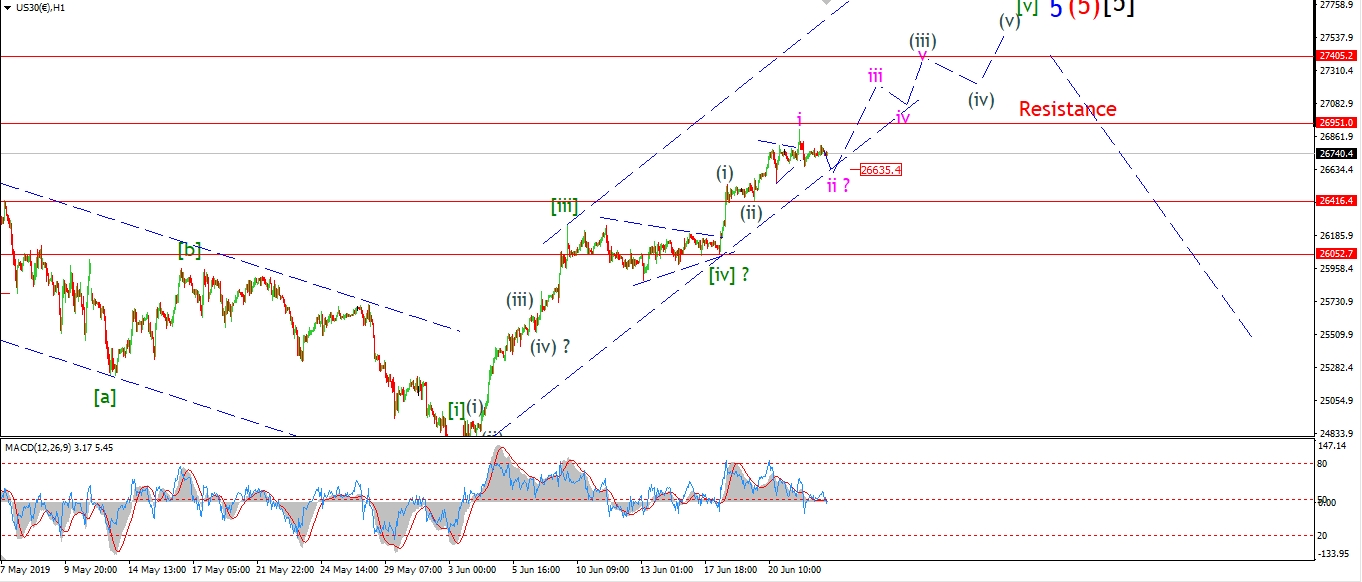 [/vc_column_text][/vc_column][vc_column width=”1/3″][vc_custom_heading text=”4 Hours” use_theme_fonts=”yes”][vc_column_text]
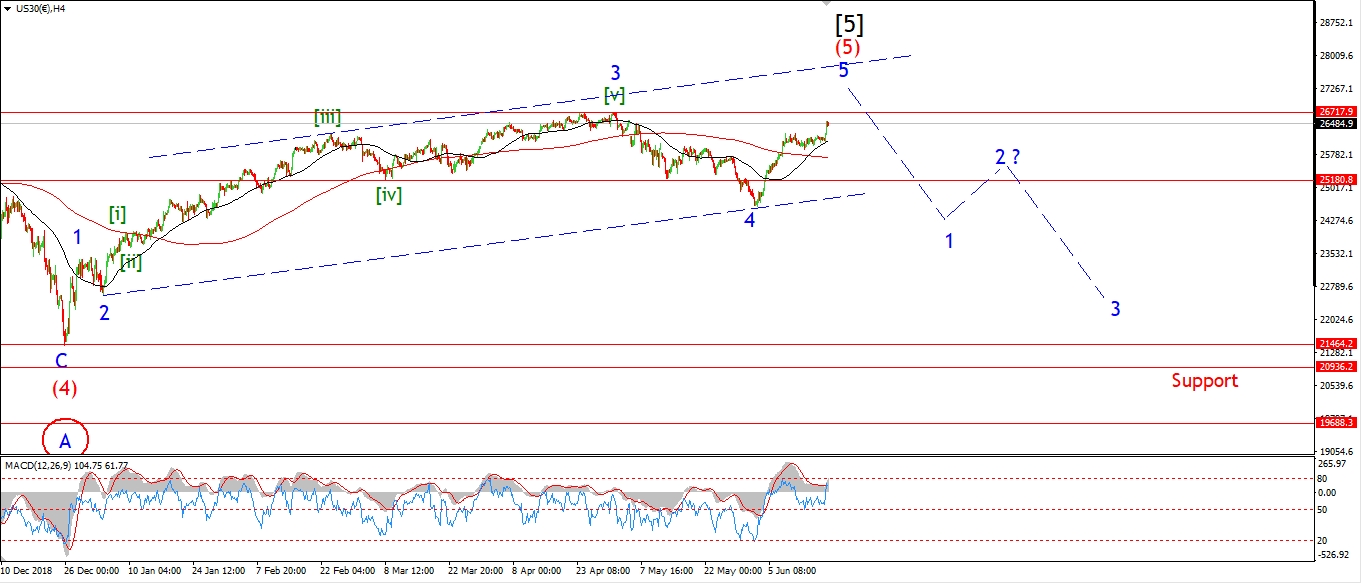 [/vc_column_text][vc_custom_heading text=”Daily” use_theme_fonts=”yes”][vc_column_text]
 [/vc_column_text][/vc_column][/vc_row]
[vc_row][vc_column][vc_column_text]
I have shown a variation of Fridays wave count this evening.
Fridays high is now viewed as wave ‘i’ of (iii) of [v].
With the corrective action of last week now viewed as a triangle within wave ‘i’.
It is likely that wave ‘ii’ of (iii) is now underway.
This correction should fall in three waves off the wave ‘i’ high,
and then complete above 26420.
At that point we will be set to rally in wave ‘iii’ of (iii) to a new all time high.
This should happen this week.
Tomorrow;
Watch for wave ‘ii’ to complete at about 26630 where the price will meet the rising trend channel again.
[/vc_column_text][/vc_column][/vc_row]
[vc_row][vc_column][vc_separator border_width=”5″][/vc_column][/vc_row][vc_row][vc_column][vc_column_text]
GOLD
[/vc_column_text][/vc_column][/vc_row][vc_row][vc_column][vc_separator border_width=”5″][/vc_column][/vc_row][vc_row][vc_column width=”2/3″][vc_custom_heading text=”1 hr” use_theme_fonts=”yes”][vc_column_text]
 [/vc_column_text][/vc_column][vc_column width=”1/3″][vc_custom_heading text=”4 Hours” use_theme_fonts=”yes”][vc_column_text]
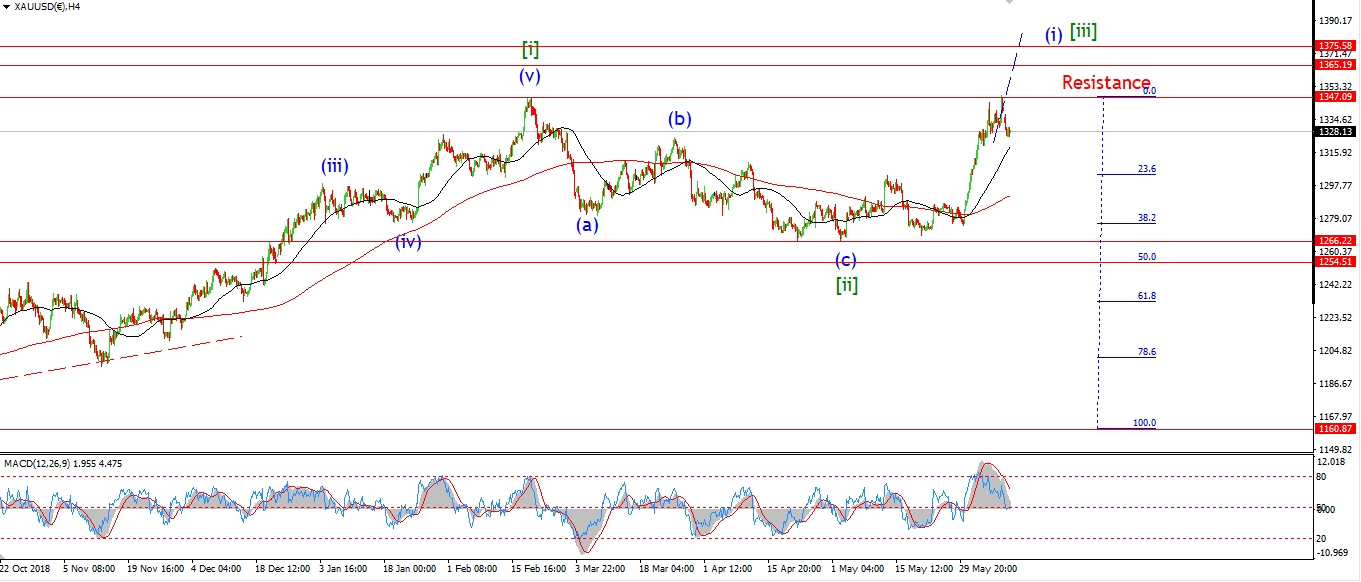 [/vc_column_text][vc_custom_heading text=”Daily” use_theme_fonts=”yes”][vc_column_text]
 [/vc_column_text][/vc_column][/vc_row]
[vc_row][vc_column][vc_column_text]
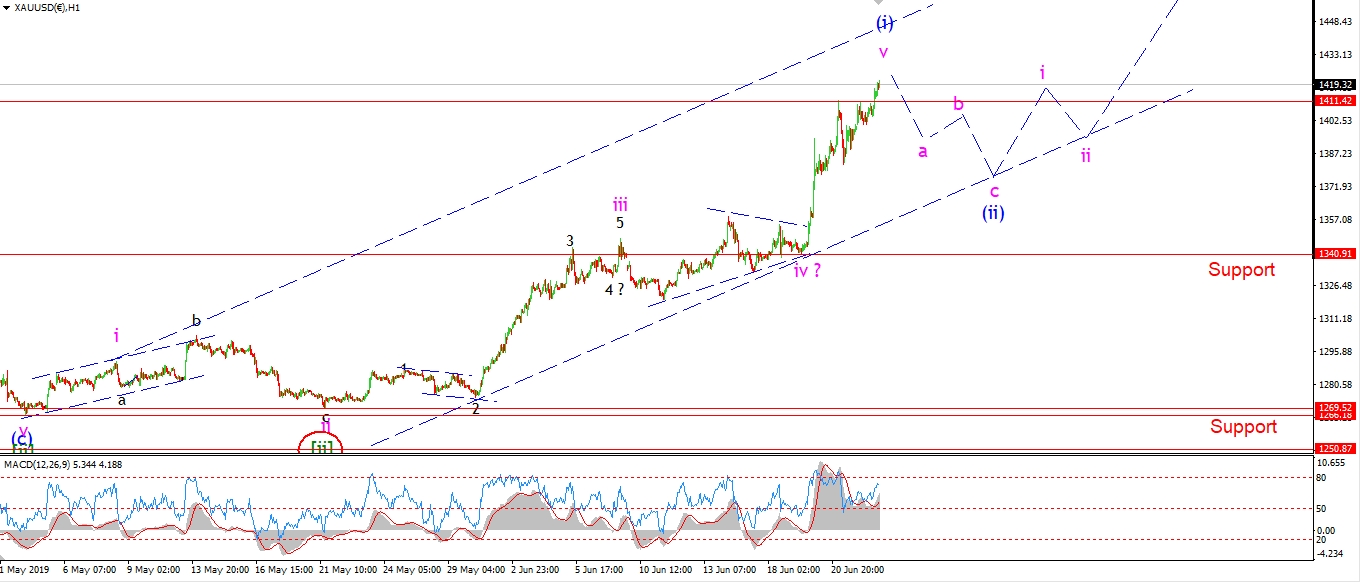
Gold is again on the rise today,
but I think we are pushing the end of wave (i) now.
We should see a corrective decline develop this week in wave (ii) blue,
and it should be in three waves as shown.
This decline will create another bullish opportunity,
but price should fall back into the rising trend channel again first
to clear the air a bit before wave (iii) of [iii] kicks off.
Tomorrow;
Watch for wave (i) to complete soon.
The previous wave ‘iv’ lies at 1340,
this level forms the initial target for wave (ii) to complete.
[/vc_column_text][/vc_column][/vc_row]
[vc_row][vc_column][vc_separator border_width=”5″][/vc_column][/vc_row][vc_row][vc_column][vc_column_text]
U.S CRUDE OIL
[/vc_column_text][/vc_column][/vc_row][vc_row][vc_column][vc_separator border_width=”5″][/vc_column][/vc_row][vc_row][vc_column width=”2/3″][vc_custom_heading text=”1 hr” use_theme_fonts=”yes”][vc_column_text] [/vc_column_text][/vc_column][vc_column width=”1/3″][vc_custom_heading text=”4 Hours” use_theme_fonts=”yes”][vc_column_text]
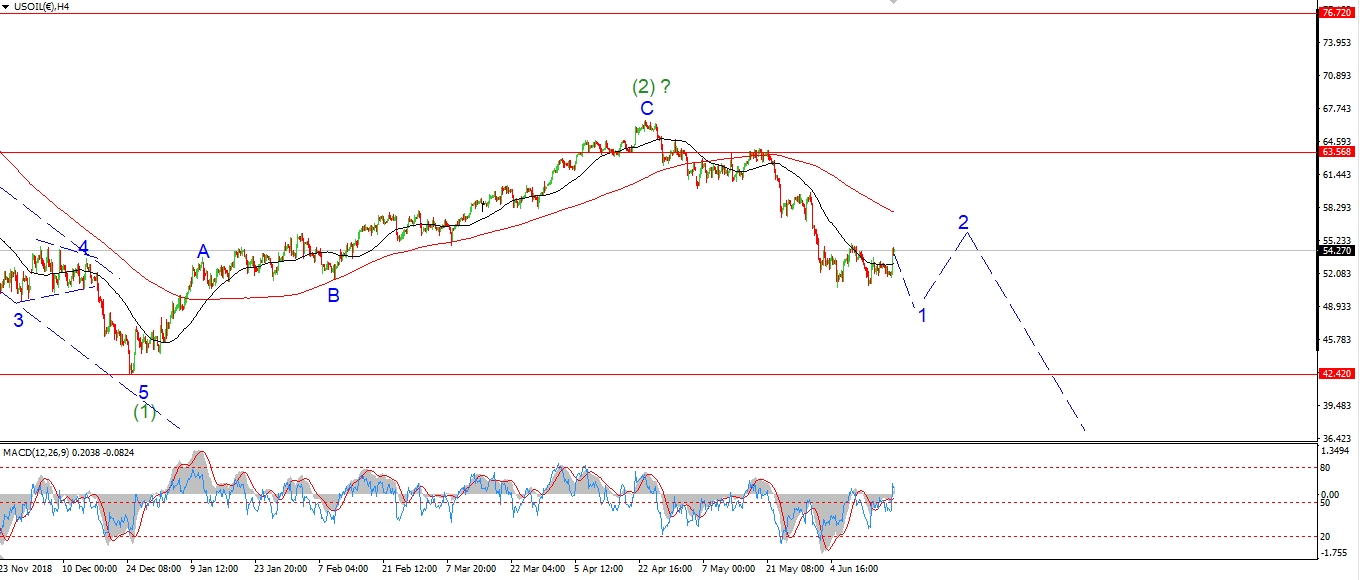 [/vc_column_text][vc_custom_heading text=”Daily” use_theme_fonts=”yes”][vc_column_text]
 [/vc_column_text][/vc_column][/vc_row]
[vc_row][vc_column][vc_column_text]
I have shown the alternate count for wave ‘2’ in full this evening.
If this count is correct,
then the recent rally off the low is wave [a] of ‘2’.
Wave [b] of ‘2’ should now decline in three waves.
And wave [c] will complete wave ‘2’ at about 61.00 again.
At the moment,
both wave counts call for a decline off the current high.
The main count calls for a drop to a new low in wave [v] of ‘1’.
And the alternate calls for a drop in wave [b] of ‘2’.
We should know later in the week which count is correct.
Tomorrow;
watch for a drop to begin in wave (i) of [v].
a break of 54.90 over the coming days will confirm wave [v] has begun.
[/vc_column_text][/vc_column][/vc_row]
[vc_row][vc_column][vc_separator border_width=”5″][/vc_column][/vc_row][vc_row][vc_column][vc_column_text]
US 10 yr Treasuries.
[/vc_column_text][/vc_column][/vc_row][vc_row][vc_column][vc_separator border_width=”5″][/vc_column][/vc_row][vc_row][vc_column width=”2/3″][vc_custom_heading text=”1 hr” use_theme_fonts=”yes”][vc_column_text]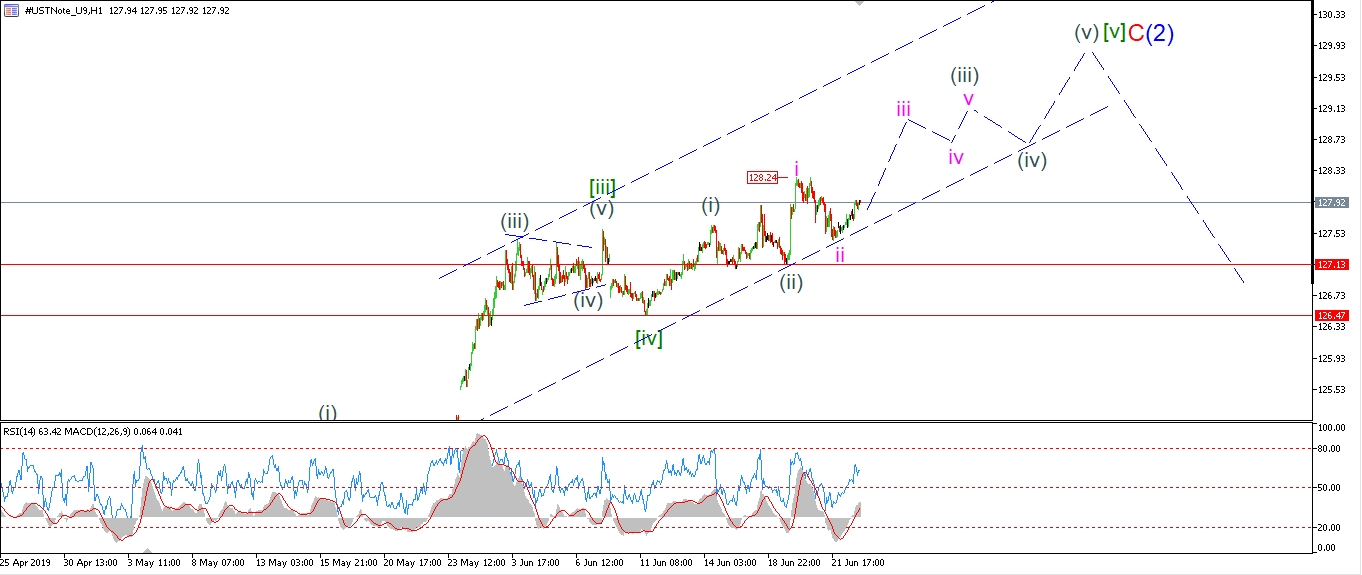 [/vc_column_text][/vc_column][vc_column width=”1/3″][vc_custom_heading text=”4 Hours” use_theme_fonts=”yes”][vc_column_text]
 [/vc_column_text][vc_custom_heading text=”Daily” use_theme_fonts=”yes”][vc_column_text]
 [/vc_column_text][/vc_column][/vc_row]
[vc_row][vc_column][vc_column_text]
The 10YR is rising today to begin a rally in wave ‘iii’ of (iii).
But so far the action is a little unconvincing.
If we see an acceleration higher tomorrow to break 128.24,
that will signal wave ‘iii’ is underway.
The price should continue higher within the trend channel in wave ‘iii’.
At a minimum,
price must hold above 127.13 to remain bullish in the short term.
Tomorrow;
Watch for wave ‘iii’ to push above 128.24.
[/vc_column_text][/vc_column][/vc_row]
[vc_row][vc_column][vc_separator border_width=”5″][/vc_column][/vc_row][vc_row][vc_column][vc_column_text]
SILVER
[/vc_column_text][/vc_column][/vc_row][vc_row][vc_column][vc_separator border_width=”5″][/vc_column][/vc_row][vc_row][vc_column width=”2/3″][vc_custom_heading text=”1 hr” use_theme_fonts=”yes”][vc_column_text]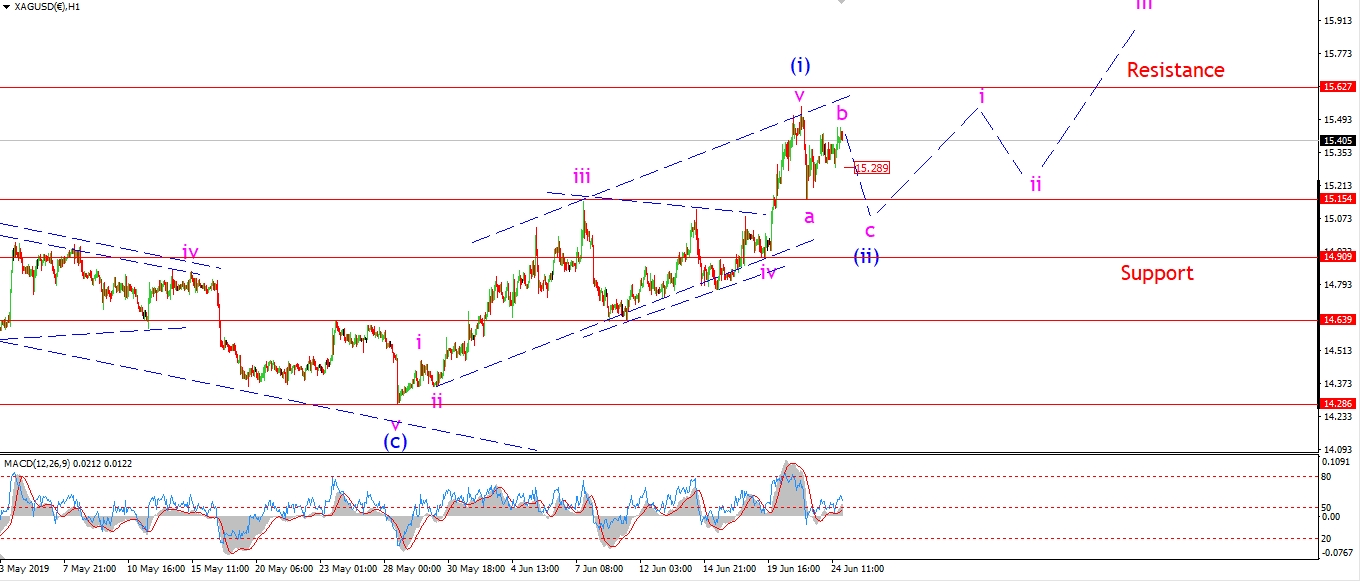 [/vc_column_text][/vc_column][vc_column width=”1/3″][vc_custom_heading text=”4 Hours” use_theme_fonts=”yes”][vc_column_text]
 [/vc_column_text][vc_custom_heading text=”Daily” use_theme_fonts=”yes”][vc_column_text]
 [/vc_column_text][/vc_column][/vc_row]
[vc_row][vc_column][vc_column_text]
The rise in Silver today is labelled as wave ‘b’ of (ii).
The action fits with a ‘b’ wave as it is fairly choppy.
Wave ‘c’ should begin tomorrow and fall below 15.15 again to complete wave (ii).
Once this correction is over,
the price will be set to rally in wave (iii).
Tomorrow;
Wave (ii) should complete by Wednesday.
So watch for wave ‘c’ to begin tomorrow,
a decline 15.30 again will signal wave ‘c’ has begun.
[/vc_column_text][/vc_column][/vc_row]
[vc_row][vc_column][vc_separator border_width=”5″][/vc_column][/vc_row][vc_row][vc_column][vc_column_text]
S&P 500.
[/vc_column_text][/vc_column][/vc_row][vc_row][vc_column][vc_separator border_width=”5″][/vc_column][/vc_row][vc_row][vc_column width=”2/3″][vc_custom_heading text=”1 hr” use_theme_fonts=”yes”][vc_column_text]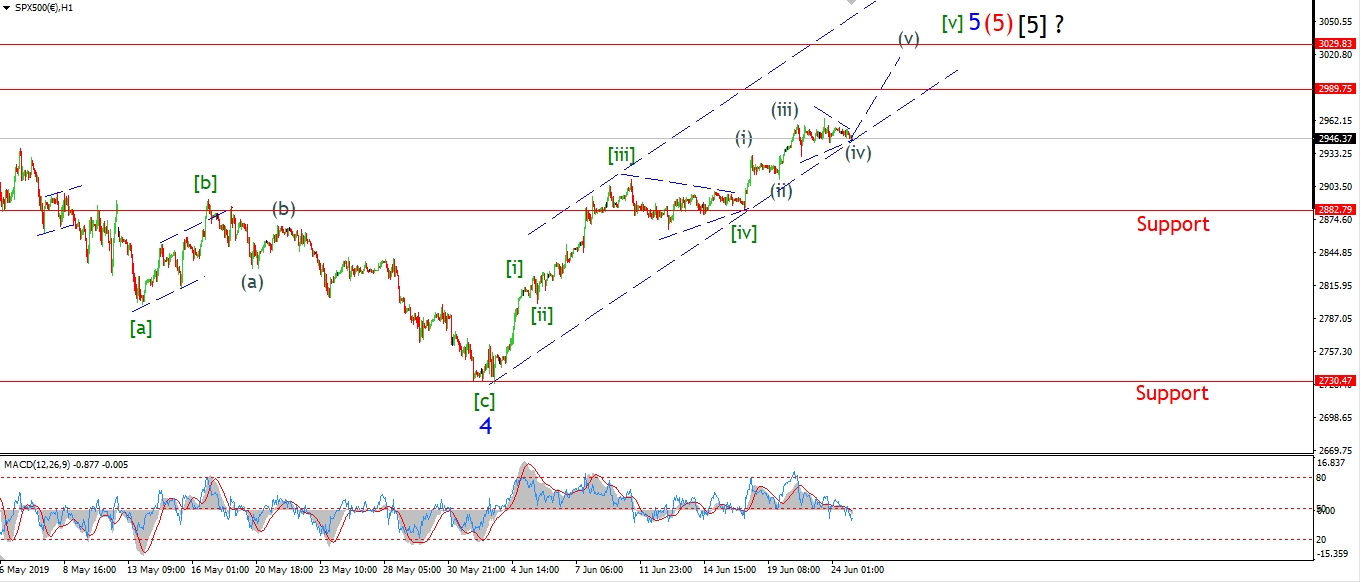 [/vc_column_text][/vc_column][vc_column width=”1/3″][vc_custom_heading text=”4 Hours” use_theme_fonts=”yes”][vc_column_text]
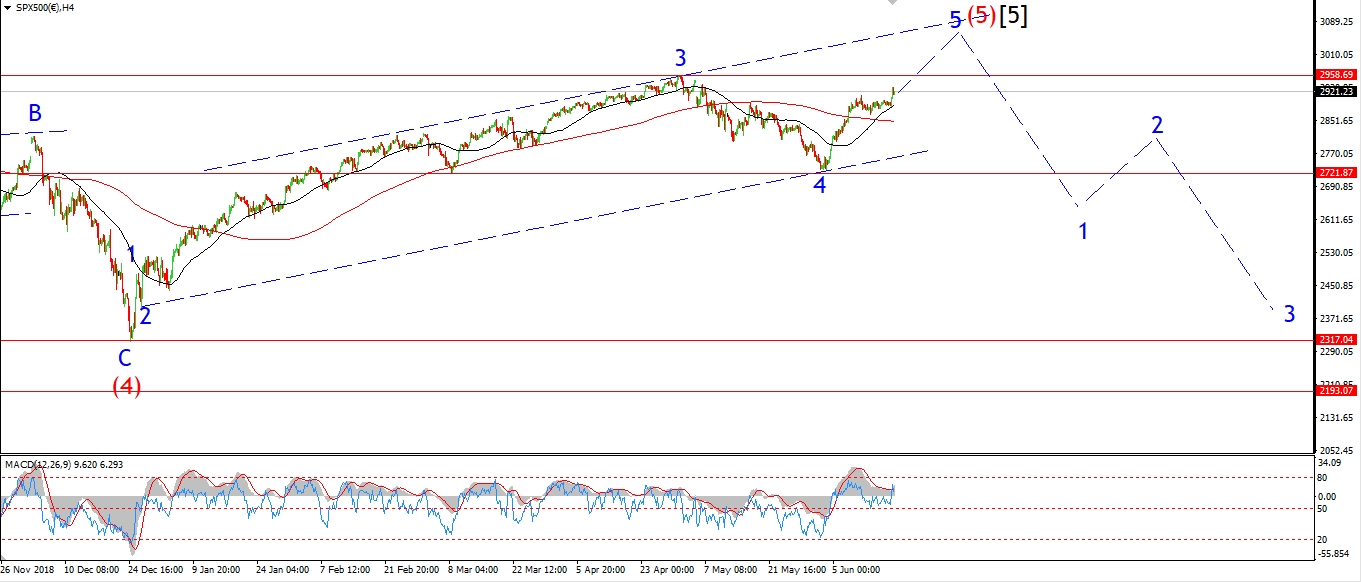 [/vc_column_text][vc_custom_heading text=”Daily” use_theme_fonts=”yes”][vc_column_text]
 [/vc_column_text][/vc_column][/vc_row]
[vc_row][vc_column][vc_column_text]
The price has now contracted in range for the last three sessions.
I have shown this action as a possible triangle this evening.
And it may even be a triangle in wave (iv) of [v].
Which means that wave (v) of [v] will be the final rally to complete the larger pattern.
The margin is tight on this wave count though,
price must hold above 2942 tomorrow
and then begin a rally out of the triangle immediately.
Wave (v) of [v] should carry above 3000 to complete.
And then we can begin to look lower again to begin a possible bear market.
Tomorrow;
Watch for wave (iv) to hold above 2942.
Wave (v) of [v] is then expected to rally for the rest of the week.
[/vc_column_text][/vc_column][/vc_row]
[vc_row][vc_column][vc_separator border_width=”5″][/vc_column][/vc_row]