
[vc_row][vc_column][vc_separator border_width=”5″][/vc_column][/vc_row]
[vc_row][vc_column][vc_column_text]
Good evening to one and all.
[/vc_column_text][/vc_column][/vc_row]
[vc_row][vc_column][vc_separator border_width=”5″][/vc_column][/vc_row]
[vc_row][vc_column][vc_column_text]
EURUSD
[/vc_column_text][/vc_column][/vc_row]
[vc_row][vc_column][vc_separator border_width=”5″][/vc_column][/vc_row][vc_row][vc_column width=”2/3″][vc_custom_heading text=”1 hr” use_theme_fonts=”yes”][vc_column_text]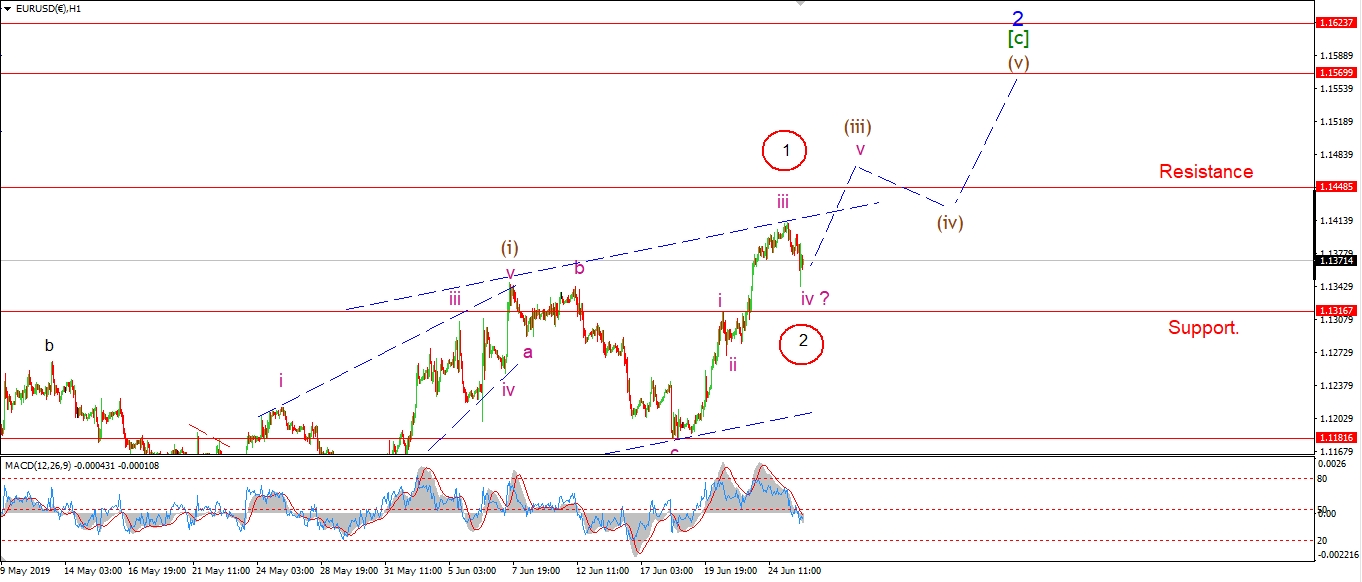 [/vc_column_text][/vc_column][vc_column width=”1/3″][vc_custom_heading text=”4 Hours” use_theme_fonts=”yes”][vc_column_text]
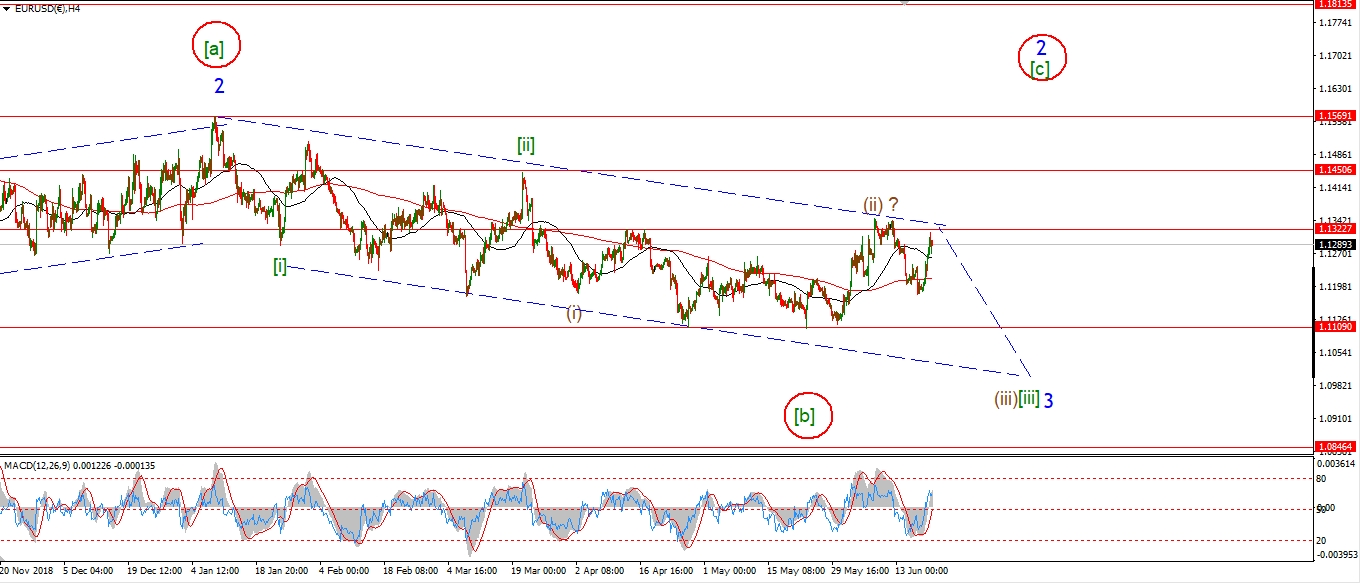 [/vc_column_text][vc_custom_heading text=”Daily” use_theme_fonts=”yes”][vc_column_text]
 [/vc_column_text][/vc_column][/vc_row]
[vc_row][vc_column][vc_column_text]
The price fell sharply in a three wave formation off the overnight high today.
EURUSD has regained some of that decline this evening,
so the decline counts as a correction at this point.
And I have labelled the decline as wave ‘iv’.
Wave ‘v’ of should carry higher out above the trendline to complete wave (iii).
It is interesting that the rally ended at the upper line of the trend channel created off the low.
The rally has is in three waves so far,
but I have to expect that wave [c] will still continue higher
towards the target at 1.1600 to complete the larger correction.
Tomorrow;
watch for wave ‘iv’ to hold above 1.1316 and wave ‘v’ to break above the upper trend channel.
[/vc_column_text][/vc_column][/vc_row]
[vc_row][vc_column][vc_separator border_width=”5″][/vc_column][/vc_row][vc_row][vc_column][vc_column_text]
GBPUSD
[/vc_column_text][/vc_column][/vc_row][vc_row][vc_column][vc_separator border_width=”5″][/vc_column][/vc_row][vc_row][vc_column width=”2/3″][vc_custom_heading text=”1 hr” use_theme_fonts=”yes”][vc_column_text]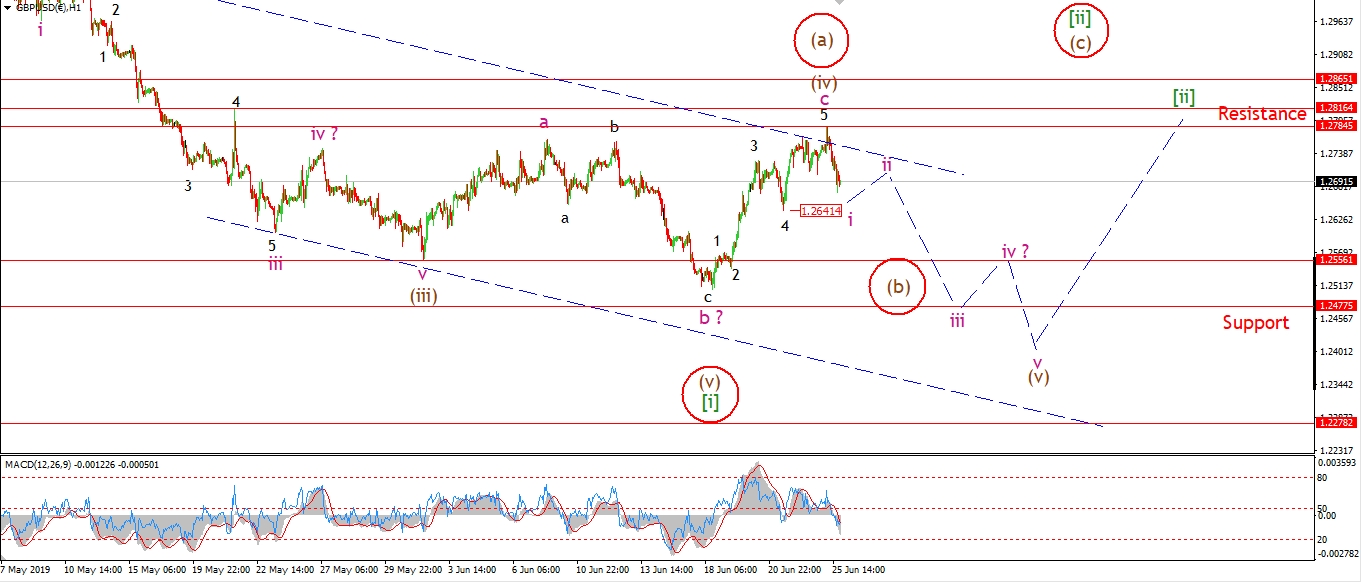 [/vc_column_text][/vc_column][vc_column width=”1/3″][vc_custom_heading text=”4 Hours” use_theme_fonts=”yes”][vc_column_text]
 [/vc_column_text][vc_custom_heading text=”Daily” use_theme_fonts=”yes”][vc_column_text]
 [/vc_column_text][/vc_column][/vc_row]
[vc_row][vc_column][vc_column_text]
Cable fell today to begin either wave (v) of [i],
or wave (b) of [ii].
Wave (v) will fall in three waves to a new low below 1.2477.
Whereas the alternate wave (b) will create a higher low after a three wave decline.
So the pattern off the high will decide the short term wave count.
Both of these wave counts should result in further declines in wave [iii] down.
Tomorrow;
watch for wave (v) to continue lower over the coming days.
wave ‘ii’ pink should create a lower high below 1.2784 tomorrow.
[/vc_column_text][/vc_column][/vc_row]
[vc_row][vc_column][vc_separator border_width=”5″][/vc_column][/vc_row][vc_row][vc_column][vc_column_text]
USDJPY
[/vc_column_text][/vc_column][/vc_row][vc_row][vc_column][vc_separator border_width=”5″][/vc_column][/vc_row][vc_row][vc_column width=”2/3″][vc_custom_heading text=”1 hr” use_theme_fonts=”yes”][vc_column_text]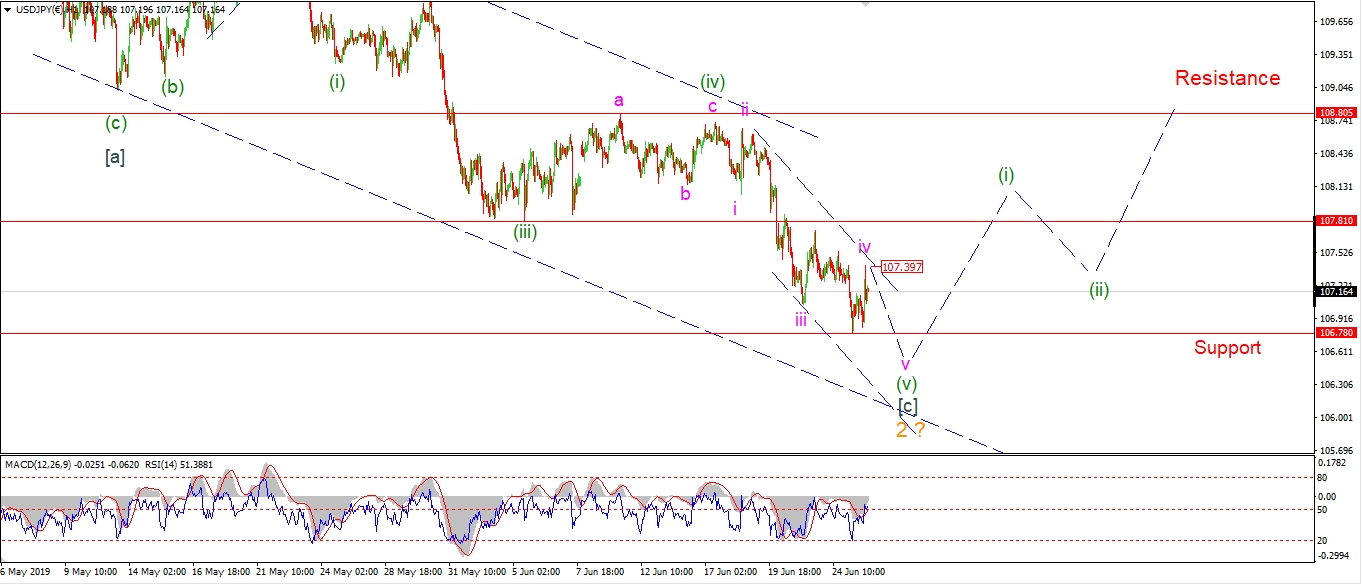 [/vc_column_text][/vc_column][vc_column width=”1/3″][vc_custom_heading text=”4 Hours” use_theme_fonts=”yes”][vc_column_text]
 [/vc_column_text][vc_custom_heading text=”Daily” use_theme_fonts=”yes”][vc_column_text]
 [/vc_column_text][/vc_column][/vc_row]
[vc_row][vc_column][vc_column_text]
The spike lower today has ruled out the bullish short term count.
It looks like wave (v) of [c] is still in force.
And the choppy action over the last few days is part of wave ‘iv’ pink.
This wave is most likely a running flat which completed at 107.40.
And wave ‘v’ is now declining off that high this evening.
We will have to wait for wave (v) to complete before turning bullish again in wave (i).
Tomorrow;
Watch for wave ‘v’ of (v) to complete with one more push below 106.78.
[/vc_column_text][/vc_column][/vc_row]
[vc_row][vc_column][vc_separator border_width=”5″][/vc_column][/vc_row][vc_row][vc_column][vc_column_text]
DOW JONES INDUSTRIALS
[/vc_column_text][/vc_column][/vc_row][vc_row][vc_column][vc_separator border_width=”5″][/vc_column][/vc_row][vc_row][vc_column width=”2/3″][vc_custom_heading text=”1 hr” use_theme_fonts=”yes”][vc_column_text]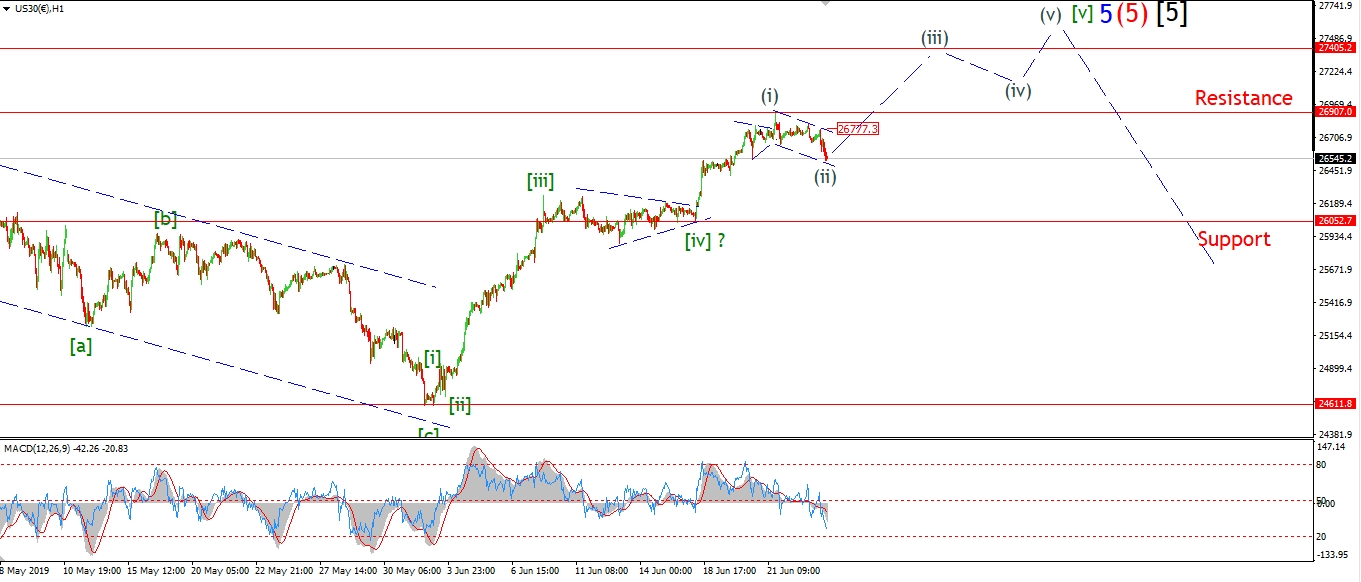 [/vc_column_text][/vc_column][vc_column width=”1/3″][vc_custom_heading text=”4 Hours” use_theme_fonts=”yes”][vc_column_text]
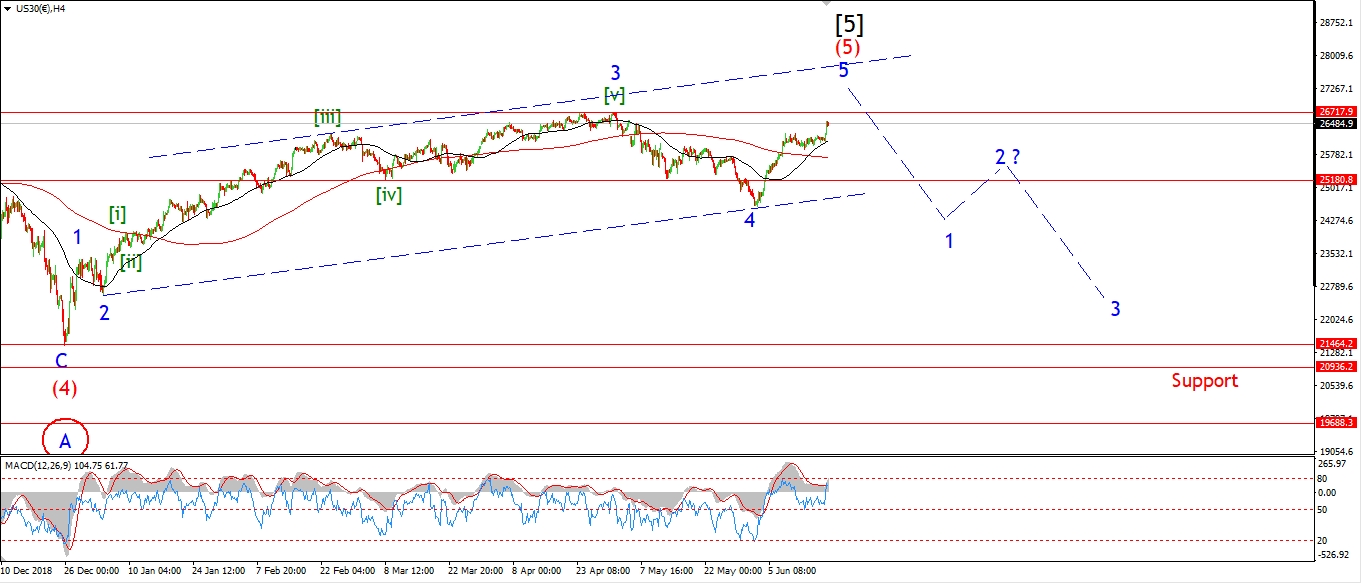 [/vc_column_text][vc_custom_heading text=”Daily” use_theme_fonts=”yes”][vc_column_text]
 [/vc_column_text][/vc_column][/vc_row]
[vc_row][vc_column][vc_column_text]
I am working with a different take on the recent action this evening.
The decline in the Dow over the past few sessions is still in three waves off the recent highs at 26907.
This decline is counted as a correction within wave [v]
and is now labelled as wave (ii) of [v].
The action today completes a bullish impulse wave off the wave [iv] triangle,
and this suggests that wave (iii) of [v] is now set to begin.
Wave (iii) should rally above 27000 over the next week or so.
Tomorrow;
Watch for the price to find support at the lower trend channel line forming wave (ii).
A rise above 26780 will signal wave (iii) has begun.
[/vc_column_text][/vc_column][/vc_row]
[vc_row][vc_column][vc_separator border_width=”5″][/vc_column][/vc_row][vc_row][vc_column][vc_column_text]
GOLD
[/vc_column_text][/vc_column][/vc_row][vc_row][vc_column][vc_separator border_width=”5″][/vc_column][/vc_row][vc_row][vc_column width=”2/3″][vc_custom_heading text=”1 hr” use_theme_fonts=”yes”][vc_column_text]
 [/vc_column_text][/vc_column][vc_column width=”1/3″][vc_custom_heading text=”4 Hours” use_theme_fonts=”yes”][vc_column_text]
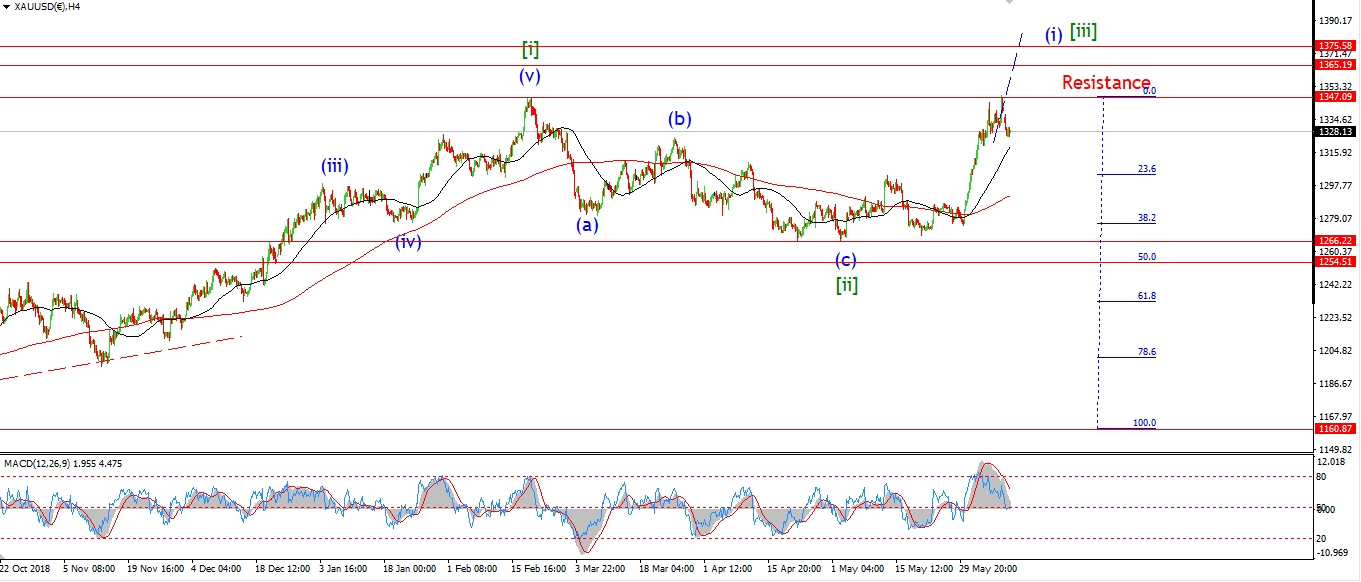 [/vc_column_text][vc_custom_heading text=”Daily” use_theme_fonts=”yes”][vc_column_text]
 [/vc_column_text][/vc_column][/vc_row]
[vc_row][vc_column][vc_column_text]
Finally Gold is beginning its decline off the wave (i) high at 1438.
So far the action looks corrective,
and this decline should develop a more over the coming week,
with support for wave (ii) at the previous fourth wave of 1340.
Wave (ii) may not get that far at all,
but the previous fourth wave at one lower degree is a commoon target for a correction.
Tomorrow;
Wave ‘a’ of ‘ii’ may even have completed at todays lows.
So wave ‘b’ should create a lower high below 1438,
and wave ‘c’ will then finish the correction towards the end of the week.
[/vc_column_text][/vc_column][/vc_row]
[vc_row][vc_column][vc_separator border_width=”5″][/vc_column][/vc_row][vc_row][vc_column][vc_column_text]
U.S CRUDE OIL
[/vc_column_text][/vc_column][/vc_row][vc_row][vc_column][vc_separator border_width=”5″][/vc_column][/vc_row][vc_row][vc_column width=”2/3″][vc_custom_heading text=”1 hr” use_theme_fonts=”yes”][vc_column_text] [/vc_column_text][/vc_column][vc_column width=”1/3″][vc_custom_heading text=”4 Hours” use_theme_fonts=”yes”][vc_column_text]
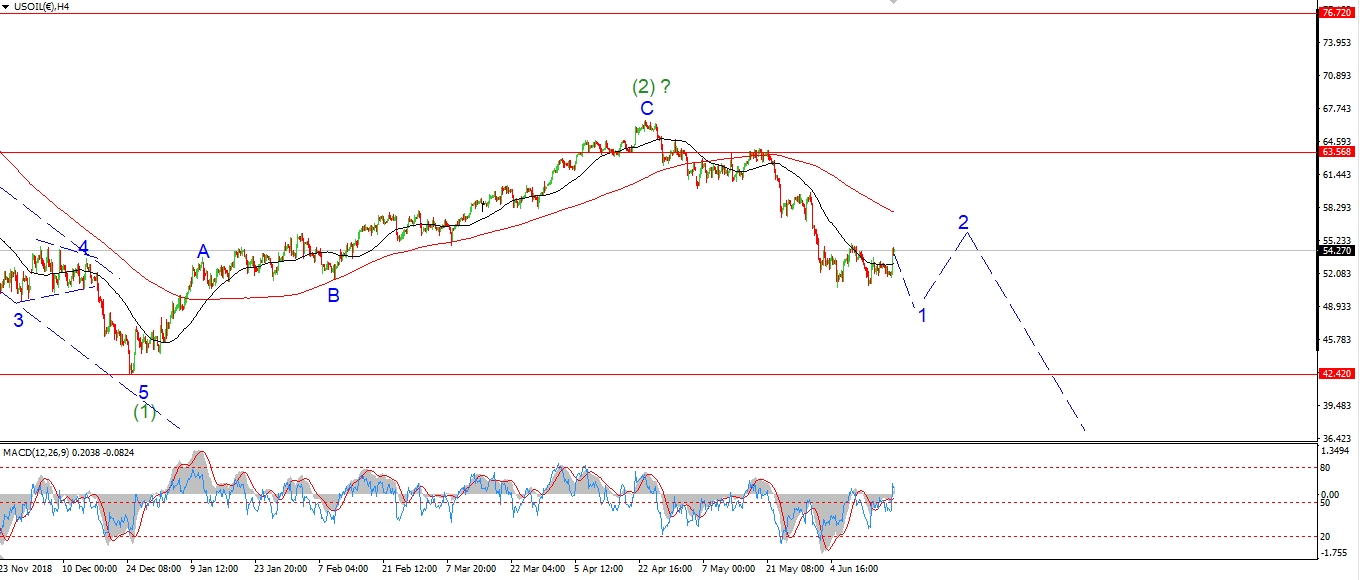 [/vc_column_text][vc_custom_heading text=”Daily” use_theme_fonts=”yes”][vc_column_text]
 [/vc_column_text][/vc_column][/vc_row]
[vc_row][vc_column][vc_column_text]
Crude is topping out now in either wave [iv] or wave [a].
It is still too early to say which short term pattern is correct though.
But both of these short term wave counts
should produce a decline back into about 53.00 at a minimum over the coming week.
And both counts should start with a spike lower and a lower high as shown.
So a decline is on the cards in the short term.
Tomorrow;
Watch for wave (i) of [v] to begin with a break of the previous wave ‘iv’ low at 56.75.
[/vc_column_text][/vc_column][/vc_row]
[vc_row][vc_column][vc_separator border_width=”5″][/vc_column][/vc_row][vc_row][vc_column][vc_column_text]
US 10 yr Treasuries.
[/vc_column_text][/vc_column][/vc_row][vc_row][vc_column][vc_separator border_width=”5″][/vc_column][/vc_row][vc_row][vc_column width=”2/3″][vc_custom_heading text=”1 hr” use_theme_fonts=”yes”][vc_column_text] [/vc_column_text][/vc_column][vc_column width=”1/3″][vc_custom_heading text=”4 Hours” use_theme_fonts=”yes”][vc_column_text]
 [/vc_column_text][vc_custom_heading text=”Daily” use_theme_fonts=”yes”][vc_column_text]
 [/vc_column_text][/vc_column][/vc_row]
[vc_row][vc_column][vc_column_text]
The ambiguity continues in bonds today!
The price is drifting higher rather than rallying as expected in wave (iii).
The wave (iii) count is not ruled out just yet,
but if we do not see a rally above 128.24 tomorrow,
then I will consider the alternate count.
Tomorrow;
Wave ‘iii’ of (iii) must push higher to validate the current count.
127.43 must hold from here.
[/vc_column_text][/vc_column][/vc_row]
[vc_row][vc_column][vc_separator border_width=”5″][/vc_column][/vc_row][vc_row][vc_column][vc_column_text]
SILVER
[/vc_column_text][/vc_column][/vc_row][vc_row][vc_column][vc_separator border_width=”5″][/vc_column][/vc_row][vc_row][vc_column width=”2/3″][vc_custom_heading text=”1 hr” use_theme_fonts=”yes”][vc_column_text]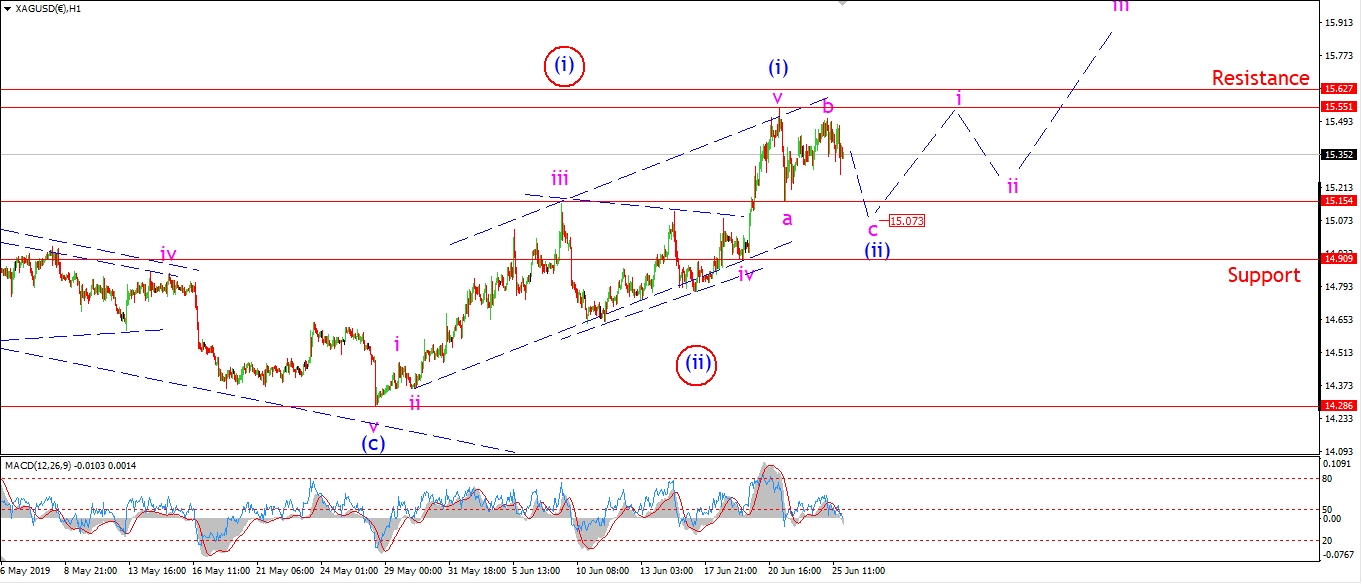 [/vc_column_text][/vc_column][vc_column width=”1/3″][vc_custom_heading text=”4 Hours” use_theme_fonts=”yes”][vc_column_text]
 [/vc_column_text][vc_custom_heading text=”Daily” use_theme_fonts=”yes”][vc_column_text]
 [/vc_column_text][/vc_column][/vc_row]
[vc_row][vc_column][vc_column_text]
Silver is dropping off the wave ‘b’ high today in a very choppy manner.
Wave ‘c’ is now likely underway,
but the pattern is getting a little more complex overall.
Wave ‘c’ should continue below 15.15 to complete wave (ii).
And then wave (iii) should begin with a small impulse wave as shown.
Tomorrow;
watch for wave ‘c’ to drop below 15.15 to complete wave (ii).
A break of 15.55 will trigger the alternate short term count.
[/vc_column_text][/vc_column][/vc_row]
[vc_row][vc_column][vc_separator border_width=”5″][/vc_column][/vc_row][vc_row][vc_column][vc_column_text]
S&P 500.
[/vc_column_text][/vc_column][/vc_row][vc_row][vc_column][vc_separator border_width=”5″][/vc_column][/vc_row][vc_row][vc_column width=”2/3″][vc_custom_heading text=”1 hr” use_theme_fonts=”yes”][vc_column_text]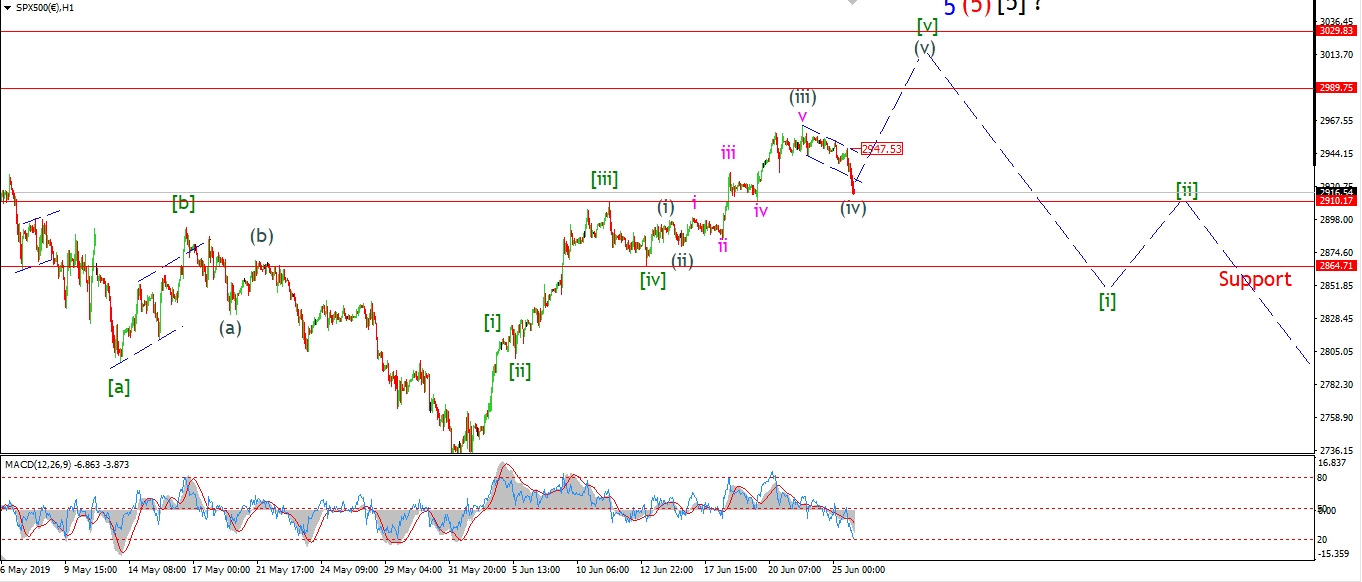 [/vc_column_text][/vc_column][vc_column width=”1/3″][vc_custom_heading text=”4 Hours” use_theme_fonts=”yes”][vc_column_text]
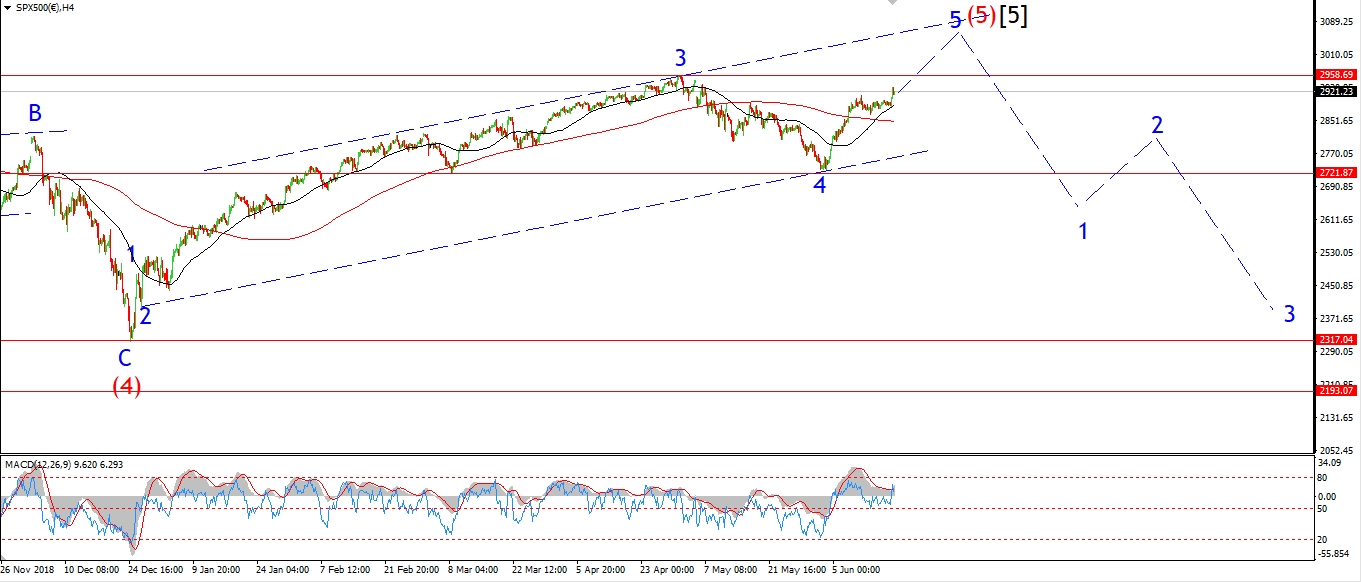 [/vc_column_text][vc_custom_heading text=”Daily” use_theme_fonts=”yes”][vc_column_text]
 [/vc_column_text][/vc_column][/vc_row]
[vc_row][vc_column][vc_column_text]
The decline in the S&P is a little more pronounced than the Dow today.
Which calls into question the current wave count.
But for the moment,
I still think this decline is more likely corrective in a possible fourth wave.
With one more high in wave (v) left on the cards,
to break that illusive 3000 level and complete the bull market.
If we see a rebound above 2947 tomorrow,
that will signal wave (v) has begun.
And then see should be clear to rally into that final high.
Being the perma-bear that I am,
I am aware that we have made a new all time high recently.
and this does theoretically complete the pattern.
With this in mind,
I will be vigilant just in case this decline actually does develop impulsively.
Tomorrow;
Watch for 2910 to hold and for wave (v) to rally above 2947.
[/vc_column_text][/vc_column][/vc_row]
[vc_row][vc_column][vc_separator border_width=”5″][/vc_column][/vc_row]