
[vc_row][vc_column][vc_separator border_width=”5″][/vc_column][/vc_row]
[vc_row][vc_column][vc_column_text]
Good evening one and all.
[/vc_column_text][/vc_column][/vc_row]
[vc_row][vc_column][vc_separator border_width=”5″][/vc_column][/vc_row]
[vc_row][vc_column][vc_column_text]
EURUSD
[/vc_column_text][/vc_column][/vc_row]
[vc_row][vc_column][vc_separator border_width=”5″][/vc_column][/vc_row][vc_row][vc_column width=”2/3″][vc_custom_heading text=”1 hr” use_theme_fonts=”yes”][vc_column_text]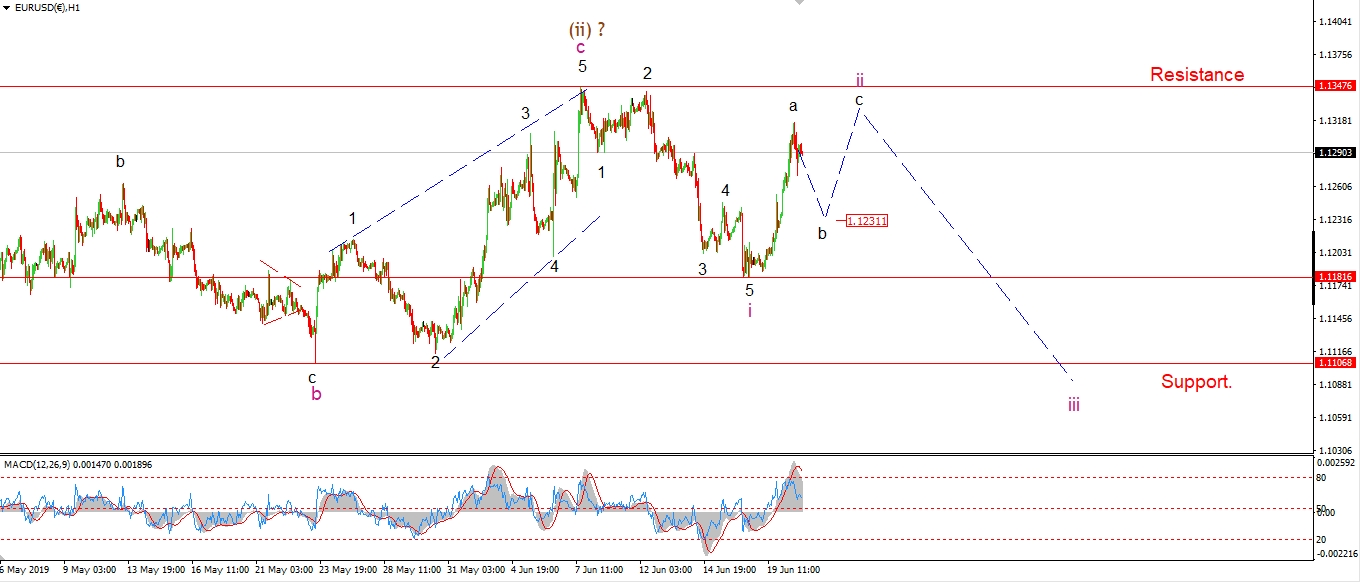 [/vc_column_text][/vc_column][vc_column width=”1/3″][vc_custom_heading text=”4 Hours” use_theme_fonts=”yes”][vc_column_text]
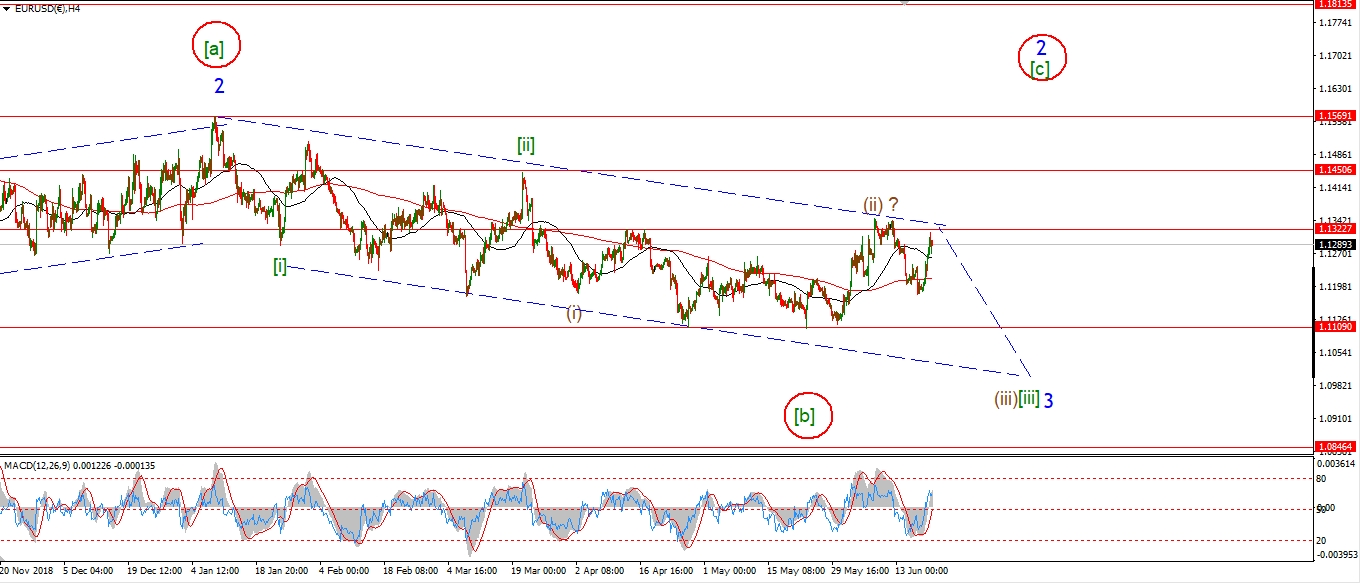 [/vc_column_text][vc_custom_heading text=”Daily” use_theme_fonts=”yes”][vc_column_text]
 [/vc_column_text][/vc_column][/vc_row]
[vc_row][vc_column][vc_column_text]
I want to take a look at the alternate count on the 4hr chart tonight.
This count is circled in red on the top right,
and allows for a larger wave ‘2’ to unfold over the coming months.
Even though EURUSD has fallen over the last few months,
the market has not accelerated lower as expected.
So I have to prepare for the possibility that there is something different going on here.
The alternate count calls for a rally in wave [c] of ‘2’,
this wave should carry up to 1.1570 at a minimum before falling down into wave ‘3’ blue again.
If we see a break of the recent high at 1.1347 again,
I will switch to that alternate count and work from there.
Tomorrow;
The price must hold below 1.1347 in wave ‘ii’ pink.
And then fall into wave ‘iii’ of (iii).
[/vc_column_text][/vc_column][/vc_row]
[vc_row][vc_column][vc_separator border_width=”5″][/vc_column][/vc_row][vc_row][vc_column][vc_column_text]
GBPUSD
[/vc_column_text][/vc_column][/vc_row][vc_row][vc_column][vc_separator border_width=”5″][/vc_column][/vc_row][vc_row][vc_column width=”2/3″][vc_custom_heading text=”1 hr” use_theme_fonts=”yes”][vc_column_text]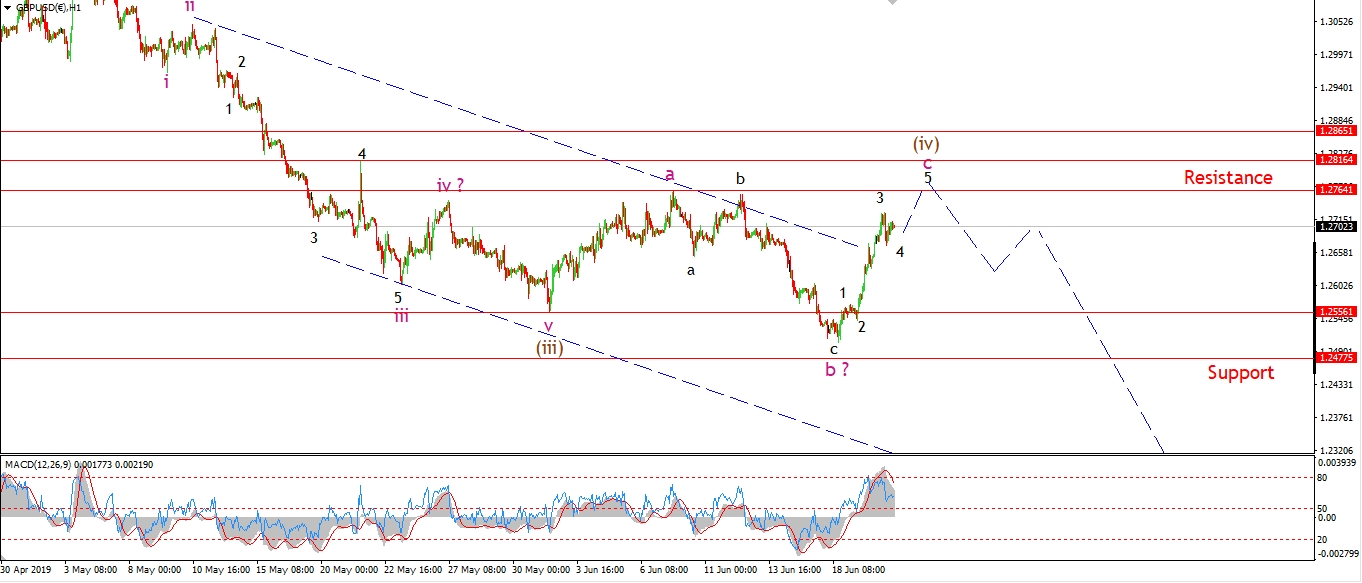 [/vc_column_text][/vc_column][vc_column width=”1/3″][vc_custom_heading text=”4 Hours” use_theme_fonts=”yes”][vc_column_text]
 [/vc_column_text][vc_custom_heading text=”Daily” use_theme_fonts=”yes”][vc_column_text]
 [/vc_column_text][/vc_column][/vc_row]
[vc_row][vc_column][vc_column_text]
I have switched to the alternate count in cable tonight.
The rally this week seems to fit a five wave structure a little better,
so I am labeling this as wave ‘c’ of (iv).
Wave (iv) has traced out an expanded flat.
And wave (v) should still carry the price lower again soon.
I expect wave ‘c’ will find resistance at 1.2816.
Tomorrow;
Watch for wave ‘c’ to break 1.2764 at the previous wave ‘a’ pink.
Price should then decline into wave (v).
[/vc_column_text][/vc_column][/vc_row]
[vc_row][vc_column][vc_separator border_width=”5″][/vc_column][/vc_row][vc_row][vc_column][vc_column_text]
USDJPY
[/vc_column_text][/vc_column][/vc_row][vc_row][vc_column][vc_separator border_width=”5″][/vc_column][/vc_row][vc_row][vc_column width=”2/3″][vc_custom_heading text=”1 hr” use_theme_fonts=”yes”][vc_column_text]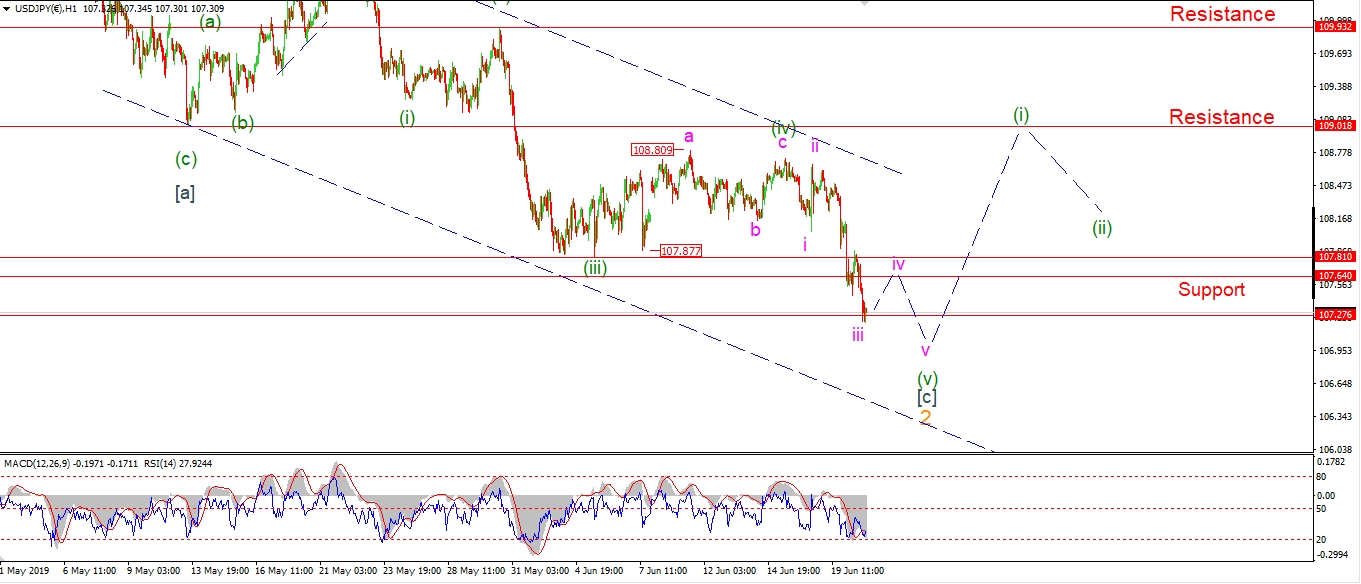 [/vc_column_text][/vc_column][vc_column width=”1/3″][vc_custom_heading text=”4 Hours” use_theme_fonts=”yes”][vc_column_text]
 [/vc_column_text][vc_custom_heading text=”Daily” use_theme_fonts=”yes”][vc_column_text]
 [/vc_column_text][/vc_column][/vc_row]
[vc_row][vc_column][vc_column_text]
USDJPY has dropped into the support level at 107.27 this evening.
This level marks the point of equality between wave [a] and [c].
But the drop in wave (v) of [c] does not look complete yet.
Wave ‘iii’ of (v) is complete at todays lows,
we should see a correction higher tomorrow in wave ‘iv’
and then wave ‘v’ will likely break support at 107.27 to complete wave (v).
Tomorrow;
watch for a small corrective rise in wave ‘iv’ pink which should stop at 107.80.
Wave ‘v’ down may even begin tomorrow.
[/vc_column_text][/vc_column][/vc_row]
[vc_row][vc_column][vc_separator border_width=”5″][/vc_column][/vc_row][vc_row][vc_column][vc_column_text]
DOW JONES INDUSTRIALS
[/vc_column_text][/vc_column][/vc_row][vc_row][vc_column][vc_separator border_width=”5″][/vc_column][/vc_row][vc_row][vc_column width=”2/3″][vc_custom_heading text=”1 hr” use_theme_fonts=”yes”][vc_column_text]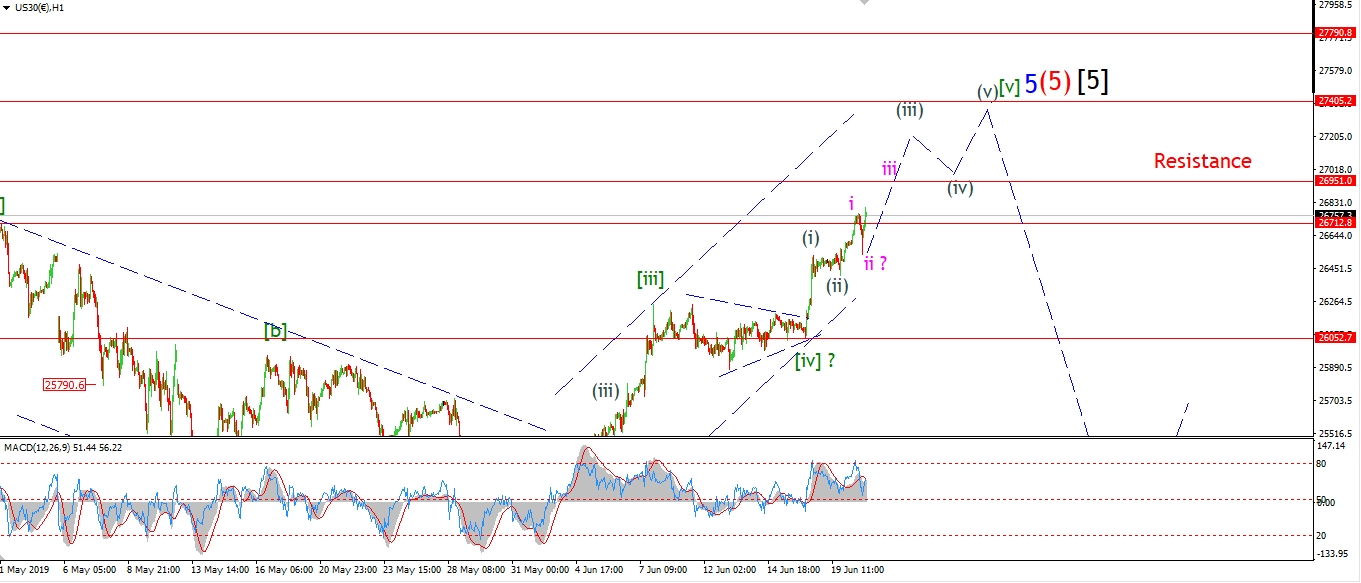 [/vc_column_text][/vc_column][vc_column width=”1/3″][vc_custom_heading text=”4 Hours” use_theme_fonts=”yes”][vc_column_text]
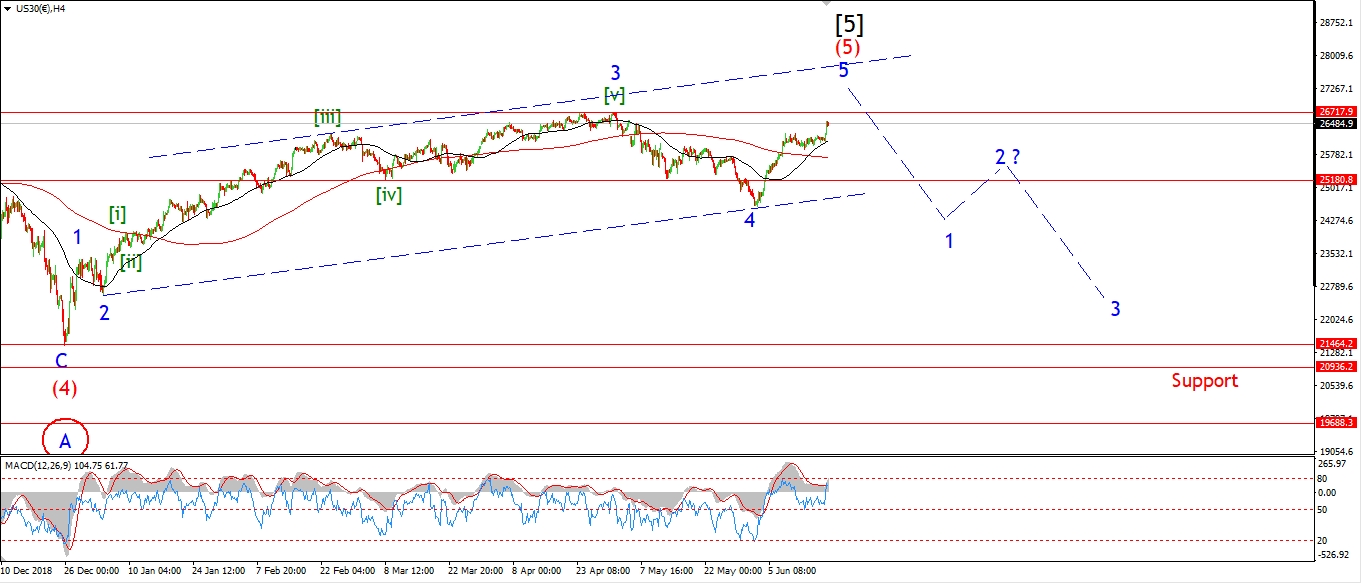 [/vc_column_text][vc_custom_heading text=”Daily” use_theme_fonts=”yes”][vc_column_text]
 [/vc_column_text][/vc_column][/vc_row]
[vc_row][vc_column][vc_column_text]
The market sold off this afternoon and then rallied again into the close this evening.
The DOW has regained most of the loss now.
I have labelled this action as waves ‘i’ and ‘ii’ of (iii).
Wave ‘ii’ could be complete at todays lows.
A sharp rally tomorrow will confirm wave ‘iii’ of (iii) has begun.
If this count is correct,
then stocks will continue to rally next week and complete a five wave pattern in wave [v]
possibly within the next 10 days or so.
We should see a new all time high somewhere in the region of 27500.
Tomorrow;
Watch for wave ‘iii’ of (iii) to push higher towards 26950 again.
The wave (ii) low must hold.
[/vc_column_text][/vc_column][/vc_row]
[vc_row][vc_column][vc_separator border_width=”5″][/vc_column][/vc_row][vc_row][vc_column][vc_column_text]
GOLD
[/vc_column_text][/vc_column][/vc_row][vc_row][vc_column][vc_separator border_width=”5″][/vc_column][/vc_row][vc_row][vc_column width=”2/3″][vc_custom_heading text=”1 hr” use_theme_fonts=”yes”][vc_column_text]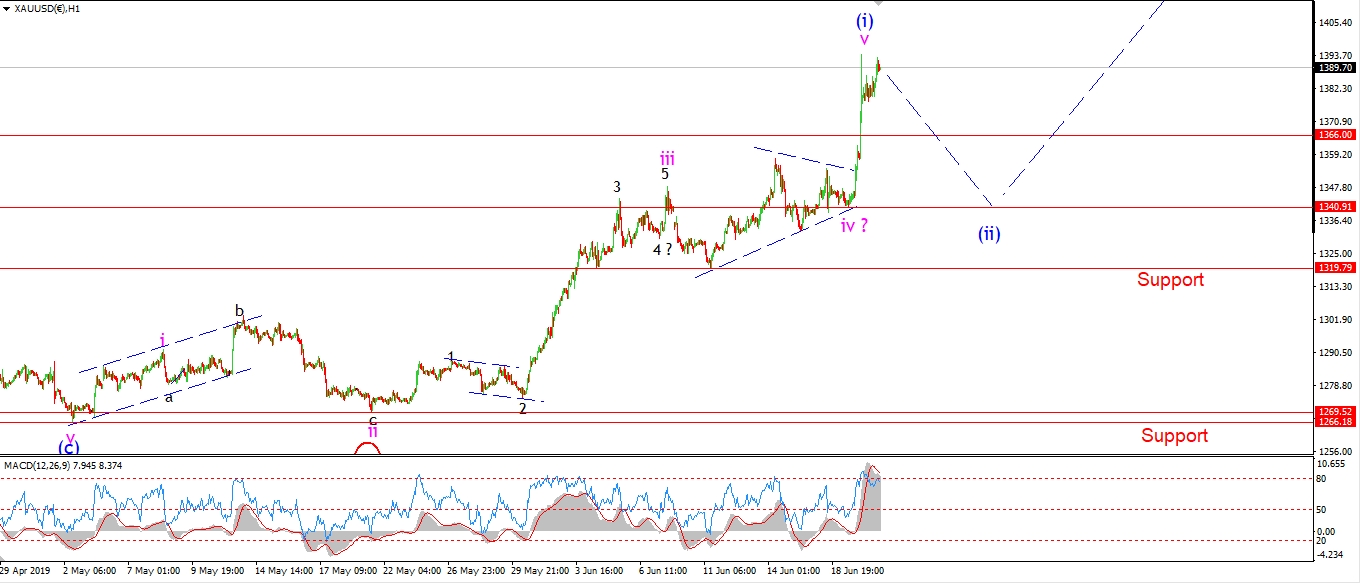 [/vc_column_text][/vc_column][vc_column width=”1/3″][vc_custom_heading text=”4 Hours” use_theme_fonts=”yes”][vc_column_text]
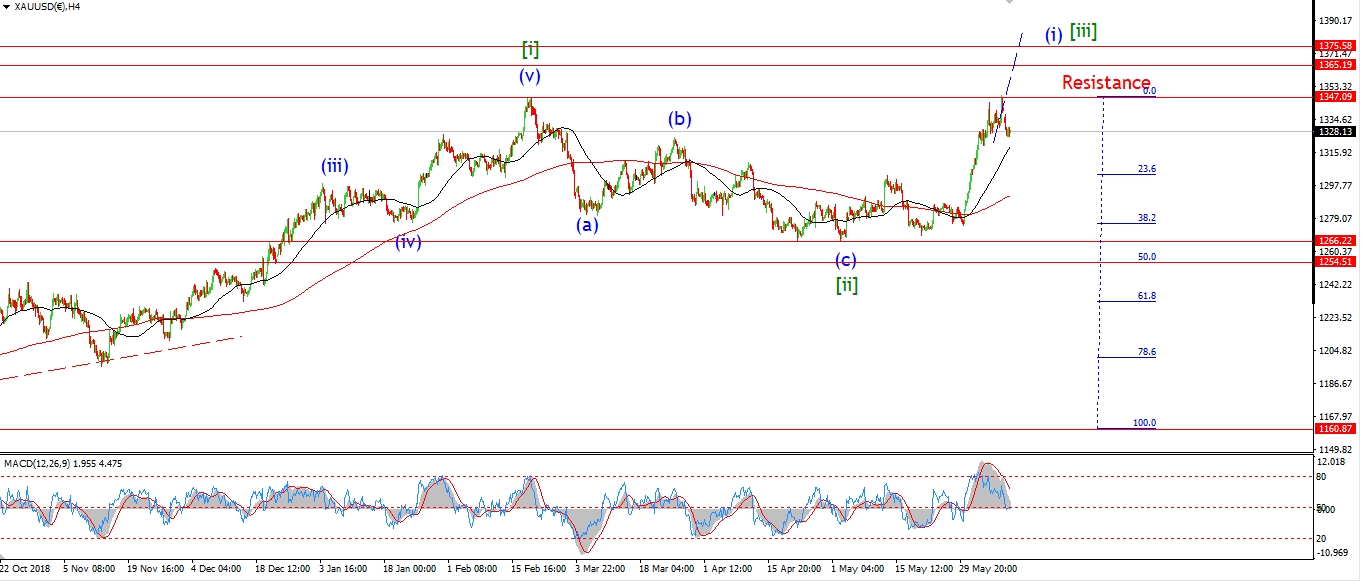 [/vc_column_text][vc_custom_heading text=”Daily” use_theme_fonts=”yes”][vc_column_text]
 [/vc_column_text][/vc_column][/vc_row]
[vc_row][vc_column][vc_column_text]
Gold blasted up through resistance last night reaching 1394 at the high.
The triangle wave ‘iv’ shown in the short term chart suggests that this rally is in wave ‘v’ of (i).
And that completes a nice $130 rally,
and five waves up for gold since the recent lows at 1266.
The pattern now calls for a correction in wave (ii) blue over the coming week.
But this rally is far from over according to this wave count.
Wave (iii) of [iii] of ‘3’ is coming our way,
and that one should be explosive.
Tomorrow;
Wave (i) should complete soon enough.
Watch for wave (ii) to begin with a drop off the high in three waves.
[/vc_column_text][/vc_column][/vc_row]
[vc_row][vc_column][vc_separator border_width=”5″][/vc_column][/vc_row][vc_row][vc_column][vc_column_text]
U.S CRUDE OIL
[/vc_column_text][/vc_column][/vc_row][vc_row][vc_column][vc_separator border_width=”5″][/vc_column][/vc_row][vc_row][vc_column width=”2/3″][vc_custom_heading text=”1 hr” use_theme_fonts=”yes”][vc_column_text]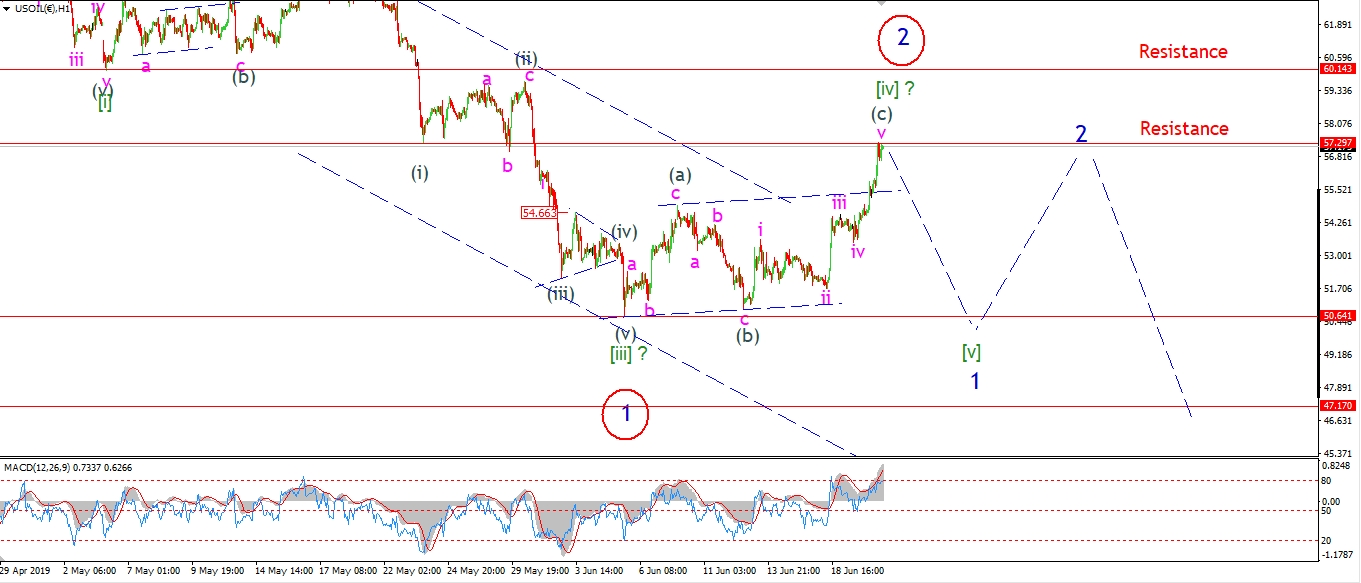 [/vc_column_text][/vc_column][vc_column width=”1/3″][vc_custom_heading text=”4 Hours” use_theme_fonts=”yes”][vc_column_text]
 [/vc_column_text][vc_custom_heading text=”Daily” use_theme_fonts=”yes”][vc_column_text]
 [/vc_column_text][/vc_column][/vc_row]
[vc_row][vc_column][vc_column_text]
Crude has rallied again today in wave (c) of [iv] as expected.
But the rally has extended and gone further than expected above the upper trend channel line.
So I am considering the alternate count at the moment.
this count calls for a larger rally in wave ‘2’ blue.
Which allows for a larger corrective rally.
Either way,
this rally should prove corrective,
and wave ‘3’ down should take the price to new lows over the coming summer.
Tomorrow;
Watch for wave [iv] to complete soon.
Wave [iv] must not break 60.14 at the wave [i] low.
Wave [v] down should begin with a lower high off wave [iv].
And wave [v] should break below 50.64 again to complete wave ‘1’.
[/vc_column_text][/vc_column][/vc_row]
[vc_row][vc_column][vc_separator border_width=”5″][/vc_column][/vc_row][vc_row][vc_column][vc_column_text]
US 10 yr Treasuries.
[/vc_column_text][/vc_column][/vc_row][vc_row][vc_column][vc_separator border_width=”5″][/vc_column][/vc_row][vc_row][vc_column width=”2/3″][vc_custom_heading text=”1 hr” use_theme_fonts=”yes”][vc_column_text]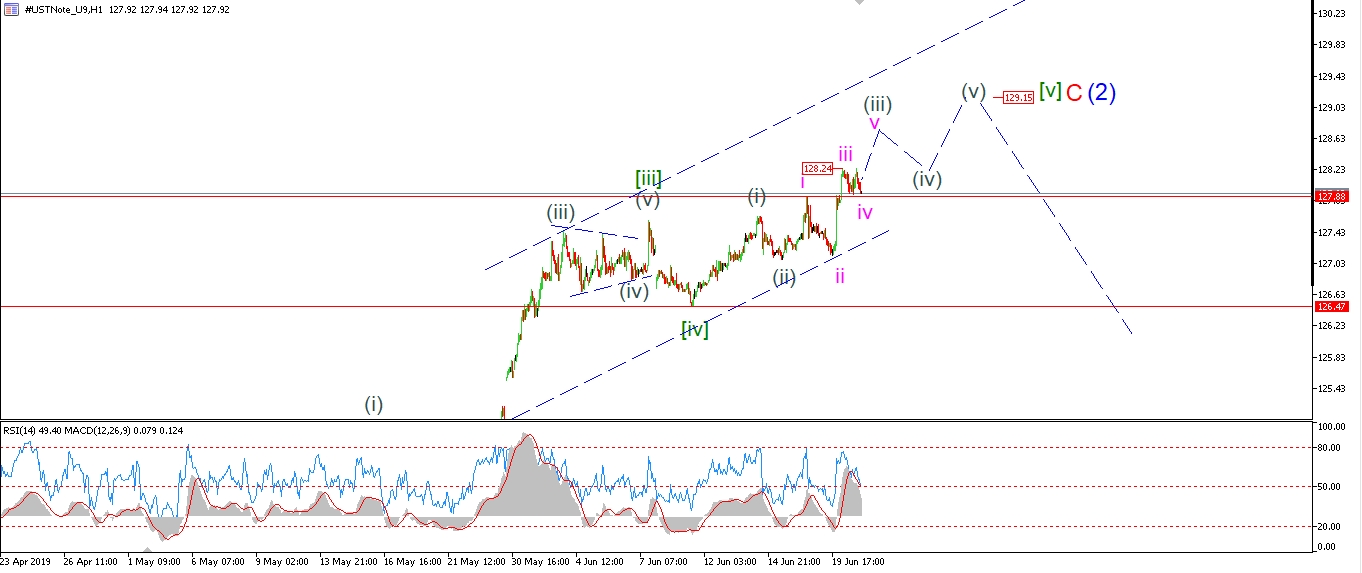 [/vc_column_text][/vc_column][vc_column width=”1/3″][vc_custom_heading text=”4 Hours” use_theme_fonts=”yes”][vc_column_text]
 [/vc_column_text][vc_custom_heading text=”Daily” use_theme_fonts=”yes”][vc_column_text]
 [/vc_column_text][/vc_column][/vc_row]
[vc_row][vc_column][vc_column_text]
I have shown a slightly different count this evening for wave (iii) grey.
the stop start action of late can be viewed as a series of 1,2 waves,
which has resulted in wave ‘iii’ of (iii) creating the newest high.
The rally in Bonds halted today,
in what looks like a small fourth wave correction.
This correction must hold above 127.88 though,
and turn higher in wave ‘v’ of (iii).
Tomorrow;
Watch for wave ‘v’ to push higher again above 128.24.
[/vc_column_text][/vc_column][/vc_row]
[vc_row][vc_column][vc_separator border_width=”5″][/vc_column][/vc_row][vc_row][vc_column][vc_column_text]
SILVER
[/vc_column_text][/vc_column][/vc_row][vc_row][vc_column][vc_separator border_width=”5″][/vc_column][/vc_row][vc_row][vc_column width=”2/3″][vc_custom_heading text=”1 hr” use_theme_fonts=”yes”][vc_column_text]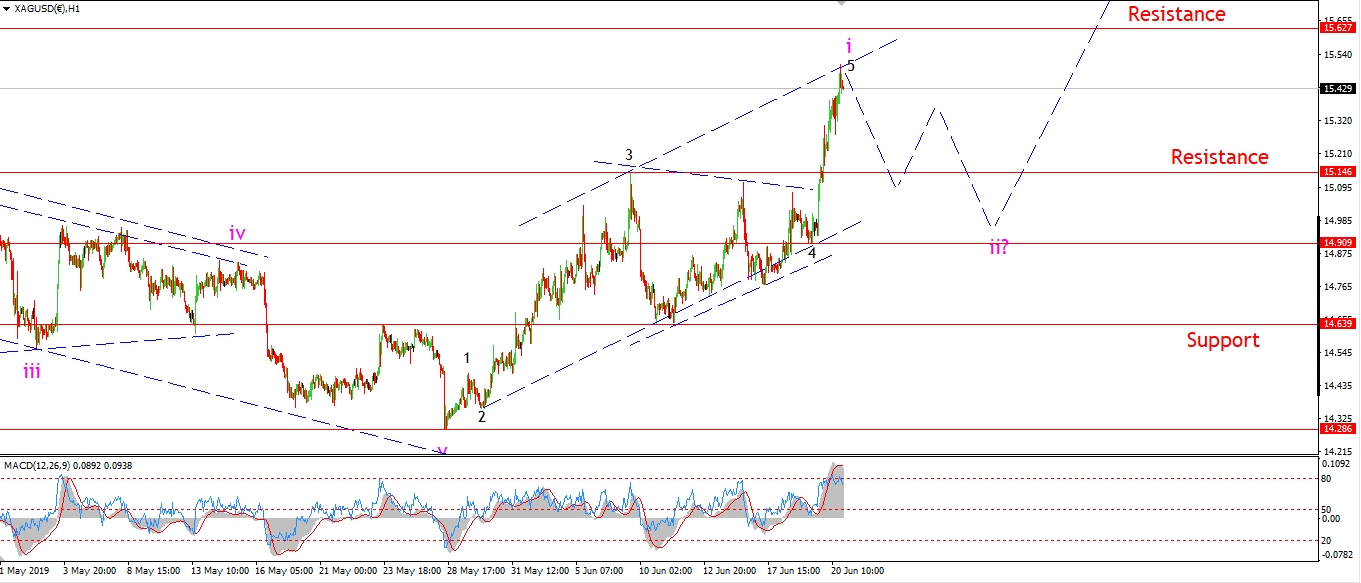 [/vc_column_text][/vc_column][vc_column width=”1/3″][vc_custom_heading text=”4 Hours” use_theme_fonts=”yes”][vc_column_text]
 [/vc_column_text][vc_custom_heading text=”Daily” use_theme_fonts=”yes”][vc_column_text]
 [/vc_column_text][/vc_column][/vc_row]
[vc_row][vc_column][vc_column_text]
Silver has now hit the upper trend channel line in wave ‘5’ of ‘i’.
This fact alone should offer some resistance to the rally in wave ‘i’ and cause a turn into wave ‘ii’.
The low of the previous wave ‘4’ triangle lies at 14.90,
this level will act as support for the correction in wave ‘ii’.
Wave ‘ii’ should trace out a three wave correction.
And at that point we will have a bullish impulse wave complete off the lows with a rally in wave ‘iii’ expected.
Tomorrow;
Watch for wave ‘ii’ to begin with a drop back towards 15.20.
[/vc_column_text][/vc_column][/vc_row]
[vc_row][vc_column][vc_separator border_width=”5″][/vc_column][/vc_row][vc_row][vc_column][vc_column_text]
S&P 500.
[/vc_column_text][/vc_column][/vc_row][vc_row][vc_column][vc_separator border_width=”5″][/vc_column][/vc_row][vc_row][vc_column width=”2/3″][vc_custom_heading text=”1 hr” use_theme_fonts=”yes”][vc_column_text]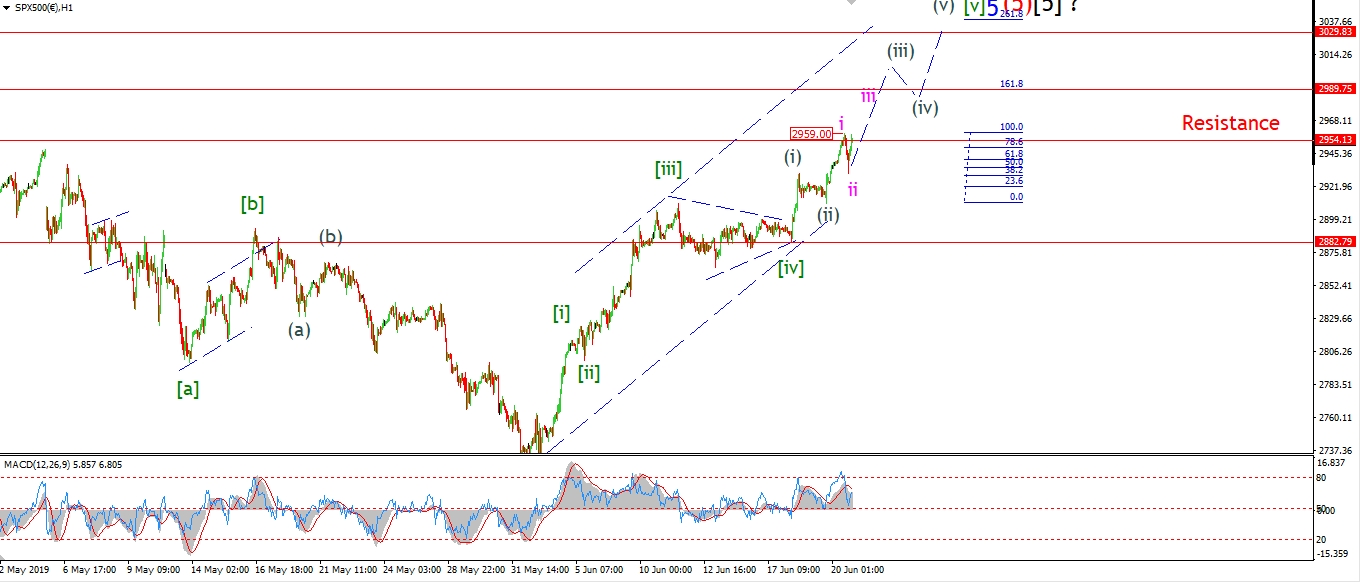 [/vc_column_text][/vc_column][vc_column width=”1/3″][vc_custom_heading text=”4 Hours” use_theme_fonts=”yes”][vc_column_text]
 [/vc_column_text][vc_custom_heading text=”Daily” use_theme_fonts=”yes”][vc_column_text]
 [/vc_column_text][/vc_column][/vc_row]
[vc_row][vc_column][vc_column_text]
After a brief break of the previous all time high at 2954.13
We had similar drop off in the S&P today also.
The price has recovered again and we are finishing the day back at the highs.
The action is viewed as waves ‘i’ and ‘ii’ of (iii).
With wave ‘iii’ of (iii) now likely underway.
A break of the wave ‘i’ high at 2959 again will confirm wave ‘iii’ has begun.
Tomorrow;
Watch for wave ‘iii’ of (iii) to continue higher.
Wave (iii) of [v] is likely to push above 2989 over the coming days,
this level is where wave (iii) reaches 162% of wave (i).
[/vc_column_text][/vc_column][/vc_row]
[vc_row][vc_column][vc_separator border_width=”5″][/vc_column][/vc_row]