
[vc_row][vc_column][vc_separator border_width=”5″][/vc_column][/vc_row]
[vc_row][vc_column][vc_column_text]
Ladies and Gents, hello and welcome back to a new week.
[/vc_column_text][/vc_column][/vc_row]
[vc_row][vc_column][vc_separator border_width=”5″][/vc_column][/vc_row]
[vc_row][vc_column][vc_column_text]
EURUSD
[/vc_column_text][/vc_column][/vc_row]
[vc_row][vc_column][vc_separator border_width=”5″][/vc_column][/vc_row][vc_row][vc_column width=”2/3″][vc_custom_heading text=”1 hr” use_theme_fonts=”yes”][vc_column_text]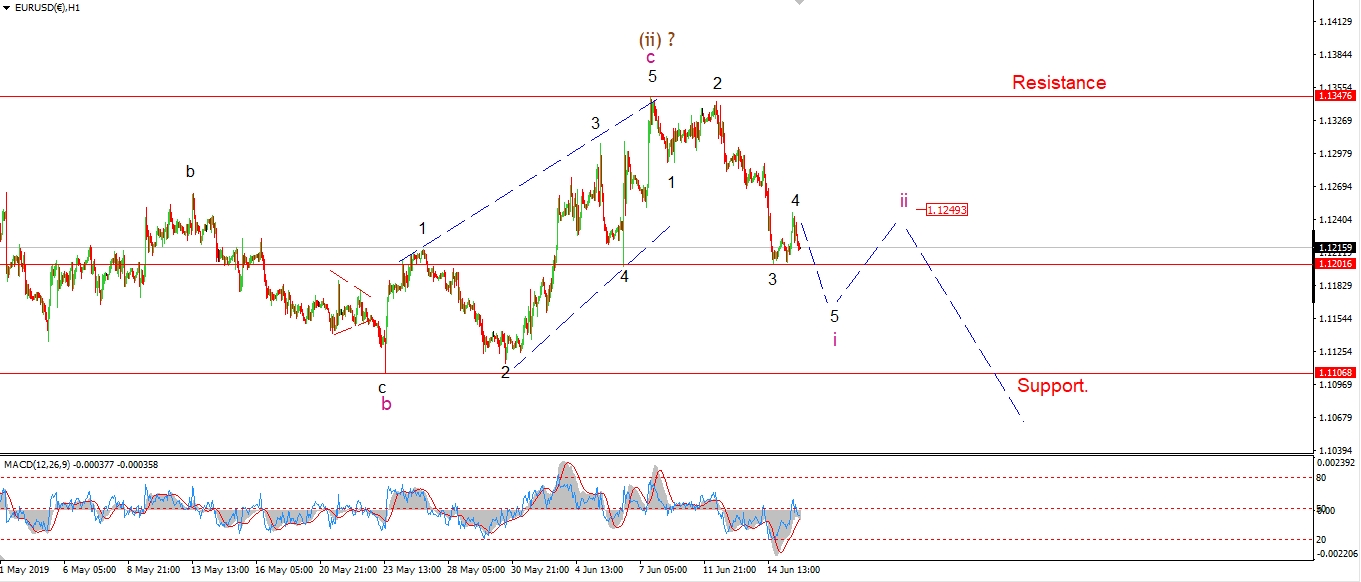 [/vc_column_text][/vc_column][vc_column width=”1/3″][vc_custom_heading text=”4 Hours” use_theme_fonts=”yes”][vc_column_text]
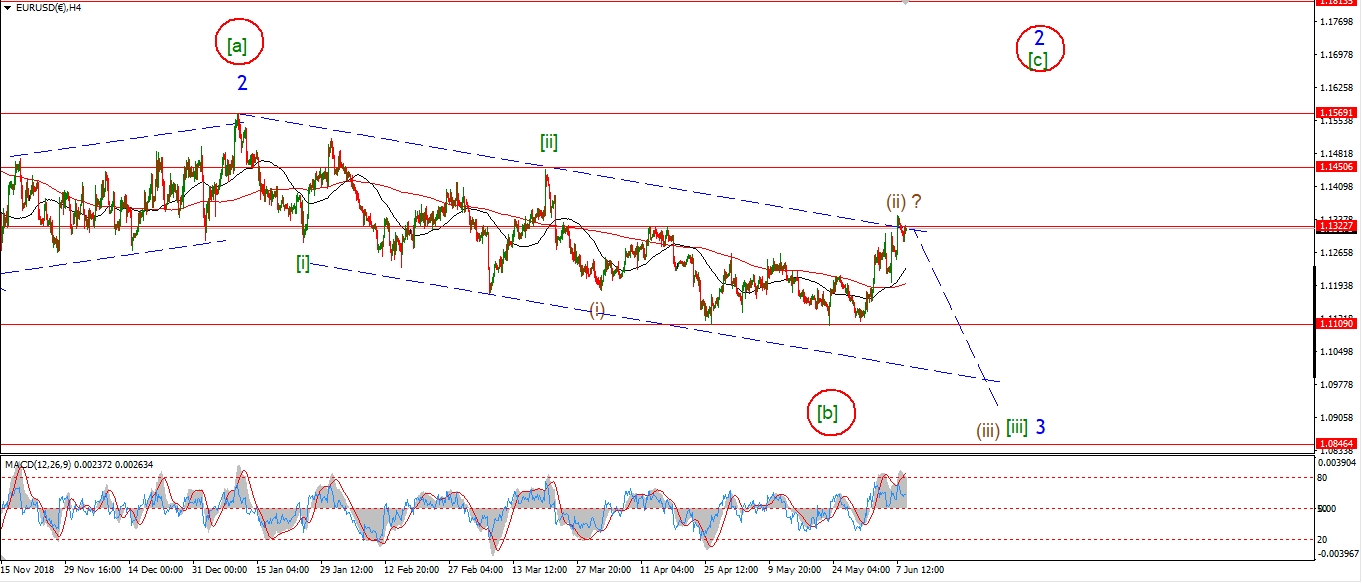 [/vc_column_text][vc_custom_heading text=”Daily” use_theme_fonts=”yes”][vc_column_text]
 [/vc_column_text][/vc_column][/vc_row]
[vc_row][vc_column][vc_column_text]
The five wave pattern off the wave (ii) high is working well so far.
The price retraced higher in three waves today labelled wave ‘4’ of ‘i’.
Wave ‘5’ of ‘i’ is expected to push below 1.1201 at a minimum before wave ‘i’ completes.
But I would like to see a further run down to 1.1150 in wave ‘i’.
Wave ‘ii’ should then recover in three waves
up to about 1.1250 at the wave ‘4’ high.
At that point we will have a bearish impulse wave in place off the high.
Wave ‘iii’ down will then be set to go.
Tomorrow;
Watch for wave ‘i’ down to complete a five wave decline at about 1.1150.
[/vc_column_text][/vc_column][/vc_row]
[vc_row][vc_column][vc_separator border_width=”5″][/vc_column][/vc_row][vc_row][vc_column][vc_column_text]
GBPUSD
[/vc_column_text][/vc_column][/vc_row][vc_row][vc_column][vc_separator border_width=”5″][/vc_column][/vc_row][vc_row][vc_column width=”2/3″][vc_custom_heading text=”1 hr” use_theme_fonts=”yes”][vc_column_text] [/vc_column_text][/vc_column][vc_column width=”1/3″][vc_custom_heading text=”4 Hours” use_theme_fonts=”yes”][vc_column_text]
 [/vc_column_text][vc_custom_heading text=”Daily” use_theme_fonts=”yes”][vc_column_text]
 [/vc_column_text][/vc_column][/vc_row]
[vc_row][vc_column][vc_column_text]
Cable has broken initial support at 1.2556 this evening.
This was the minimum target for wave ‘v’,
but I don’t this wave ‘5’ of ‘v’ is complete yet though.
A break of 1.2477 again will break a previous [b] wave low.
If this level is broken,
it will signal that a larger shift in trend is now underway.
Tomorrow;
Watch for wave ‘v’ to break 1.2477 before turning higher in wave (iv) brown.
[/vc_column_text][/vc_column][/vc_row]
[vc_row][vc_column][vc_separator border_width=”5″][/vc_column][/vc_row][vc_row][vc_column][vc_column_text]
USDJPY
[/vc_column_text][/vc_column][/vc_row][vc_row][vc_column][vc_separator border_width=”5″][/vc_column][/vc_row][vc_row][vc_column width=”2/3″][vc_custom_heading text=”1 hr” use_theme_fonts=”yes”][vc_column_text]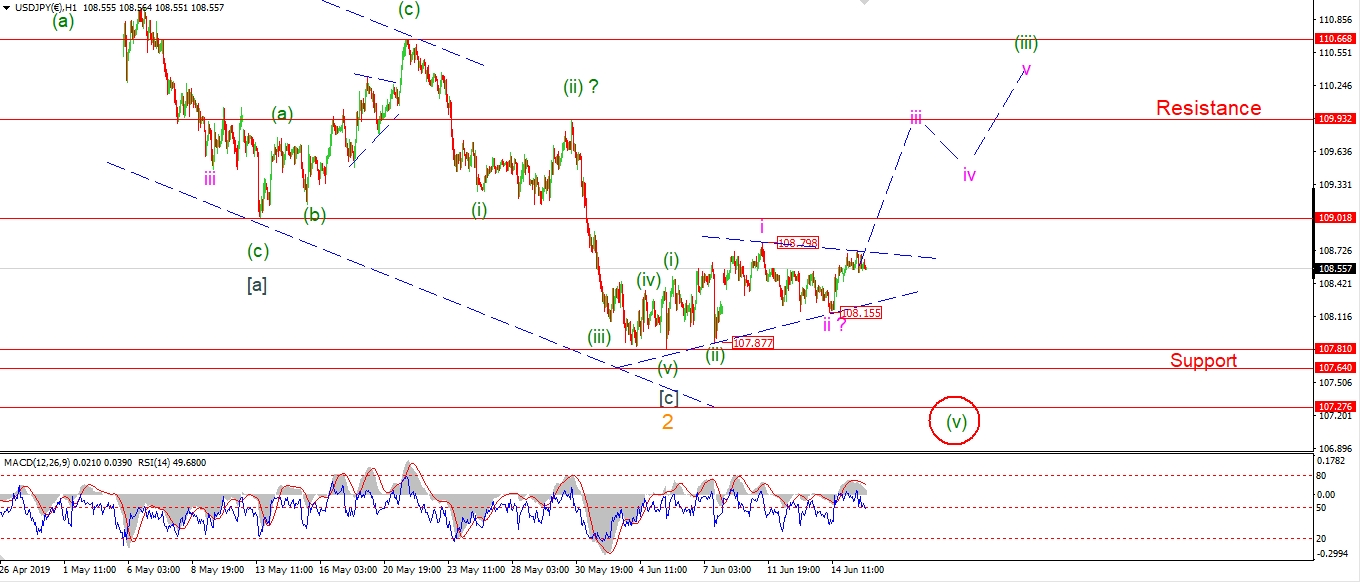 [/vc_column_text][/vc_column][vc_column width=”1/3″][vc_custom_heading text=”4 Hours” use_theme_fonts=”yes”][vc_column_text]
 [/vc_column_text][vc_custom_heading text=”Daily” use_theme_fonts=”yes”][vc_column_text]
 [/vc_column_text][/vc_column][/vc_row]
[vc_row][vc_column][vc_column_text]
USDJPY is rising today but without breaking 108.79 at the wave ‘i’ high yet.
The bullish pattern is still in the balance at the moment,
but the market has created a series of higher lows which is encouraging.
I would like to see a break of 108.79 to rule out the triangle wave (iv) alternate count all together.
If the current short term pattern is correct,
then we should see an acceleration higher this week in wave ‘iii’ of (iii).
This should carry USDJPY up to about 110.00 before completing.
Tomorrow;
Watch for wave ‘iii’ to push higher in a five wave form.
Wave ‘ii’ must hold at 108.15.
[/vc_column_text][/vc_column][/vc_row]
[vc_row][vc_column][vc_separator border_width=”5″][/vc_column][/vc_row][vc_row][vc_column][vc_column_text]
DOW JONES INDUSTRIALS
[/vc_column_text][/vc_column][/vc_row][vc_row][vc_column][vc_separator border_width=”5″][/vc_column][/vc_row][vc_row][vc_column width=”2/3″][vc_custom_heading text=”1 hr” use_theme_fonts=”yes”][vc_column_text] [/vc_column_text][/vc_column][vc_column width=”1/3″][vc_custom_heading text=”4 Hours” use_theme_fonts=”yes”][vc_column_text]
 [/vc_column_text][vc_custom_heading text=”Daily” use_theme_fonts=”yes”][vc_column_text]
 [/vc_column_text][/vc_column][/vc_row]
[vc_row][vc_column][vc_column_text]
I will start tonight on the 4hr chart.
There is a clear head and shoulders pattern now in place off the wave ‘5’ high on May 1st.
The market is now cresting and turning lower at the high of the previous wave ‘3’.
This action will create the right hand shoulder.
The neckline is formed by the wave the previous wave ‘4’ and wave ‘1’ blue.
Also;
Momentum is on the verge of a bearish signal with RSI hovering over the center line.
So if we are about to move down into a third wave,
now is a perfect time to do it!
The short term chart has not changed.
We need to see wave (i) push down to 25222 this week in a five wave form.
Tomorrow;
Wave ‘iii’ of (i) must now fall and break the wave ‘i’ low.
Wave ‘iii’ down should be a sharp move.
Watch for 26248 to hold.
[/vc_column_text][/vc_column][/vc_row]
[vc_row][vc_column][vc_separator border_width=”5″][/vc_column][/vc_row][vc_row][vc_column][vc_column_text]
GOLD
[/vc_column_text][/vc_column][/vc_row][vc_row][vc_column][vc_separator border_width=”5″][/vc_column][/vc_row][vc_row][vc_column width=”2/3″][vc_custom_heading text=”1 hr” use_theme_fonts=”yes”][vc_column_text]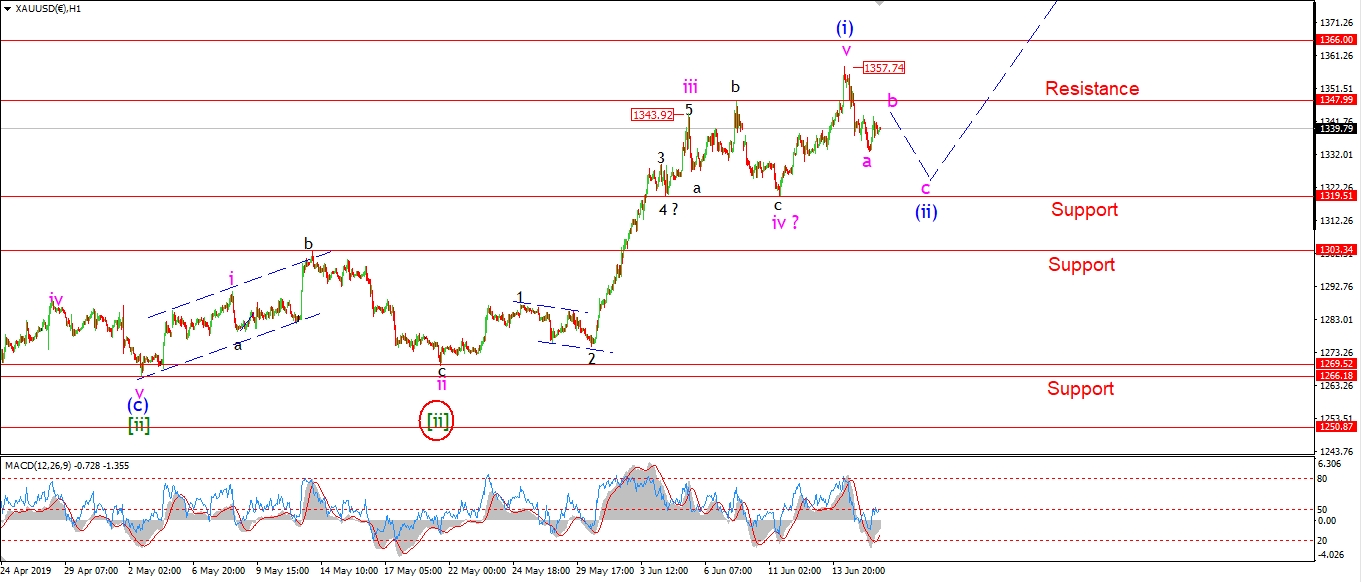 [/vc_column_text][/vc_column][vc_column width=”1/3″][vc_custom_heading text=”4 Hours” use_theme_fonts=”yes”][vc_column_text]
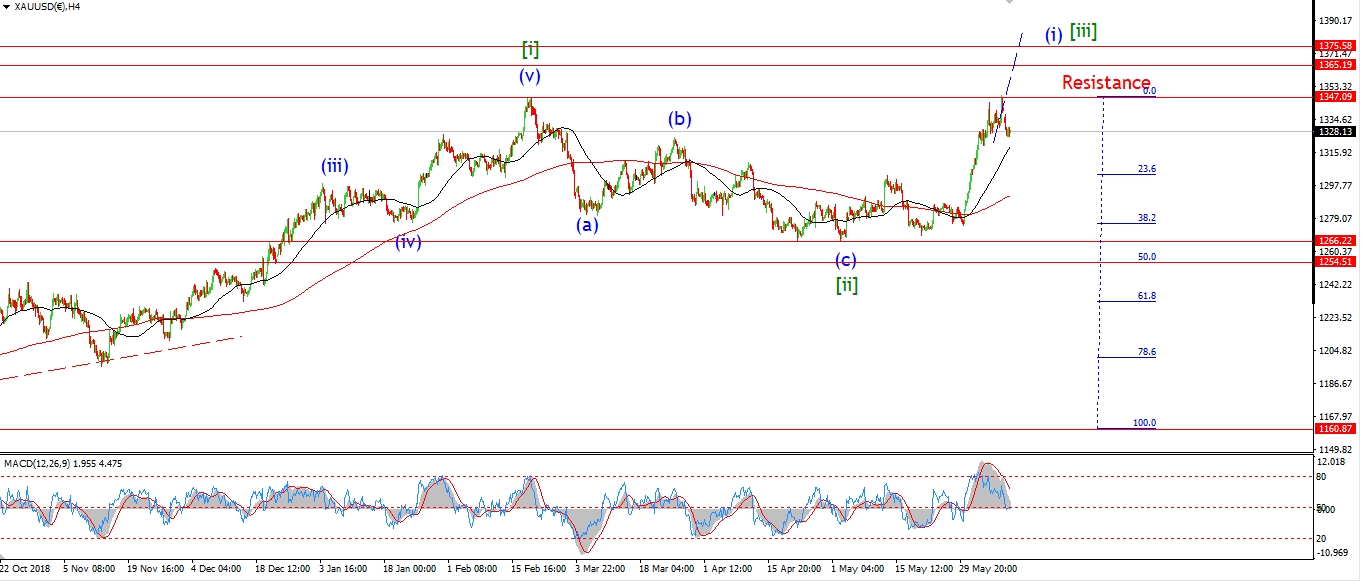 [/vc_column_text][vc_custom_heading text=”Daily” use_theme_fonts=”yes”][vc_column_text]
 [/vc_column_text][/vc_column][/vc_row]
[vc_row][vc_column][vc_column_text]
GOLD has rebounded slightly today after an initial selloff overnight.
The overnight low completed wave ‘a’ of (ii).
And the price is now rising in wave ‘b’ of (ii)
which should complete at a lower high below 1357 tomorrow.
Wave ‘c’ is expected to fall back into initial support formed by the previous wave ‘iv’ low.
and this should complete by Wednesday evening.
Tomorrow;
Watch for wave ‘b’ to complete at about 13.47 in a three wave form.
Wave ‘c’ should begin before the close tomorrow.
[/vc_column_text][/vc_column][/vc_row]
[vc_row][vc_column][vc_separator border_width=”5″][/vc_column][/vc_row][vc_row][vc_column][vc_column_text]
U.S CRUDE OIL
[/vc_column_text][/vc_column][/vc_row][vc_row][vc_column][vc_separator border_width=”5″][/vc_column][/vc_row][vc_row][vc_column width=”2/3″][vc_custom_heading text=”1 hr” use_theme_fonts=”yes”][vc_column_text]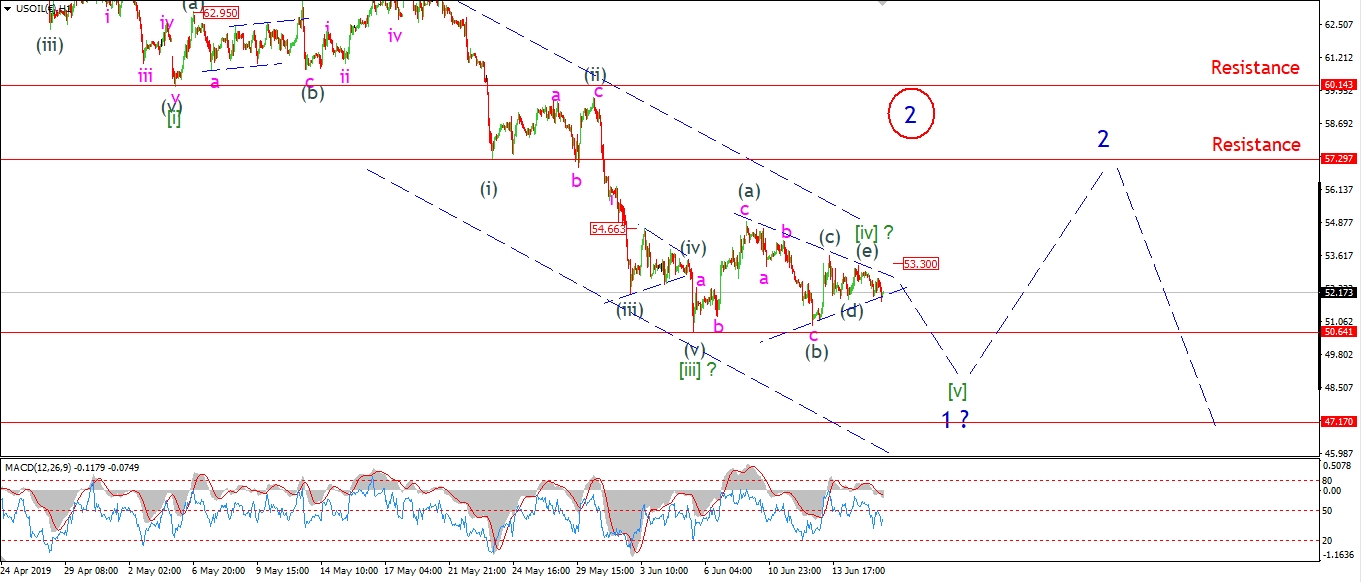 [/vc_column_text][/vc_column][vc_column width=”1/3″][vc_custom_heading text=”4 Hours” use_theme_fonts=”yes”][vc_column_text]
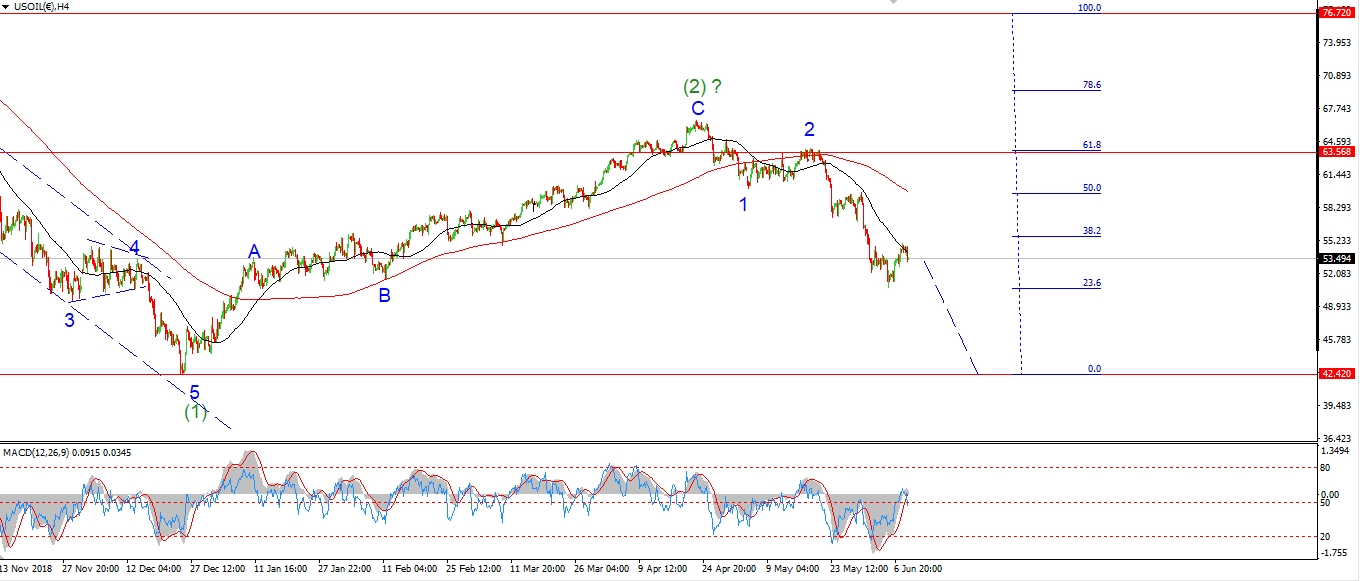 [/vc_column_text][vc_custom_heading text=”Daily” use_theme_fonts=”yes”][vc_column_text]
 [/vc_column_text][/vc_column][/vc_row]
[vc_row][vc_column][vc_column_text]
Wave [iv] may have completed as a triangle at Fridays high.
This is shown as the most likely count now.
If the price continues to fall from here and breaks below 50.64,
that will confirm the count and we can expect wave [v] of ‘1’ to head lower
and complete between 47.00 and 48.00.
This should be the last decline to complete the larger pattern in wave ‘1’ of (5).
I expect we will see a recovery over the coming weeks in wave ‘2’ blue.
Wave ‘2’ should correct higher up to resistance at 57.00 again in a three wave form.
Tomorrow;
Watch for wave [v] to continue lower in five waves and break 50.64 at a minimum.
53.30 should hold at the wave [iv] high.
[/vc_column_text][/vc_column][/vc_row]
[vc_row][vc_column][vc_separator border_width=”5″][/vc_column][/vc_row][vc_row][vc_column][vc_column_text]
US 10 yr Treasuries.
[/vc_column_text][/vc_column][/vc_row][vc_row][vc_column][vc_separator border_width=”5″][/vc_column][/vc_row][vc_row][vc_column width=”2/3″][vc_custom_heading text=”1 hr” use_theme_fonts=”yes”][vc_column_text] [/vc_column_text][/vc_column][vc_column width=”1/3″][vc_custom_heading text=”4 Hours” use_theme_fonts=”yes”][vc_column_text]
 [/vc_column_text][vc_custom_heading text=”Daily” use_theme_fonts=”yes”][vc_column_text]
 [/vc_column_text][/vc_column][/vc_row]
[vc_row][vc_column][vc_column_text]
The 10YR is now correcting in wave ‘ii’ of (c) an early low today.
This rise should complete below 127.63 at wave (b).
And wave ‘iii’ down should carry the price down to the wave (a) low at 126.47 over the coming days.
Wave (c) should break that low to complete the expanded flat correction wave [iv].
Tomorrow;
Wave (c) should remain in force for the next week.
Watch for wave ‘iii’ to turn lower again tomorrow.
[/vc_column_text][/vc_column][/vc_row]
[vc_row][vc_column][vc_separator border_width=”5″][/vc_column][/vc_row][vc_row][vc_column][vc_column_text]
SILVER
[/vc_column_text][/vc_column][/vc_row][vc_row][vc_column][vc_separator border_width=”5″][/vc_column][/vc_row][vc_row][vc_column width=”2/3″][vc_custom_heading text=”1 hr” use_theme_fonts=”yes”][vc_column_text]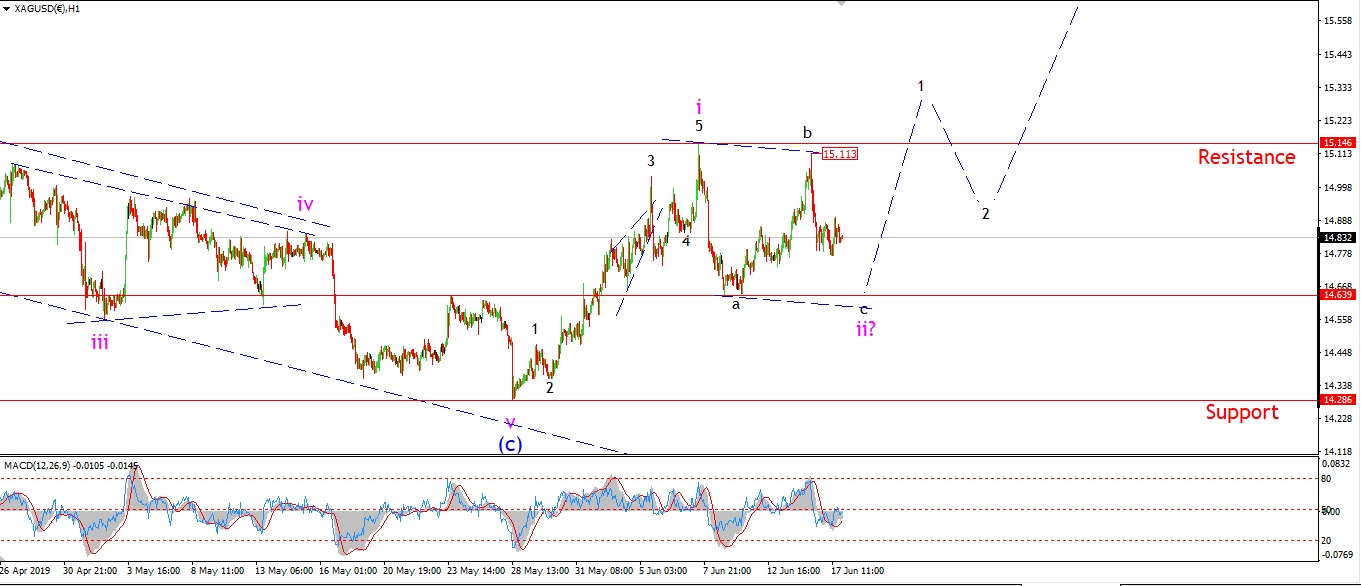 [/vc_column_text][/vc_column][vc_column width=”1/3″][vc_custom_heading text=”4 Hours” use_theme_fonts=”yes”][vc_column_text]
 [/vc_column_text][vc_custom_heading text=”Daily” use_theme_fonts=”yes”][vc_column_text]
 [/vc_column_text][/vc_column][/vc_row]
[vc_row][vc_column][vc_column_text]
Silver has traded flat today in what might be a small ‘b’ wave correction within wave ‘c’.
I still expect one more drop to 14.63 to complete a three wave pattern in wave ‘ii’.
But this correction should be complete by tomorrow evening.
Tomorrow;
Watch for wave ‘c’ drop into, and break 14.63 to complete wave ‘ii’.
Wave ‘iii’ will be confirmed with a reversal higher and a break of 15.14 again.
We should see wave ‘iii’ underway by the end of this week.
[/vc_column_text][/vc_column][/vc_row]
[vc_row][vc_column][vc_separator border_width=”5″][/vc_column][/vc_row][vc_row][vc_column][vc_column_text]
S&P 500.
[/vc_column_text][/vc_column][/vc_row][vc_row][vc_column][vc_separator border_width=”5″][/vc_column][/vc_row][vc_row][vc_column width=”2/3″][vc_custom_heading text=”1 hr” use_theme_fonts=”yes”][vc_column_text] [/vc_column_text][/vc_column][vc_column width=”1/3″][vc_custom_heading text=”4 Hours” use_theme_fonts=”yes”][vc_column_text]
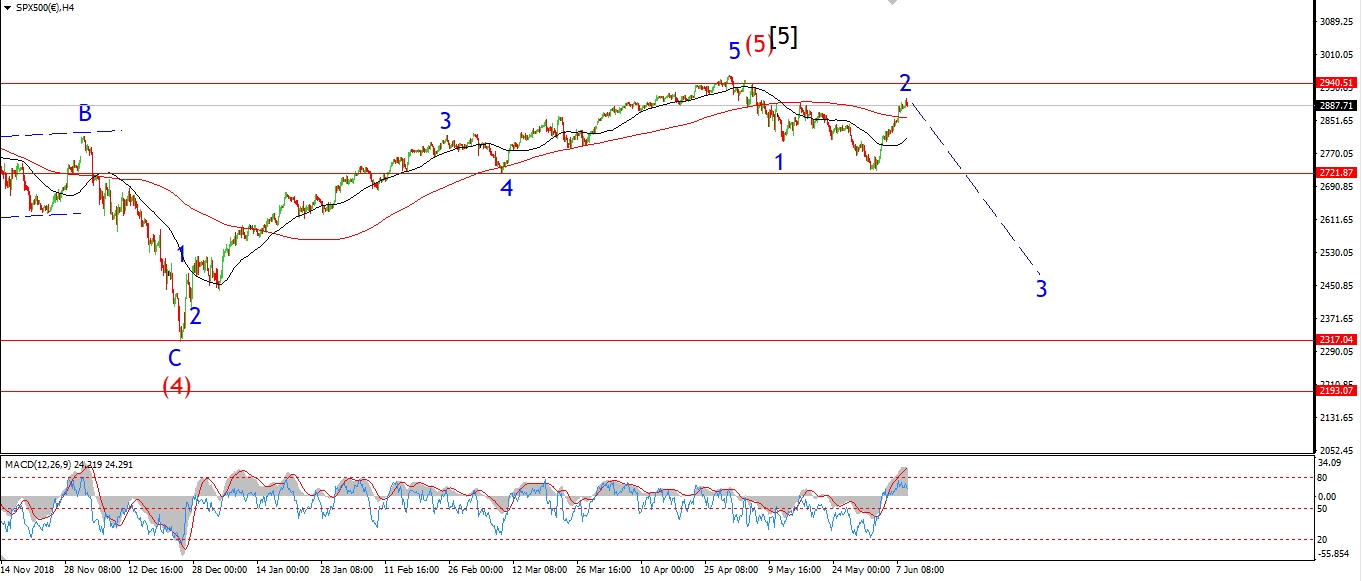 [/vc_column_text][vc_custom_heading text=”Daily” use_theme_fonts=”yes”][vc_column_text]
 [/vc_column_text][/vc_column][/vc_row]
[vc_row][vc_column][vc_column_text]
The S&P has not made any progress off Fridays close.
I am expecting wave [i] of ‘3’ to begin soon,
this should happen with a sharp selloff in wave (i) of [i] by the end of this week.
The market has so far failed at resistance of 2910,
this top was registered a week ago now.
The market then fell into the wave ‘i’ low which lies a 2865.
If we see a break of 2865 with a sharp spike lower,
this will signal that wave (i) has begun.
Tomorrow;
Watch for wave ‘iii’ of (i) to break below 2865.
Wave (i) should push below 2797 as an initial target.
[/vc_column_text][/vc_column][/vc_row]
[vc_row][vc_column][vc_separator border_width=”5″][/vc_column][/vc_row]