
[vc_row][vc_column][vc_separator border_width=”5″][/vc_column][/vc_row]
[vc_row][vc_column][vc_column_text]
Hello everyone.
I have linked to Jesse felders work a few times over the last year.
Today he published a few charts which focus on the larger valuation situation right now.
And boy is it a dire one, as we are aware here!
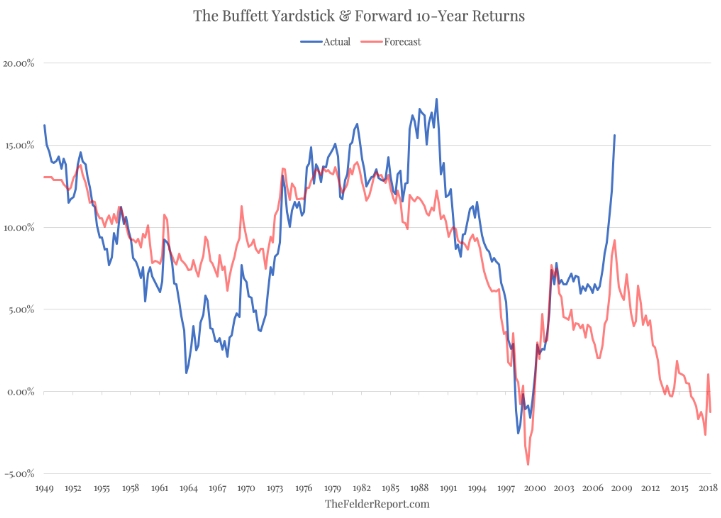
The current highs in the market dwarf the valuation extreme of the 2008 high, and match the euphoric extremes of the dotcom mania.
Given the current background,
I will happily hold my position that the market has topped and we are beginning a roll over into a massive bear-market as we speak.
[/vc_column_text][/vc_column][/vc_row]
[vc_row][vc_column][vc_separator border_width=”5″][/vc_column][/vc_row]
[vc_row][vc_column][vc_column_text]
EURUSD
[/vc_column_text][/vc_column][/vc_row]
[vc_row][vc_column][vc_separator border_width=”5″][/vc_column][/vc_row][vc_row][vc_column width=”2/3″][vc_custom_heading text=”1 hr” use_theme_fonts=”yes”][vc_column_text]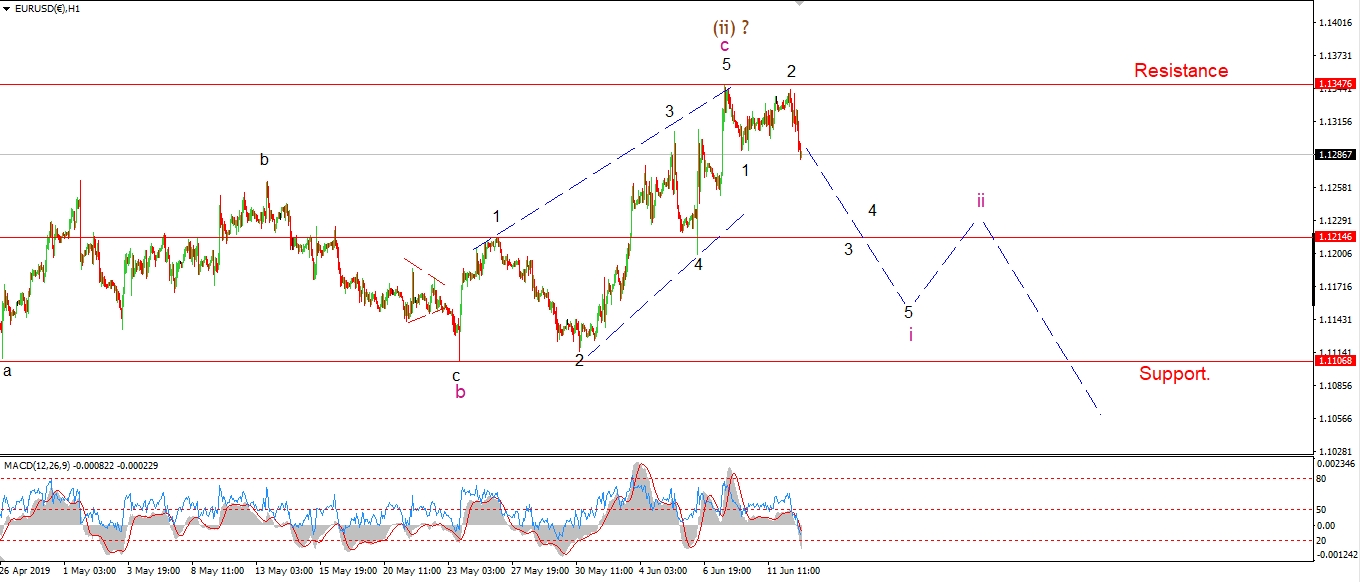 [/vc_column_text][/vc_column][vc_column width=”1/3″][vc_custom_heading text=”4 Hours” use_theme_fonts=”yes”][vc_column_text]
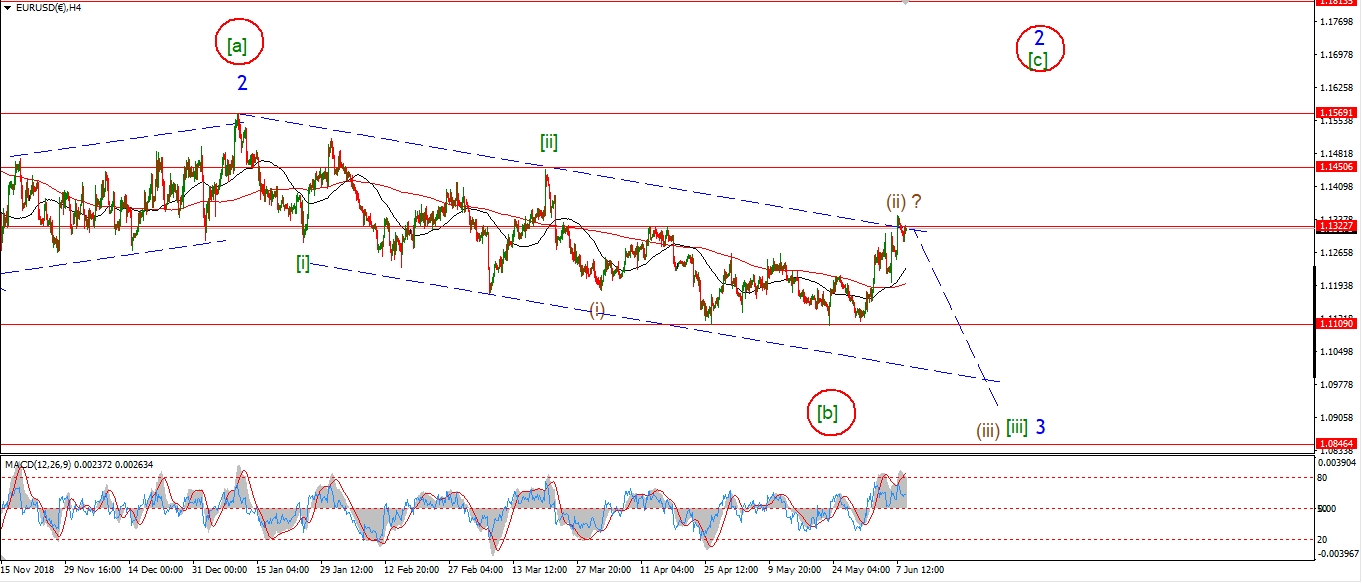 [/vc_column_text][vc_custom_heading text=”Daily” use_theme_fonts=”yes”][vc_column_text]
 [/vc_column_text][/vc_column][/vc_row]
[vc_row][vc_column][vc_column_text]
EURUSD has held below the wave (ii) high of 1.1347 after correcting higher yesterday.
This is labelled as wave ‘2’ of ‘i’ to the downside.
With wave ‘i’ now only just beginning,
we should see further declines into wave ‘3’ back below 1.1200 again of ‘i’ over the coming days.
The price has dropped off the highs quite sharply this evening again,
so wave ‘3’ may now be underway.
From this point I am looking for a smaller degree impulse wave to complete at wave ‘ii’.
This will create another bearish opportunity to trade wave ‘iii’ of (iii) to the downside.
Tomorrow;
Watch for wave ‘i’ to continue lower for the rest of the week.
Wave ‘ii’ should start early next week.
[/vc_column_text][/vc_column][/vc_row]
[vc_row][vc_column][vc_separator border_width=”5″][/vc_column][/vc_row][vc_row][vc_column][vc_column_text]
GBPUSD
[/vc_column_text][/vc_column][/vc_row][vc_row][vc_column][vc_separator border_width=”5″][/vc_column][/vc_row][vc_row][vc_column width=”2/3″][vc_custom_heading text=”1 hr” use_theme_fonts=”yes”][vc_column_text]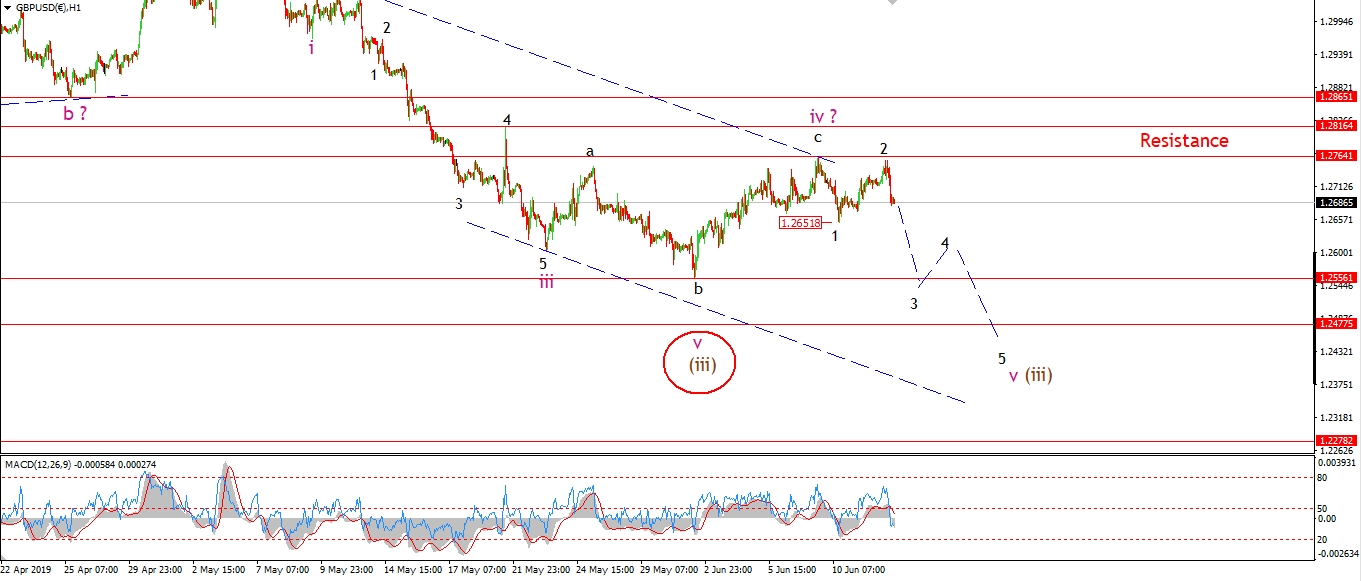 [/vc_column_text][/vc_column][vc_column width=”1/3″][vc_custom_heading text=”4 Hours” use_theme_fonts=”yes”][vc_column_text]
 [/vc_column_text][vc_custom_heading text=”Daily” use_theme_fonts=”yes”][vc_column_text]
 [/vc_column_text][/vc_column][/vc_row]
[vc_row][vc_column][vc_column_text]
Cable is a little further along in the wave structure than EURUSD
as wave (iii) down is now nearing completion.
Wave ‘iv’ of (iii) seems to have topped out at 1.2764,
and now we have another move lower off that high,
which is labelled as the first leg down in wave ‘v’.
Wave ‘v’ of (iii) should hit the Fib target at 1.2477 over the coming days.
Tomorrow;
watch for wave ‘v’ to continue lower and break 1.2556 at a minimum.
[/vc_column_text][/vc_column][/vc_row]
[vc_row][vc_column][vc_separator border_width=”5″][/vc_column][/vc_row][vc_row][vc_column][vc_column_text]
USDJPY
[/vc_column_text][/vc_column][/vc_row][vc_row][vc_column][vc_separator border_width=”5″][/vc_column][/vc_row][vc_row][vc_column width=”2/3″][vc_custom_heading text=”1 hr” use_theme_fonts=”yes”][vc_column_text]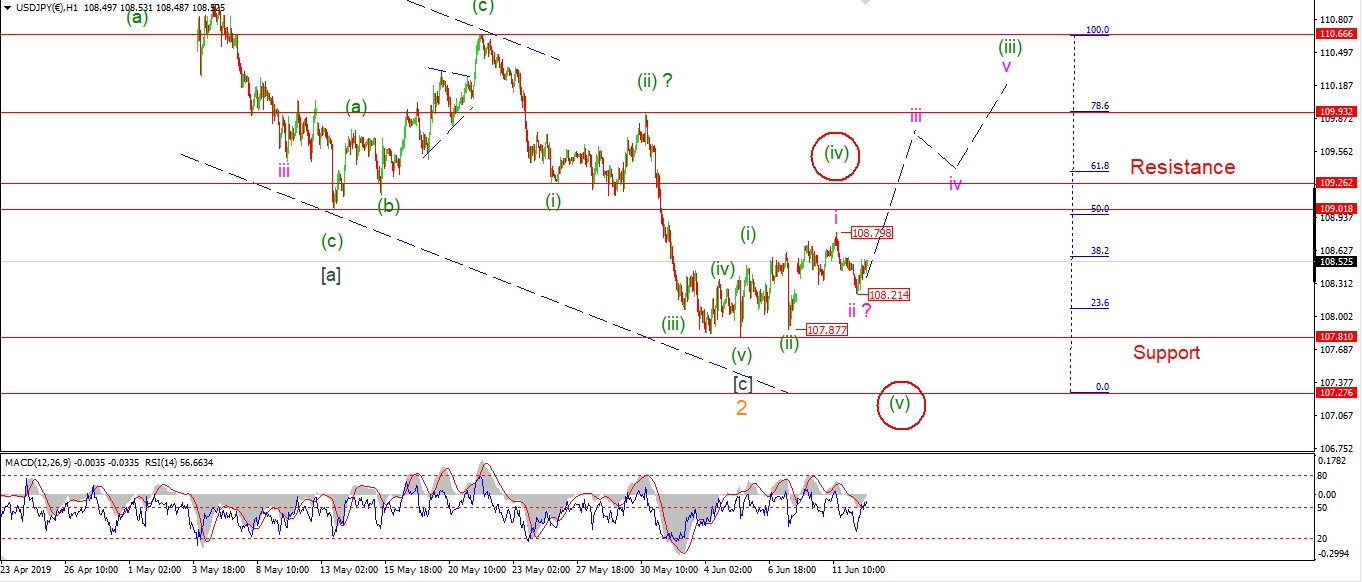 [/vc_column_text][/vc_column][vc_column width=”1/3″][vc_custom_heading text=”4 Hours” use_theme_fonts=”yes”][vc_column_text]
 [/vc_column_text][vc_custom_heading text=”Daily” use_theme_fonts=”yes”][vc_column_text]
 [/vc_column_text][/vc_column][/vc_row]
[vc_row][vc_column][vc_column_text]
USDJPY has dropped in three waves off Tuesdays high at 108.79.
A three wave form suggests a completed correction.
So this high is now labelled wave ‘i’.
Wave ‘ii’ should now be complete at the low of the session.
The price is rising off that low again this evening.
If we see a further rally tomorrow to break above 108.79,
That will signal wave ‘iii’ has begun.
Tomorrow;
Watch for wave ‘ii’ to hold at 108.21.
Wave ‘iii’ should now begin to push higher towards 110.00 again.
[/vc_column_text][/vc_column][/vc_row]
[vc_row][vc_column][vc_separator border_width=”5″][/vc_column][/vc_row][vc_row][vc_column][vc_column_text]
DOW JONES INDUSTRIALS
[/vc_column_text][/vc_column][/vc_row][vc_row][vc_column][vc_separator border_width=”5″][/vc_column][/vc_row][vc_row][vc_column width=”2/3″][vc_custom_heading text=”1 hr” use_theme_fonts=”yes”][vc_column_text]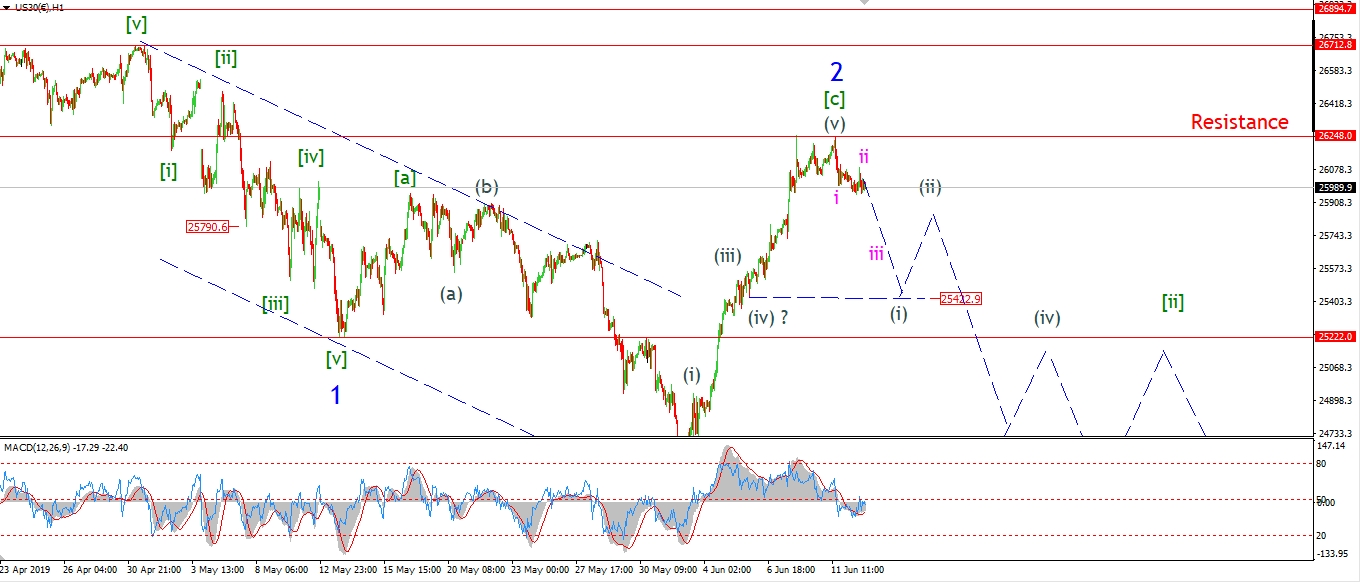 [/vc_column_text][/vc_column][vc_column width=”1/3″][vc_custom_heading text=”4 Hours” use_theme_fonts=”yes”][vc_column_text]
 [/vc_column_text][vc_custom_heading text=”Daily” use_theme_fonts=”yes”][vc_column_text]
 [/vc_column_text][/vc_column][/vc_row]
[vc_row][vc_column][vc_column_text]
The DOW is also holding below the recent high at 26248.
The action over the last few sessions looks corrective below resistance.
And this suggests that the tide is turning again in stocks.
I have labelled the short term action as waves ‘i’ and ‘ii’ to the downside,
Wave ‘iii’ down should start tomorrow and carry the price back towards 25400 again at the previous fourth wave.
The expectation is, that a larger five wave pattern will now build off the wave ‘2’ high in wave (i) grey.
And a lower high in wave (ii) grey next week,
will provide a bearish signal that wave ‘3’ down is beginning.
Wave ‘3’ down is going to be a significant and rapid decline.
Tomorrow;
Watch for wave ‘iii’ of (i) to continue lower towards the initial target area.
[/vc_column_text][/vc_column][/vc_row]
[vc_row][vc_column][vc_separator border_width=”5″][/vc_column][/vc_row][vc_row][vc_column][vc_column_text]
GOLD
[/vc_column_text][/vc_column][/vc_row][vc_row][vc_column][vc_separator border_width=”5″][/vc_column][/vc_row][vc_row][vc_column width=”2/3″][vc_custom_heading text=”1 hr” use_theme_fonts=”yes”][vc_column_text]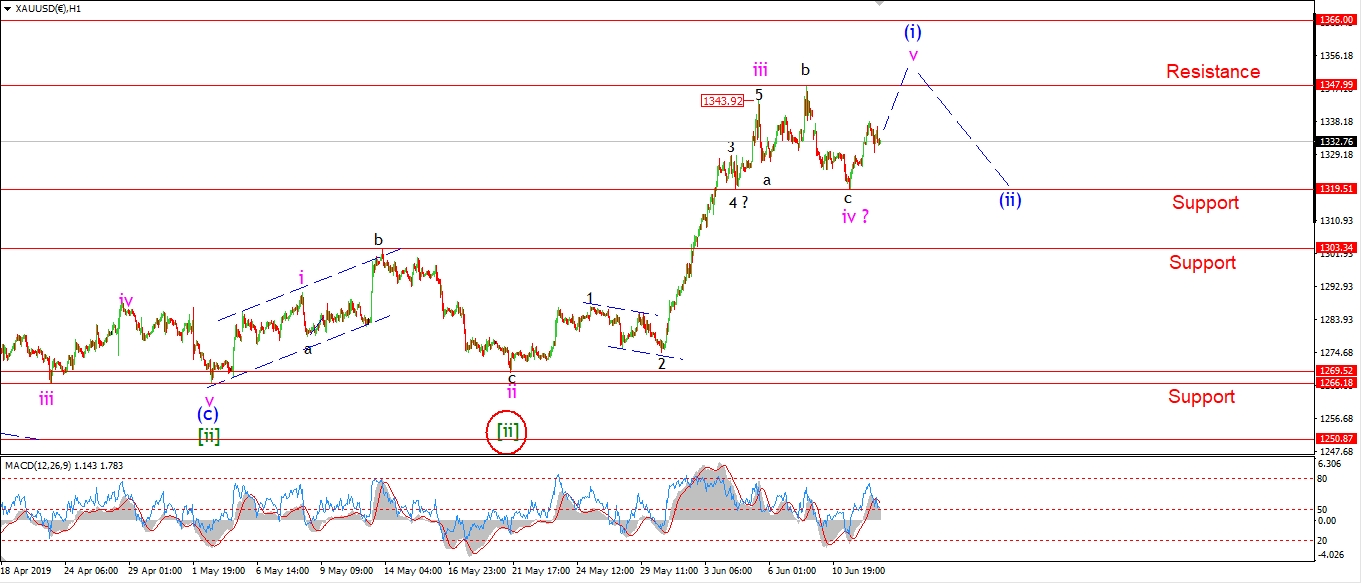 [/vc_column_text][/vc_column][vc_column width=”1/3″][vc_custom_heading text=”4 Hours” use_theme_fonts=”yes”][vc_column_text]
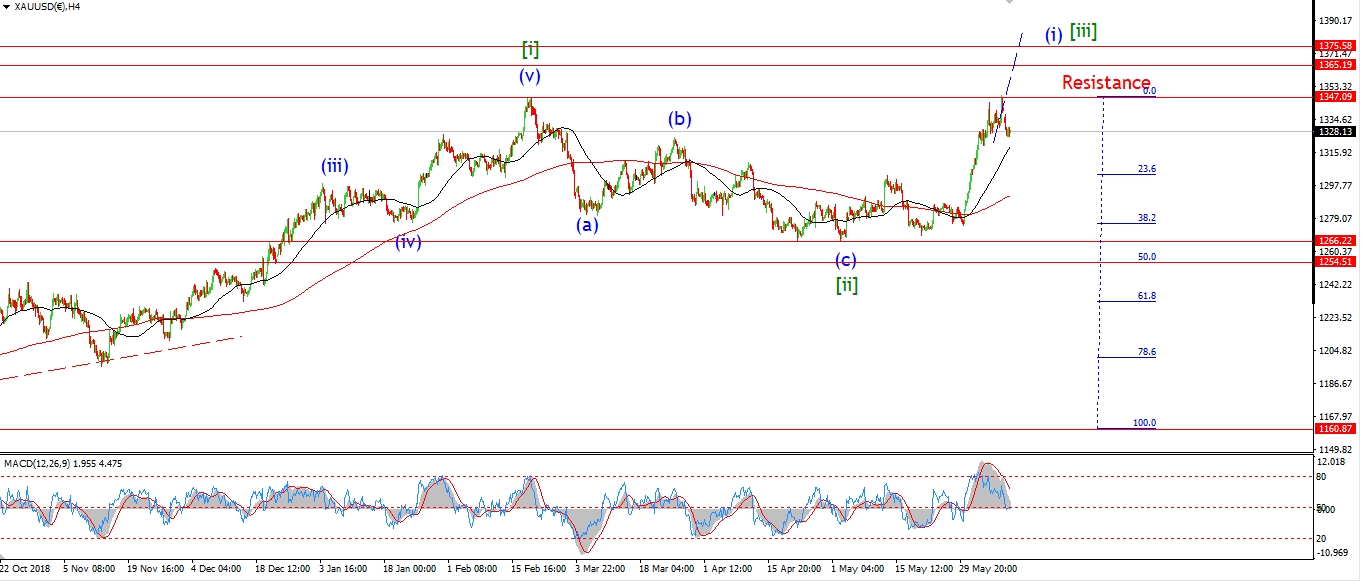 [/vc_column_text][vc_custom_heading text=”Daily” use_theme_fonts=”yes”][vc_column_text]
 [/vc_column_text][/vc_column][/vc_row]
[vc_row][vc_column][vc_column_text]
Gold has rallied off Tuesdays low at wave ‘iv’ pink today.
The rise so far is in a three wave form off 1319.
So this rally must develop further into a five wave pattern,
in order to be valid as wave ‘v’ of (i) as shown on the short term chart.
Tomorrow;
Short term support for wave ‘v’ stands at 1319.
This level must hold now as wave ‘v’ continues.
Watch for wave ‘v’ to reach above 1347 at a minimum
to complete a clear five wave pattern in the large wave (i) blue.
[/vc_column_text][/vc_column][/vc_row]
[vc_row][vc_column][vc_separator border_width=”5″][/vc_column][/vc_row][vc_row][vc_column][vc_column_text]
U.S CRUDE OIL
[/vc_column_text][/vc_column][/vc_row][vc_row][vc_column][vc_separator border_width=”5″][/vc_column][/vc_row][vc_row][vc_column width=”2/3″][vc_custom_heading text=”1 hr” use_theme_fonts=”yes”][vc_column_text]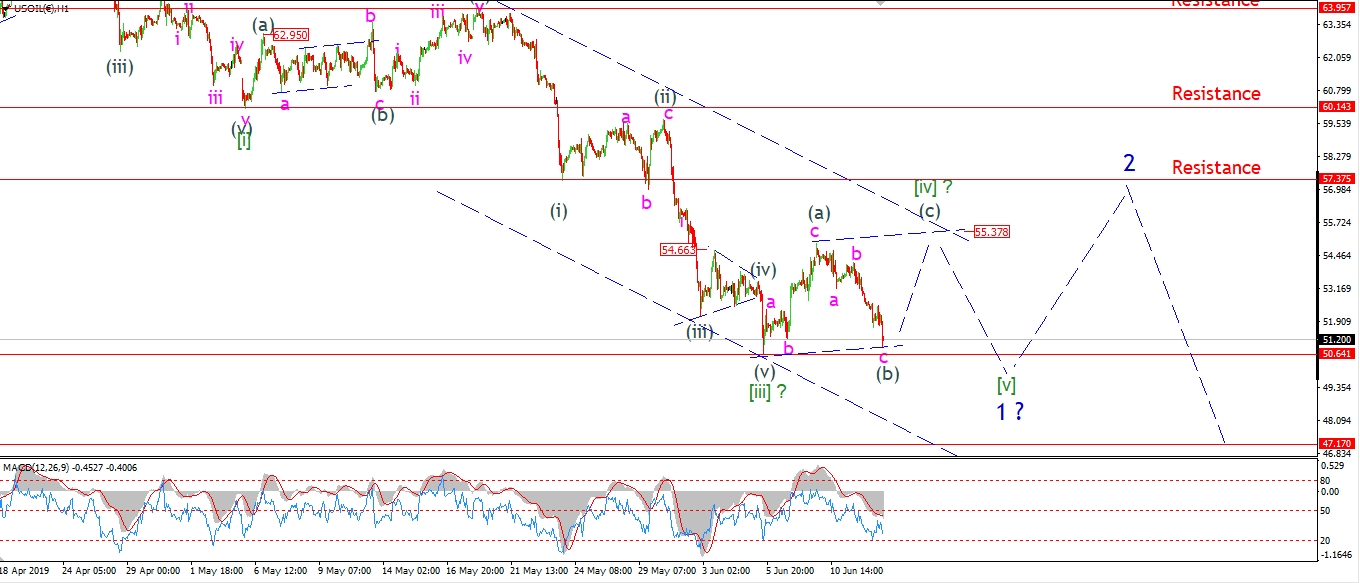 [/vc_column_text][/vc_column][vc_column width=”1/3″][vc_custom_heading text=”4 Hours” use_theme_fonts=”yes”][vc_column_text]
 [/vc_column_text][vc_custom_heading text=”Daily” use_theme_fonts=”yes”][vc_column_text]
 [/vc_column_text][/vc_column][/vc_row]
[vc_row][vc_column][vc_column_text]
Oil has continued lower today in wave (b) of [iv].
Wave ‘c’ of (b) is dropping back into the recent lows at 50.64 again.
This extended decline raises the chance that wave [iv] is tracing out a flat correction now,
rather than a zigzag correction as shown over the last few days.
The flat correction should trace out a 3,3,5 internal structure,
and complete at about 55.30 by Friday evening.
Ideally wave (b) will hold above 50.64 now.
And wave (c) will rally in five waves to the upper trendline again.
A break of 50.64 will classify wave [iv] as an expanded flat.
Tomorrow;
Watch for wave (c) to begin and push back towards 55.00 again in five waves.
[/vc_column_text][/vc_column][/vc_row]
[vc_row][vc_column][vc_separator border_width=”5″][/vc_column][/vc_row][vc_row][vc_column][vc_column_text]
US 10 yr Treasuries.
[/vc_column_text][/vc_column][/vc_row][vc_row][vc_column][vc_separator border_width=”5″][/vc_column][/vc_row][vc_row][vc_column width=”2/3″][vc_custom_heading text=”1 hr” use_theme_fonts=”yes”][vc_column_text]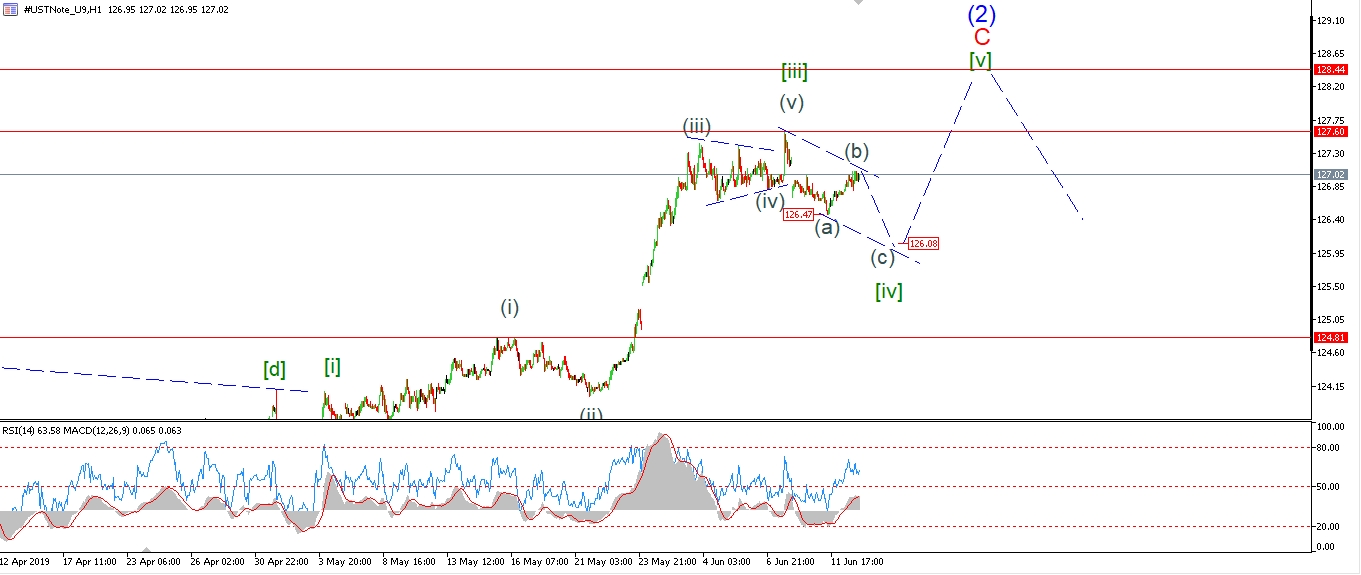 [/vc_column_text][/vc_column][vc_column width=”1/3″][vc_custom_heading text=”4 Hours” use_theme_fonts=”yes”][vc_column_text]
 [/vc_column_text][vc_custom_heading text=”Daily” use_theme_fonts=”yes”][vc_column_text]
 [/vc_column_text][/vc_column][/vc_row]
[vc_row][vc_column][vc_column_text]
The 10YR rallied today in wave (b) as suggested by the count.
Wave (b) has reached back into the gap created within wave (a)
as the price fell off the wave [iii] high last week.
So the market has fulfilled a common retracement pattern now for a (b) wave correction,
and we can expect to see wave (c) begin,
and carry the price lower into 126.00 again to complete wave [iv] green.
Tomorrow;
Wave [iv] is tracing out a 3,3,5 internal pattern.
So wave (c) of [iv] should now fall in five waves into the lower trend channel line.
When price hits the lower line at 126.00,
then we can look higher in wave [v] again.
[/vc_column_text][/vc_column][/vc_row]
[vc_row][vc_column][vc_separator border_width=”5″][/vc_column][/vc_row][vc_row][vc_column][vc_column_text]
SILVER
[/vc_column_text][/vc_column][/vc_row][vc_row][vc_column][vc_separator border_width=”5″][/vc_column][/vc_row][vc_row][vc_column width=”2/3″][vc_custom_heading text=”1 hr” use_theme_fonts=”yes”][vc_column_text]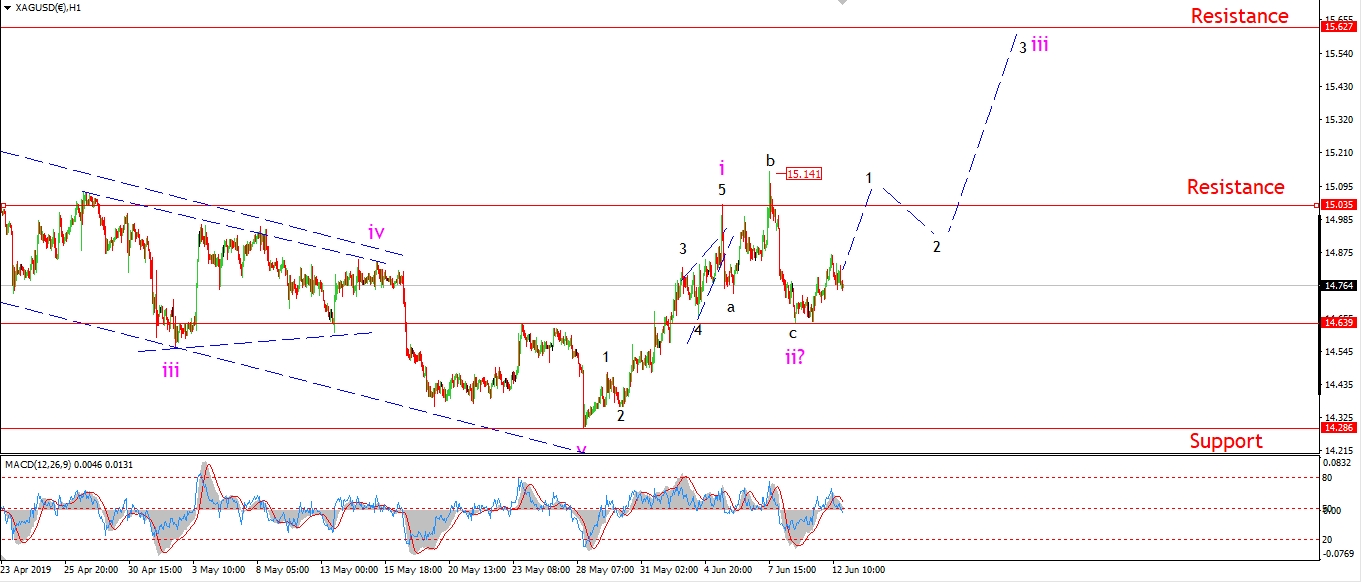 [/vc_column_text][/vc_column][vc_column width=”1/3″][vc_custom_heading text=”4 Hours” use_theme_fonts=”yes”][vc_column_text]
 [/vc_column_text][vc_custom_heading text=”Daily” use_theme_fonts=”yes”][vc_column_text]
 [/vc_column_text][/vc_column][/vc_row]
[vc_row][vc_column][vc_column_text]
Silver has risen off the low at wave ‘ii’ pink in a three wave form so far.
The price should continue higher over the coming days as wave ‘iii’ pink takes over.
But we must see a five wave rise off 14.63 at wave ‘ii’,
in order to confirm that wave ‘iii’ has begun.
Once the price creates a further higher low above wave ‘ii’ as shown,
that will signal that Silver is set to rally again into wave ‘iii’.
Tomorrow;
Watch for 14.63 to hold and price to continue higher again into wave ‘iii’.
[/vc_column_text][/vc_column][/vc_row]
[vc_row][vc_column][vc_separator border_width=”5″][/vc_column][/vc_row][vc_row][vc_column][vc_column_text]
S&P 500.
[/vc_column_text][/vc_column][/vc_row][vc_row][vc_column][vc_separator border_width=”5″][/vc_column][/vc_row][vc_row][vc_column width=”2/3″][vc_custom_heading text=”1 hr” use_theme_fonts=”yes”][vc_column_text]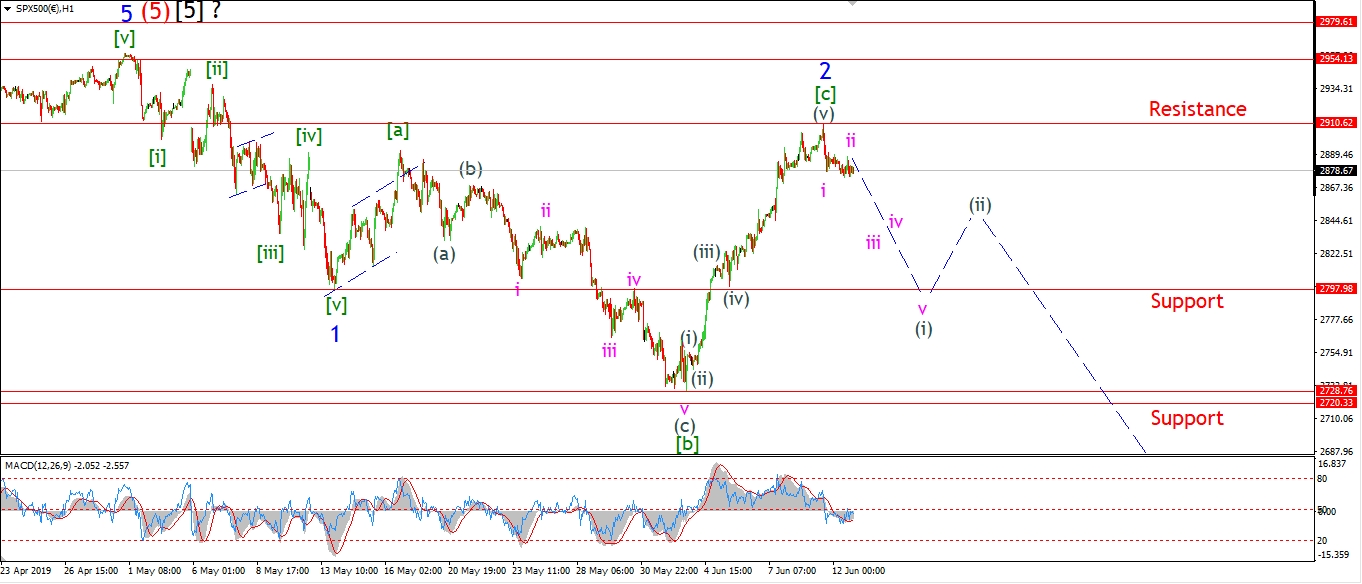 [/vc_column_text][/vc_column][vc_column width=”1/3″][vc_custom_heading text=”4 Hours” use_theme_fonts=”yes”][vc_column_text]
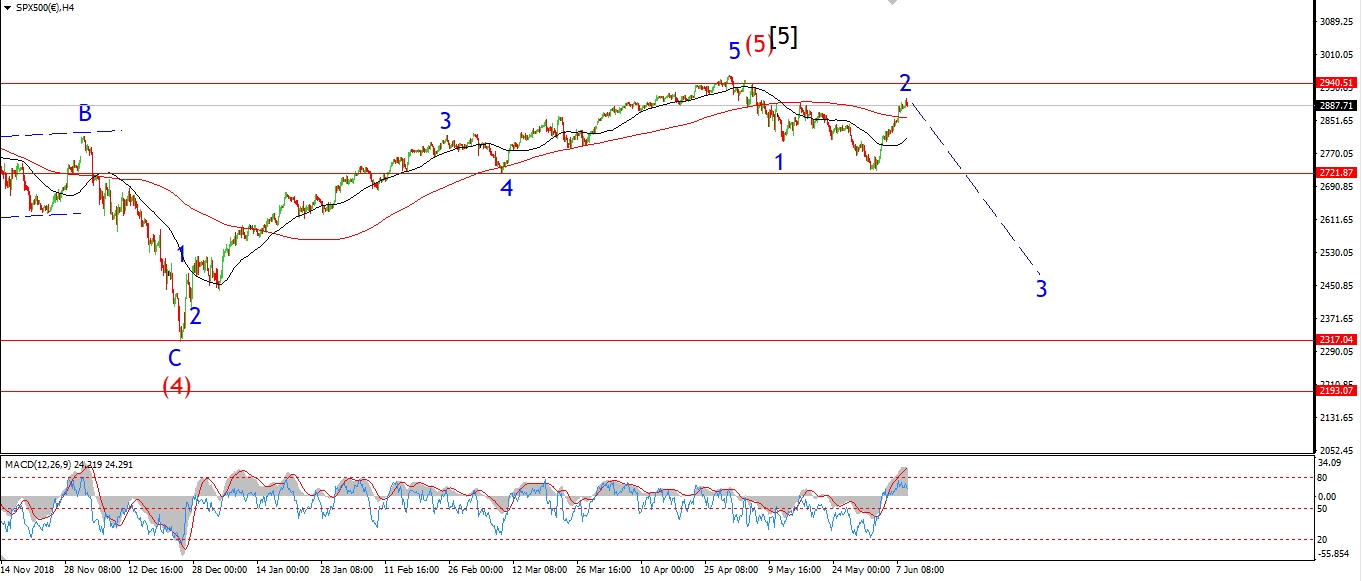 [/vc_column_text][vc_custom_heading text=”Daily” use_theme_fonts=”yes”][vc_column_text]
 [/vc_column_text][/vc_column][/vc_row]
[vc_row][vc_column][vc_column_text]
Same situation for the S&P this evening.
A flat days trade is labelled wave ‘ii’ off the recent wave ‘2’ high at 2910.
The market must now selloff again into wave ‘iii’ pink as shown,
with the aim to build a five wave pattern lower over the coming week in wave (i) grey.
The 4hr chart is showing a serious momentum divergence lower at the moment.
MACD has turned lower off a 6mth extreme overbought high.
And RSI is on the verge of a center line break.
Add this to the possibility of a high in wave ‘2’,
and we have a very precarious picture building.
Tomorrow;
Watch for wave ‘2’ to hold at 2910.
This level must not be broken from here.
Wave ‘iii’ of (i) should now head lower for the rest of the week.
[/vc_column_text][/vc_column][/vc_row]
[vc_row][vc_column][vc_separator border_width=”5″][/vc_column][/vc_row]