
[vc_row][vc_column][vc_separator border_width=”5″][/vc_column][/vc_row]
[vc_row][vc_column][vc_column_text]
Hello everyone.
[/vc_column_text][/vc_column][/vc_row]
[vc_row][vc_column][vc_separator border_width=”5″][/vc_column][/vc_row]
[vc_row][vc_column][vc_column_text]
EURUSD
[/vc_column_text][/vc_column][/vc_row]
[vc_row][vc_column][vc_separator border_width=”5″][/vc_column][/vc_row][vc_row][vc_column width=”2/3″][vc_custom_heading text=”1 hr” use_theme_fonts=”yes”][vc_column_text]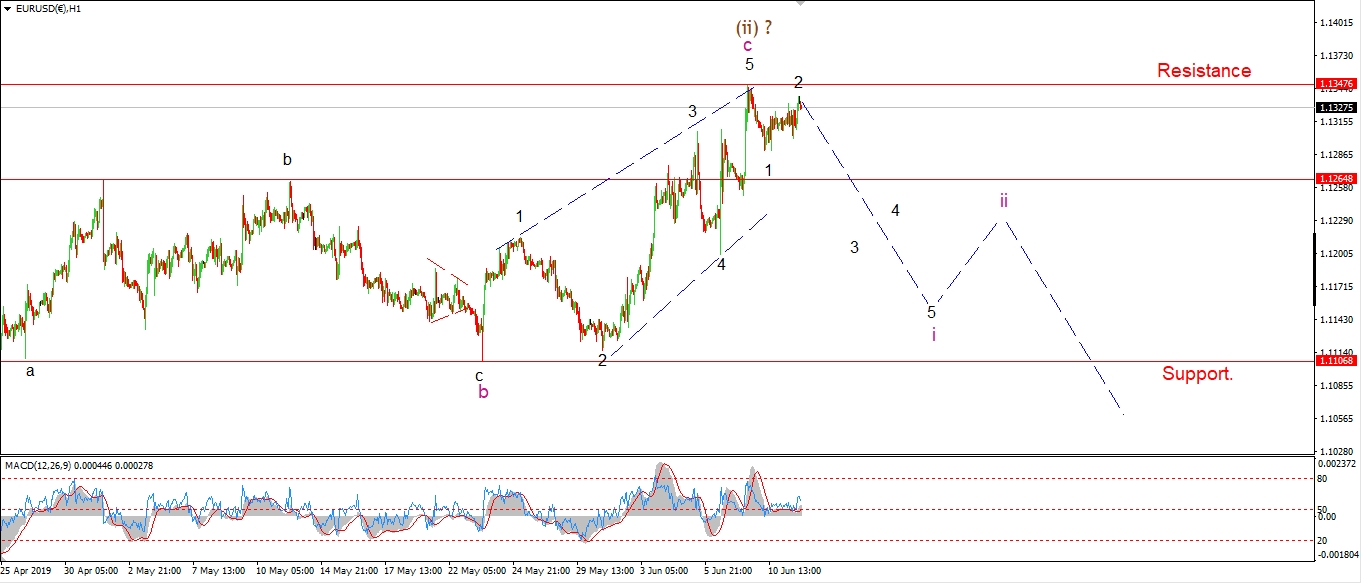 [/vc_column_text][/vc_column][vc_column width=”1/3″][vc_custom_heading text=”4 Hours” use_theme_fonts=”yes”][vc_column_text]
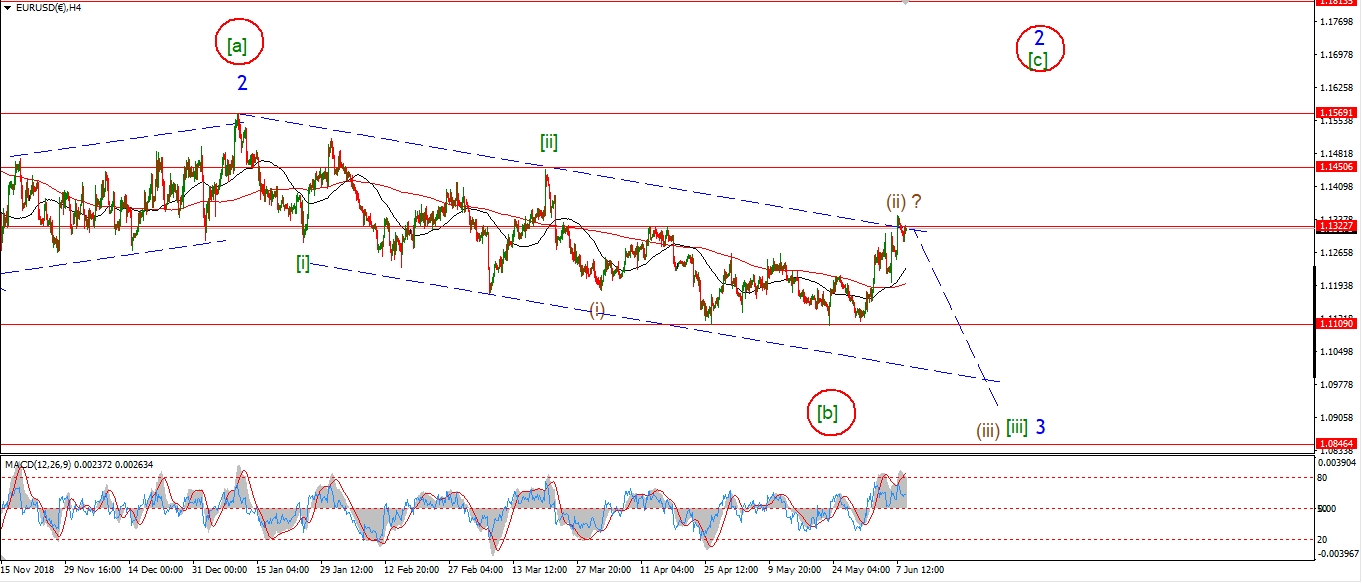 [/vc_column_text][vc_custom_heading text=”Daily” use_theme_fonts=”yes”][vc_column_text]
 [/vc_column_text][/vc_column][/vc_row]
[vc_row][vc_column][vc_column_text]
At the moment EURUSD us building a small head and shoulders pattern on the hourly chart.
The left shoulder is formed by wave ‘b’ pink.
The head has just recently completed at wave (ii),
and the right side shoulder will be formed by wave ‘ii’ pink.
Wave ‘i’ pink should push towards the neckline again at 1.1106.
A break of that level will confirm that the market is turning down into wave (iii).
Tomorrow;
Watch for wave ‘i’ to drop again in a five wave pattern.
Resistance at 1.1347 should hold.
[/vc_column_text][/vc_column][/vc_row]
[vc_row][vc_column][vc_separator border_width=”5″][/vc_column][/vc_row][vc_row][vc_column][vc_column_text]
GBPUSD
[/vc_column_text][/vc_column][/vc_row][vc_row][vc_column][vc_separator border_width=”5″][/vc_column][/vc_row][vc_row][vc_column width=”2/3″][vc_custom_heading text=”1 hr” use_theme_fonts=”yes”][vc_column_text]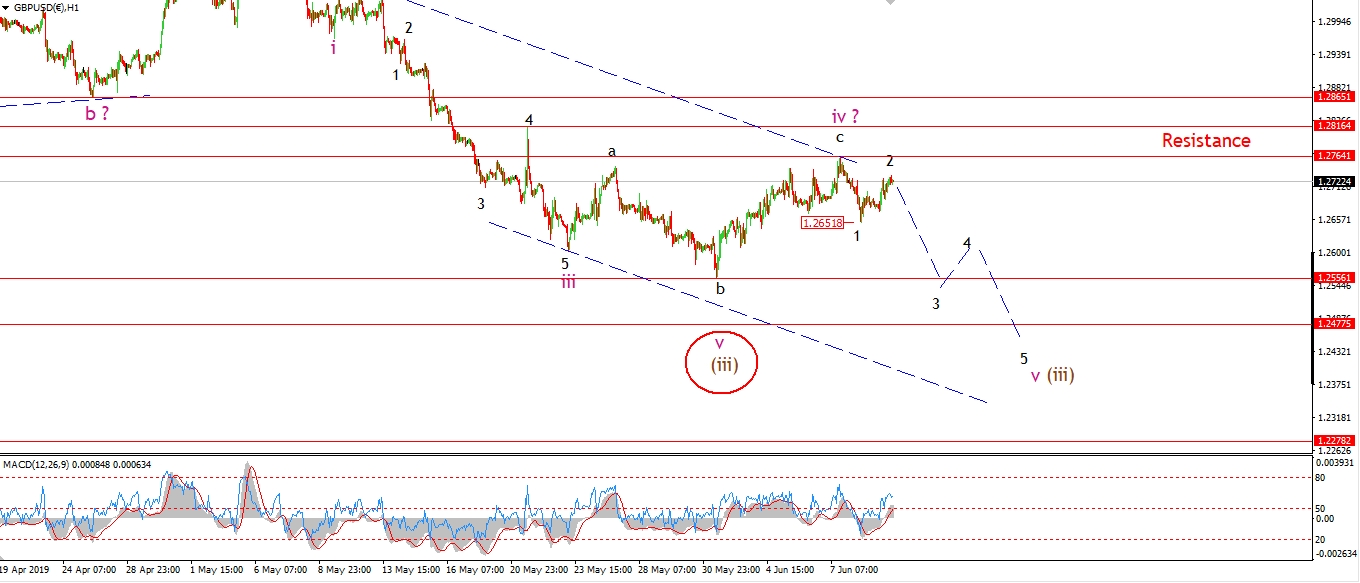 [/vc_column_text][/vc_column][vc_column width=”1/3″][vc_custom_heading text=”4 Hours” use_theme_fonts=”yes”][vc_column_text]
 [/vc_column_text][vc_custom_heading text=”Daily” use_theme_fonts=”yes”][vc_column_text]
 [/vc_column_text][/vc_column][/vc_row]
[vc_row][vc_column][vc_column_text]
Cable has risen in three waves off Mondays low labelled wave ‘1’.
The rise into todays highs is viewed as wave ‘2’,
This wave must hold below 1.2764 at the wave ‘iv’ high.
And the price should now turn lower into wave ‘3’ of ‘v’ to complete the larger wave (iii) over the coming days.
Tomorrow;
watch for wave ‘3’ of ‘v’ to begin with a break of 1.2650.
Wave ‘v’ target remains the same at 1.2477.
[/vc_column_text][/vc_column][/vc_row]
[vc_row][vc_column][vc_separator border_width=”5″][/vc_column][/vc_row][vc_row][vc_column][vc_column_text]
USDJPY
[/vc_column_text][/vc_column][/vc_row][vc_row][vc_column][vc_separator border_width=”5″][/vc_column][/vc_row][vc_row][vc_column width=”2/3″][vc_custom_heading text=”1 hr” use_theme_fonts=”yes”][vc_column_text]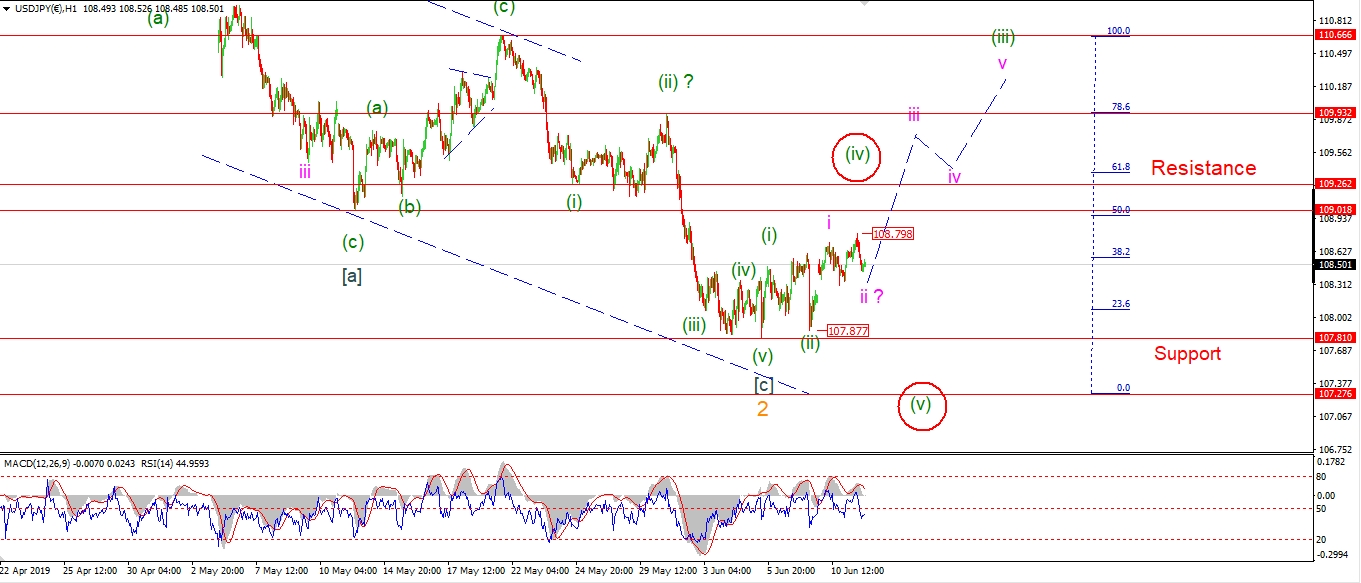 [/vc_column_text][/vc_column][vc_column width=”1/3″][vc_custom_heading text=”4 Hours” use_theme_fonts=”yes”][vc_column_text]
 [/vc_column_text][vc_custom_heading text=”Daily” use_theme_fonts=”yes”][vc_column_text]
 [/vc_column_text][/vc_column][/vc_row]
[vc_row][vc_column][vc_column_text]
I have updated the short term wave count this evening to reflect the stunted rally off the low,
The move off the recent low is now labelled as a developing extension in wave (iii) green.
Waves (i) and (ii) are followed by wave ‘i’ and ‘ii’ of (iii).
This count calls for a rally this week in wave ‘iii’,
which should rally towards 109.00 again.
The larger wave (iii) green should carry above resistance at 109.90 before completing.
If we get this action over the coming days,
that will be a major indication that USDJPY has finally bottomed in wave ‘2’,
and we are setting up for an extended rally in wave ‘3’.
Tomorrow;
Watch for wave ‘ii’ pink to complete above 107.87.
Wave ‘iii’ will be confirmed with a break of 108.79.
[/vc_column_text][/vc_column][/vc_row]
[vc_row][vc_column][vc_separator border_width=”5″][/vc_column][/vc_row][vc_row][vc_column][vc_column_text]
DOW JONES INDUSTRIALS
[/vc_column_text][/vc_column][/vc_row][vc_row][vc_column][vc_separator border_width=”5″][/vc_column][/vc_row][vc_row][vc_column width=”2/3″][vc_custom_heading text=”1 hr” use_theme_fonts=”yes”][vc_column_text]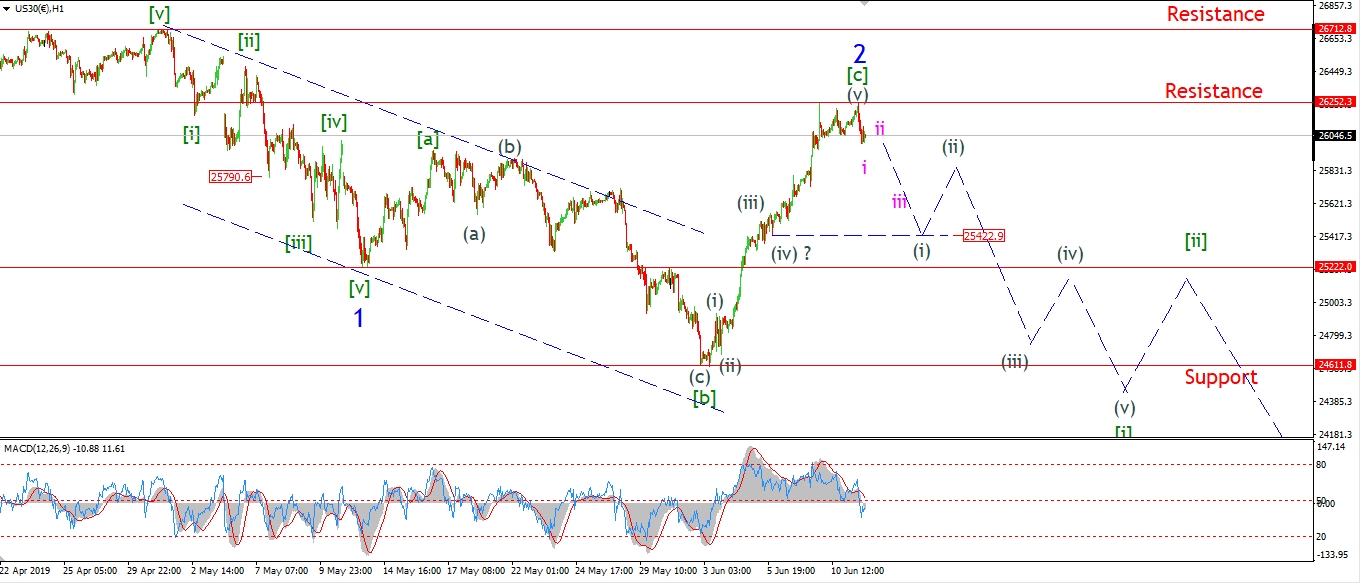 [/vc_column_text][/vc_column][vc_column width=”1/3″][vc_custom_heading text=”4 Hours” use_theme_fonts=”yes”][vc_column_text]
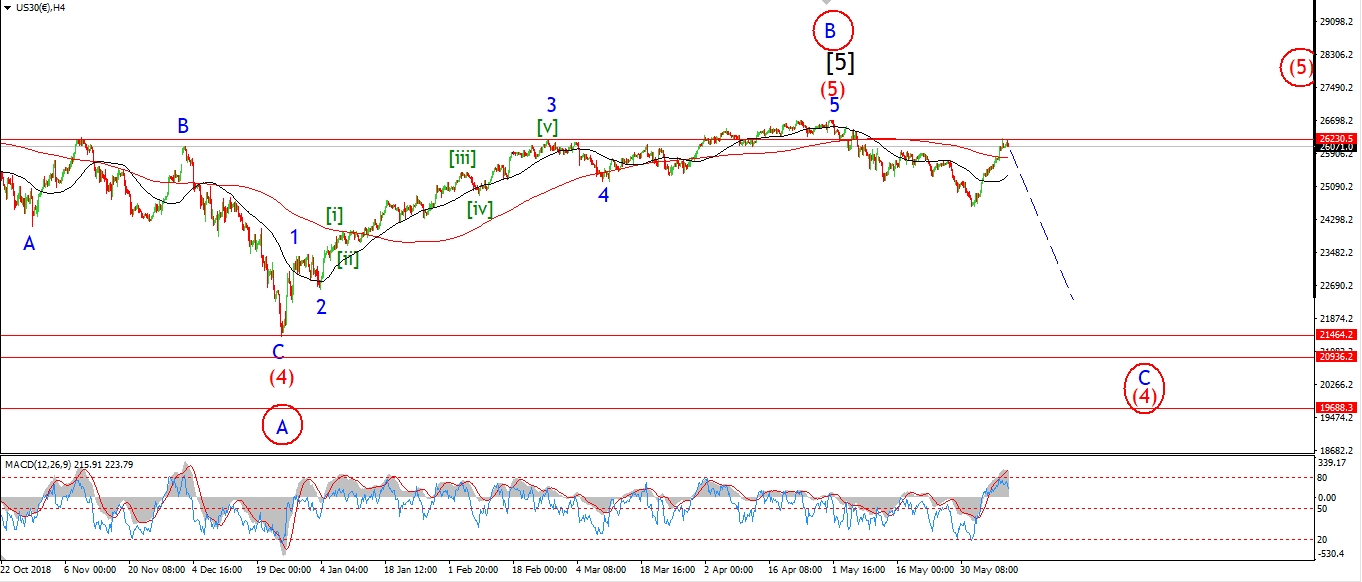 [/vc_column_text][vc_custom_heading text=”Daily” use_theme_fonts=”yes”][vc_column_text]
 [/vc_column_text][/vc_column][/vc_row]
[vc_row][vc_column][vc_column_text]
Todays decline is the first meaningful move lower for the last two weeks.
The top of wave ‘2’ should now be in place.
And todays small decline is labelled as the beginning of wave [i] of ‘3’.
Wave ‘3’ itself will be a much larger selloff,
and it should rattle the bullishness out of this market over the coming months.
Wave [i] green should now trace out a five wave decline towards support at 24600.
Wave (i) of [i] must begin off the recent highs and complete this week.
Tomorrow;
Watch for a decline in wave (i) to begin.
Wave (i) should retrace back to the recent wave (iv) low at about 25422.
[/vc_column_text][/vc_column][/vc_row]
[vc_row][vc_column][vc_separator border_width=”5″][/vc_column][/vc_row][vc_row][vc_column][vc_column_text]
GOLD
[/vc_column_text][/vc_column][/vc_row][vc_row][vc_column][vc_separator border_width=”5″][/vc_column][/vc_row][vc_row][vc_column width=”2/3″][vc_custom_heading text=”1 hr” use_theme_fonts=”yes”][vc_column_text]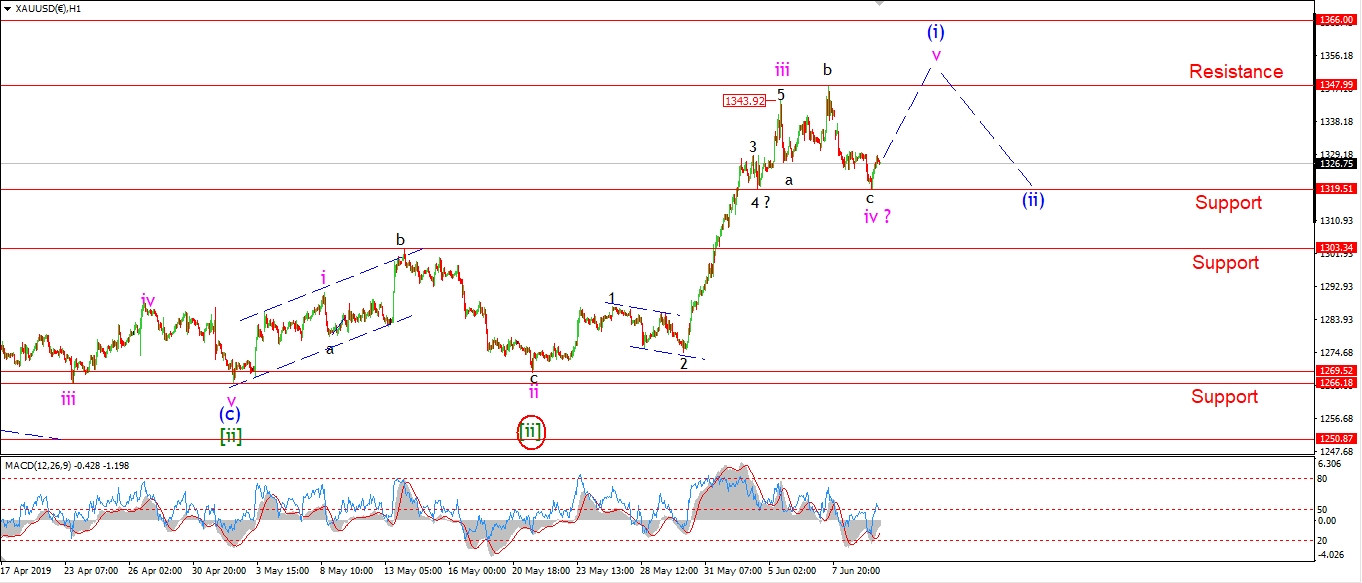 [/vc_column_text][/vc_column][vc_column width=”1/3″][vc_custom_heading text=”4 Hours” use_theme_fonts=”yes”][vc_column_text]
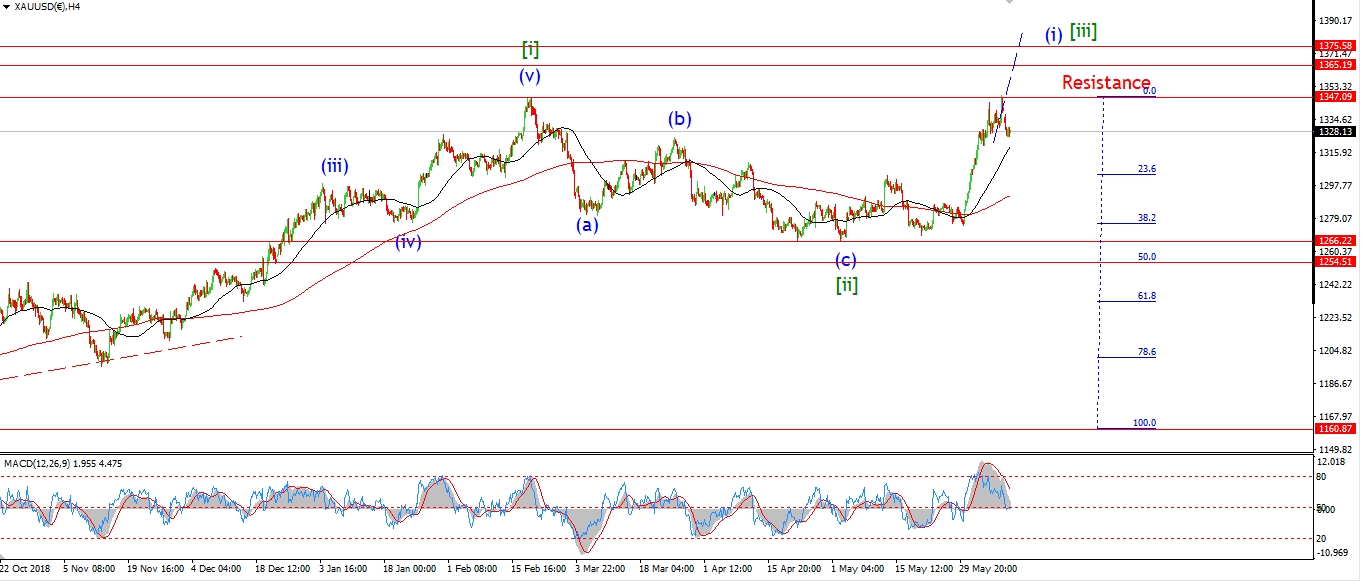 [/vc_column_text][vc_custom_heading text=”Daily” use_theme_fonts=”yes”][vc_column_text]
 [/vc_column_text][/vc_column][/vc_row]
[vc_row][vc_column][vc_column_text]
Gold fell again early today into the target at 1319.
This was the low formed by the previous wave ‘4’ of ‘iii’,
this is a typical support level for a fourth wave to complete at.
The price is rising off today’s lows now which should be the beginning of wave ‘v’ pink.
Wave ‘v’ is set to break out above the recent high again at 1347,
and this rally will complete a larger five wave move off the low at wave [ii].
tomorrow;
Watch for Wave ‘v’ to continue higher in five waves off the wave ‘iv’ low.
The minimum target for wave ‘v’ lies at 1347.
[/vc_column_text][/vc_column][/vc_row]
[vc_row][vc_column][vc_separator border_width=”5″][/vc_column][/vc_row][vc_row][vc_column][vc_column_text]
U.S CRUDE OIL
[/vc_column_text][/vc_column][/vc_row][vc_row][vc_column][vc_separator border_width=”5″][/vc_column][/vc_row][vc_row][vc_column width=”2/3″][vc_custom_heading text=”1 hr” use_theme_fonts=”yes”][vc_column_text]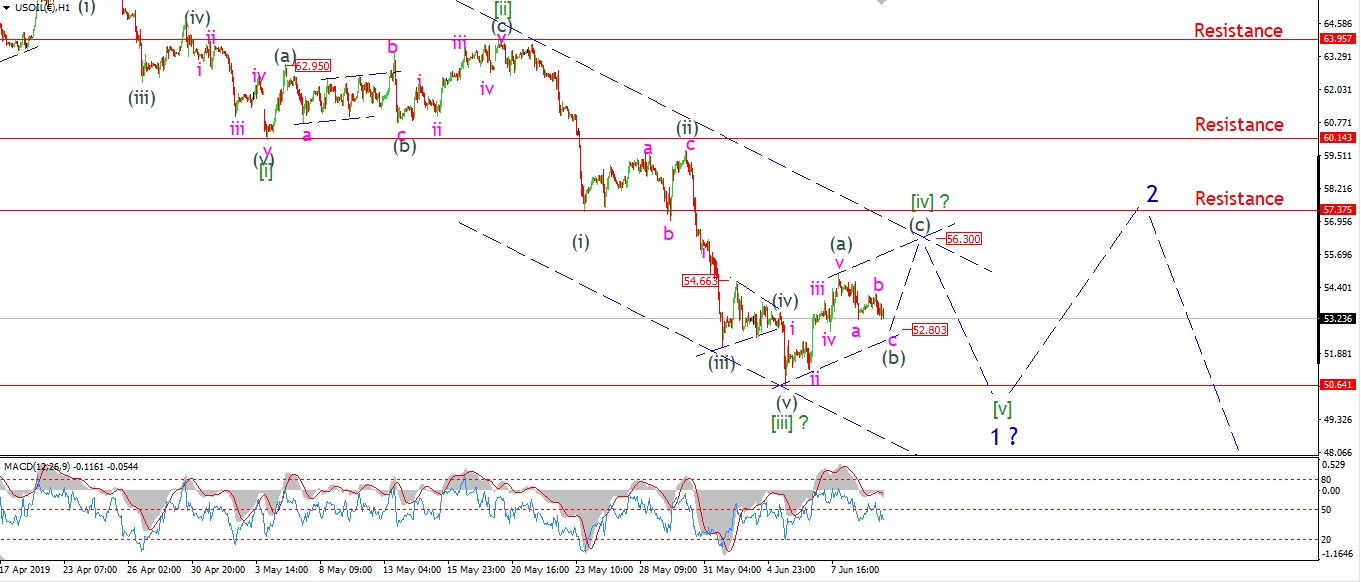 [/vc_column_text][/vc_column][vc_column width=”1/3″][vc_custom_heading text=”4 Hours” use_theme_fonts=”yes”][vc_column_text]
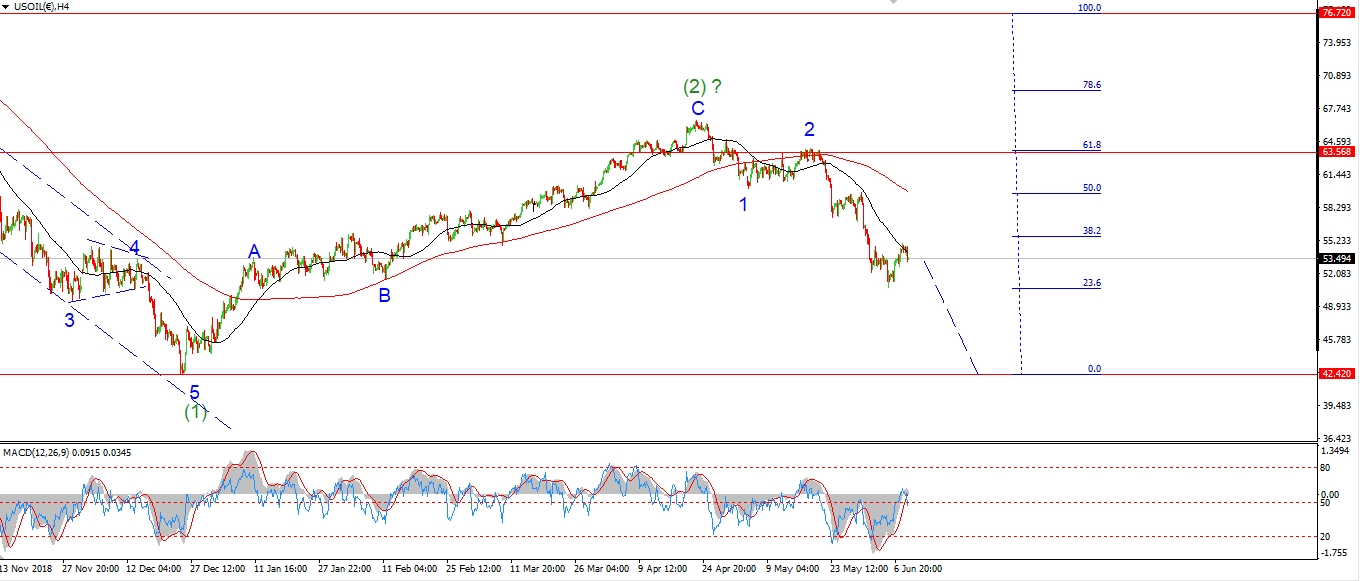 [/vc_column_text][vc_custom_heading text=”Daily” use_theme_fonts=”yes”][vc_column_text]
 [/vc_column_text][/vc_column][/vc_row]
[vc_row][vc_column][vc_column_text]
It looks like this wave [iv] correction will be in force in crude oil for the next week or so,
going on the pace of the price action in wave (a) and (b).
The price is continuing lower in wave (b) of [iv] this evening,
this should be a three wave move to create a higher low above wave [iii].
The price is now dropping in wave ‘c’ of (b) this evening.
And I have suggested a target for wave (b) at 52.80,
as this is the 50% retracement level of wave (a).
The overall target for wave [iv] green remains in the region of 56.00.
Tomorrow;
watch for wave ‘c’ to find a low at 52.80 to complete wave (b).
Then we should see the initial move higher to begin wave (c) of [iv].
[/vc_column_text][/vc_column][/vc_row]
[vc_row][vc_column][vc_separator border_width=”5″][/vc_column][/vc_row][vc_row][vc_column][vc_column_text]
US 10 yr Treasuries.
[/vc_column_text][/vc_column][/vc_row][vc_row][vc_column][vc_separator border_width=”5″][/vc_column][/vc_row][vc_row][vc_column width=”2/3″][vc_custom_heading text=”1 hr” use_theme_fonts=”yes”][vc_column_text]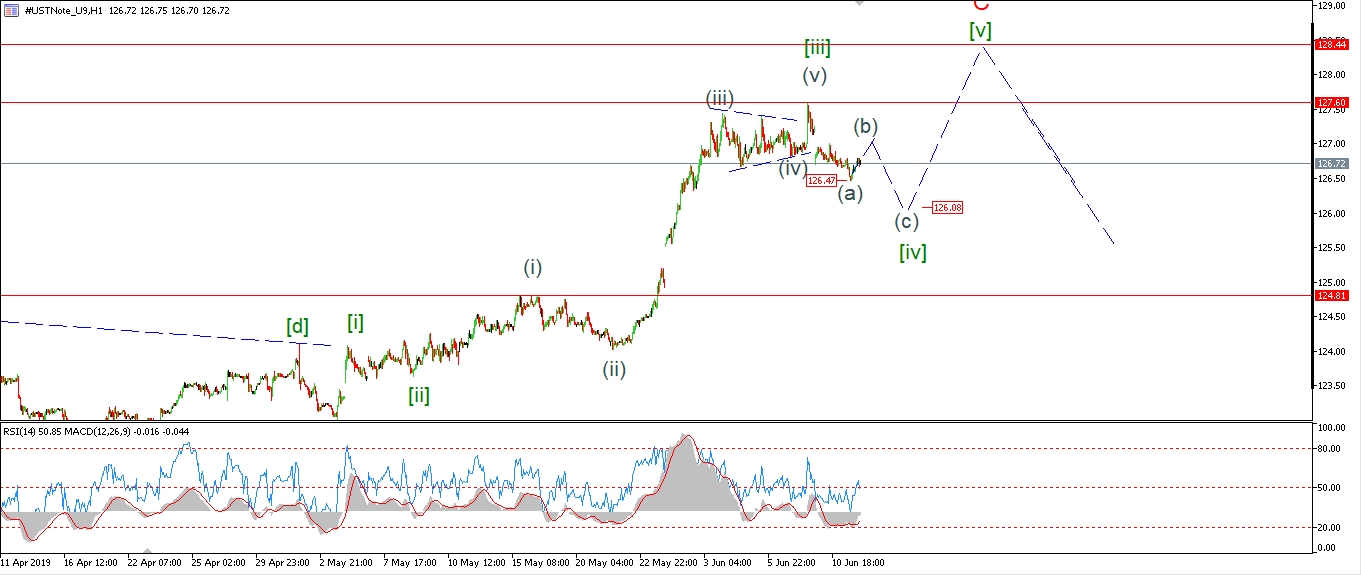 [/vc_column_text][/vc_column][vc_column width=”1/3″][vc_custom_heading text=”4 Hours” use_theme_fonts=”yes”][vc_column_text]
 [/vc_column_text][vc_custom_heading text=”Daily” use_theme_fonts=”yes”][vc_column_text]
 [/vc_column_text][/vc_column][/vc_row]
[vc_row][vc_column][vc_column_text]
Wave (a) of [iv] hit a low this morning at 126.47,
and the price is rising again now in wave (b) as shown.
Wave (b) should complete below 127.60 at the recent wave [iii] high,
and then price should head lower again in wave (c)
to complete a three wave pattern in wave [iv] green.
This corrective phase should draw to a close this week.
and when we hit the low of wave [iv],
we should then see a final rally develop in wave [v] of ‘C’
which will complete the whole correction in wave (2) blue as shown on the daily chart.
Tomorrow;
Wave (b) should trace out a three wave pattern
and may complete a lower high tomorrow evening.
Watch for wave (c) to carry lower again by Friday.
[/vc_column_text][/vc_column][/vc_row]
[vc_row][vc_column][vc_separator border_width=”5″][/vc_column][/vc_row][vc_row][vc_column][vc_column_text]
SILVER
[/vc_column_text][/vc_column][/vc_row][vc_row][vc_column][vc_separator border_width=”5″][/vc_column][/vc_row][vc_row][vc_column width=”2/3″][vc_custom_heading text=”1 hr” use_theme_fonts=”yes”][vc_column_text]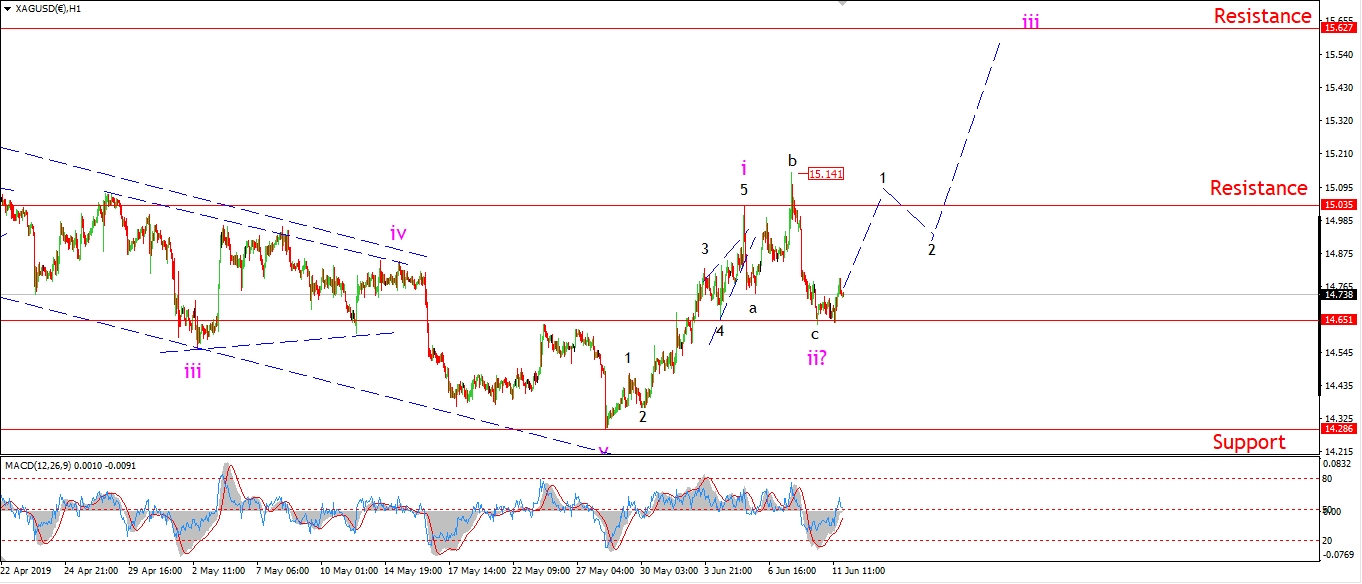 [/vc_column_text][/vc_column][vc_column width=”1/3″][vc_custom_heading text=”4 Hours” use_theme_fonts=”yes”][vc_column_text]
 [/vc_column_text][vc_custom_heading text=”Daily” use_theme_fonts=”yes”][vc_column_text]
 [/vc_column_text][/vc_column][/vc_row]
[vc_row][vc_column][vc_column_text]
Silver is rising off the lows of wave ‘ii’ now,
after hitting the target at 14.65 earlier today.
If wave ‘iii’ up is now taking over,
then we should see a small impulse wave higher develop over the rest of the week to begin that rally.
And wave ‘iii’ will be confirmed with a break of 15.14.
Tomorrow;
Watch for wave ‘1’ of ‘iii’ to rally back up to the 15.00 handle again.
A higher low above the wave ‘ii’ low will signal wave ‘iii’ has begun.
[/vc_column_text][/vc_column][/vc_row]
[vc_row][vc_column][vc_separator border_width=”5″][/vc_column][/vc_row][vc_row][vc_column][vc_column_text]
S&P 500.
[/vc_column_text][/vc_column][/vc_row][vc_row][vc_column][vc_separator border_width=”5″][/vc_column][/vc_row][vc_row][vc_column width=”2/3″][vc_custom_heading text=”1 hr” use_theme_fonts=”yes”][vc_column_text]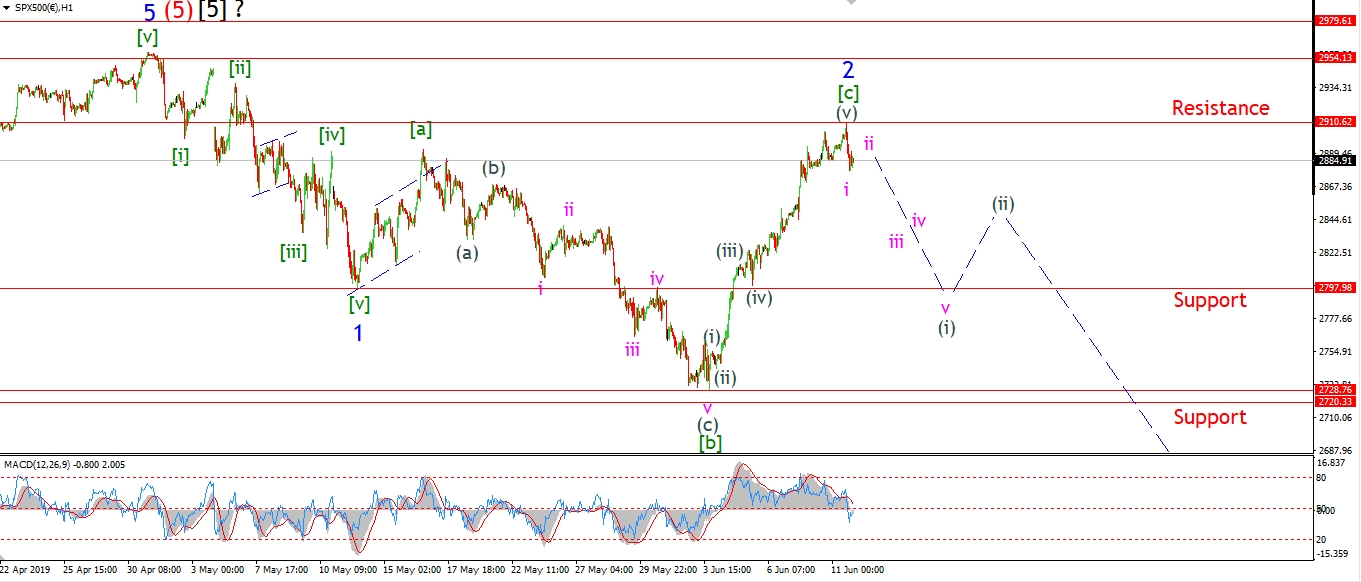 [/vc_column_text][/vc_column][vc_column width=”1/3″][vc_custom_heading text=”4 Hours” use_theme_fonts=”yes”][vc_column_text]
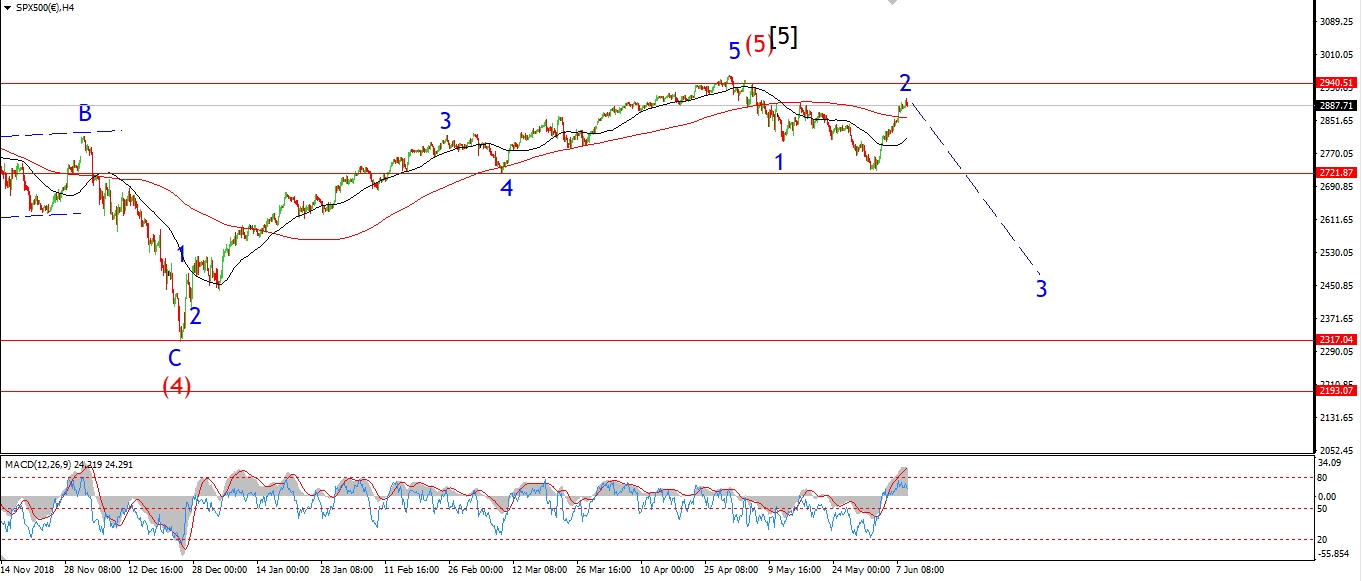 [/vc_column_text][vc_custom_heading text=”Daily” use_theme_fonts=”yes”][vc_column_text]
 [/vc_column_text][/vc_column][/vc_row]
[vc_row][vc_column][vc_column_text]
The S&P is dropping this mornings high with a nice sharp form so far.
I have labelled this decline as wave ‘i’ of (i).
This initial move off the high must now develop in an impulsive fashion to the downside,
in order to hold with the hard bearish outlook in wave ‘3’ blue.
But today’s action is a good start!
Wave (i) down should hit initial support at 2797 in a five wave move from here.
This price area marks a short term swing point for three previous waves.
And when it breaks,
it will be a good sign that wave [i] of ‘3’ has begun.
Tomorrow;
Watch for wave (i) down to continue lower as suggested by the short term pattern.
[/vc_column_text][/vc_column][/vc_row]
[vc_row][vc_column][vc_separator border_width=”5″][/vc_column][/vc_row]