
[vc_row][vc_column][vc_separator border_width=”5″][/vc_column][/vc_row]
[vc_row][vc_column][vc_column_text]
Good evening all.
Welcome to a new week.
[/vc_column_text][/vc_column][/vc_row]
[vc_row][vc_column][vc_separator border_width=”5″][/vc_column][/vc_row]
[vc_row][vc_column][vc_column_text]
EURUSD
[/vc_column_text][/vc_column][/vc_row]
[vc_row][vc_column][vc_separator border_width=”5″][/vc_column][/vc_row][vc_row][vc_column width=”2/3″][vc_custom_heading text=”1 hr” use_theme_fonts=”yes”][vc_column_text] [/vc_column_text][/vc_column][vc_column width=”1/3″][vc_custom_heading text=”4 Hours” use_theme_fonts=”yes”][vc_column_text]
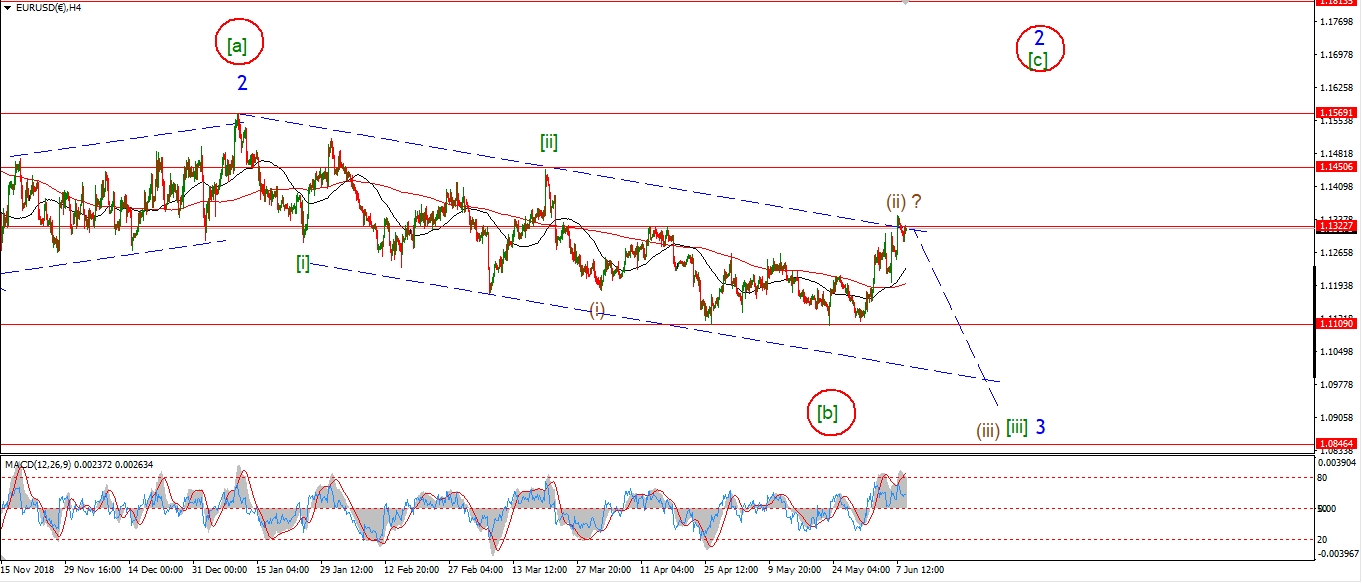 [/vc_column_text][vc_custom_heading text=”Daily” use_theme_fonts=”yes”][vc_column_text]
 [/vc_column_text][/vc_column][/vc_row]
[vc_row][vc_column][vc_column_text]
EURUSD is down today off Fridays high at wave ‘c’ of (ii).
This decline has yet to develop in five waves
but that can easily happen this week.
Wave ‘i’ down should form over the coming days in a clear five wave pattern.
Wave ‘ii’ of (iii) will then correct higher to form a bearish lower high
and setup for a larger decline in wave ‘iii’.
We are at a very large degree crossroads in EURUSD now.
The next short term action should decide the trend direction for the coming years.
So this is a critical point in the wave structure.
Tomorrow;
Watch for 1.1347 to hold and wave ‘i’ of (iii) to continue lower.
[/vc_column_text][/vc_column][/vc_row]
[vc_row][vc_column][vc_separator border_width=”5″][/vc_column][/vc_row][vc_row][vc_column][vc_column_text]
GBPUSD
[/vc_column_text][/vc_column][/vc_row][vc_row][vc_column][vc_separator border_width=”5″][/vc_column][/vc_row][vc_row][vc_column width=”2/3″][vc_custom_heading text=”1 hr” use_theme_fonts=”yes”][vc_column_text]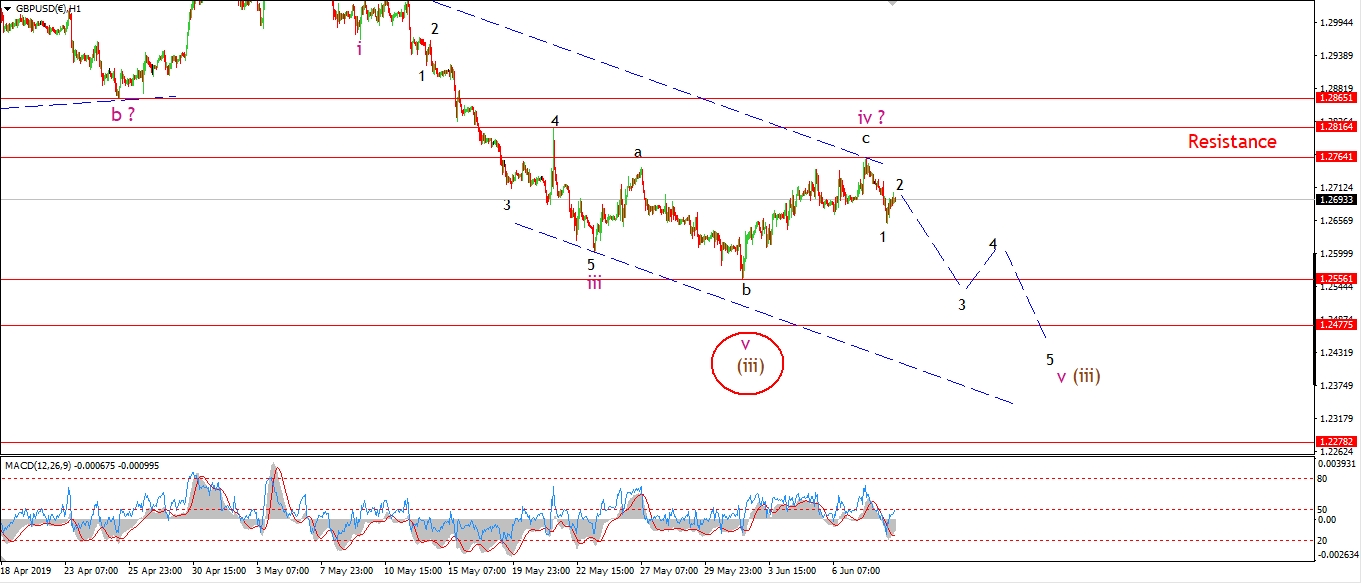 [/vc_column_text][/vc_column][vc_column width=”1/3″][vc_custom_heading text=”4 Hours” use_theme_fonts=”yes”][vc_column_text]
 [/vc_column_text][vc_custom_heading text=”Daily” use_theme_fonts=”yes”][vc_column_text]
 [/vc_column_text][/vc_column][/vc_row]
[vc_row][vc_column][vc_column_text]
Cable is beginning a fall today into wave ‘v’ of (iii).
After completing a three wave corrective pattern in wave ‘iv’ pink last Friday at 1.2764,
the price should now head lower to break the lower support level at 1.2475.
this is best viewed on the 4hr chart.
Tomorrow;
If todays decline is wave ‘1’ of ‘v’,
then wave ‘2’ is now creating a corrective lower high below 1.2764,
And wave ‘3’ of ‘v’ is set to carry the price towards the target later this week.
Watch for wave ‘2’ to complete and wave ‘3’ to begin tomorrow.
[/vc_column_text][/vc_column][/vc_row]
[vc_row][vc_column][vc_separator border_width=”5″][/vc_column][/vc_row][vc_row][vc_column][vc_column_text]
USDJPY
[/vc_column_text][/vc_column][/vc_row][vc_row][vc_column][vc_separator border_width=”5″][/vc_column][/vc_row][vc_row][vc_column width=”2/3″][vc_custom_heading text=”1 hr” use_theme_fonts=”yes”][vc_column_text]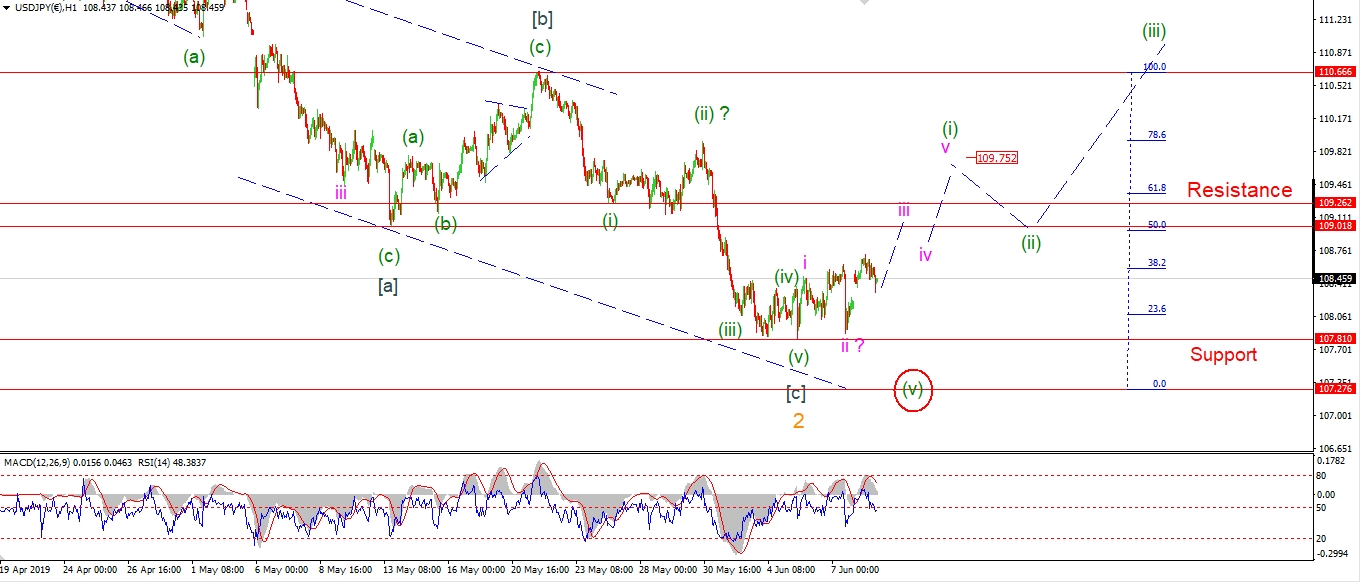 [/vc_column_text][/vc_column][vc_column width=”1/3″][vc_custom_heading text=”4 Hours” use_theme_fonts=”yes”][vc_column_text]
 [/vc_column_text][vc_custom_heading text=”Daily” use_theme_fonts=”yes”][vc_column_text]
 [/vc_column_text][/vc_column][/vc_row]
[vc_row][vc_column][vc_column_text]
USDJPY has created a series of stunted moves higher over the last few days trading.
This action has not yet developed into an impulsive structure off the lows,
the price is rather stepping higher gradually.
It is very possible that this subdividing higher is the beginning of a larger five wave move.
But we sill have to see a break of initial resistance at 109.26 by Wednesday to confirm that idea.
For the moment I am sticking with the bullish outlook but awaiting confirmation.
Tomorrow;
Watch for wave (v) to hold at 107.81.
And wave ‘iii’ to continue higher.
[/vc_column_text][/vc_column][/vc_row]
[vc_row][vc_column][vc_separator border_width=”5″][/vc_column][/vc_row][vc_row][vc_column][vc_column_text]
DOW JONES INDUSTRIALS
[/vc_column_text][/vc_column][/vc_row][vc_row][vc_column][vc_separator border_width=”5″][/vc_column][/vc_row][vc_row][vc_column width=”2/3″][vc_custom_heading text=”1 hr” use_theme_fonts=”yes”][vc_column_text]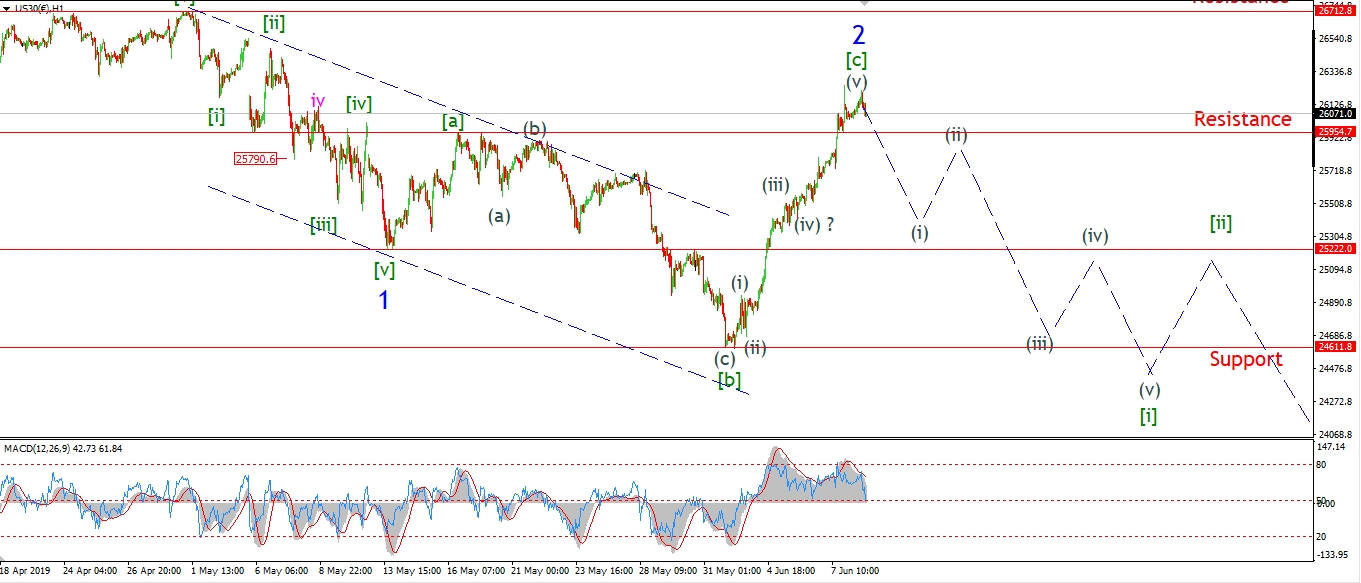 [/vc_column_text][/vc_column][vc_column width=”1/3″][vc_custom_heading text=”4 Hours” use_theme_fonts=”yes”][vc_column_text]
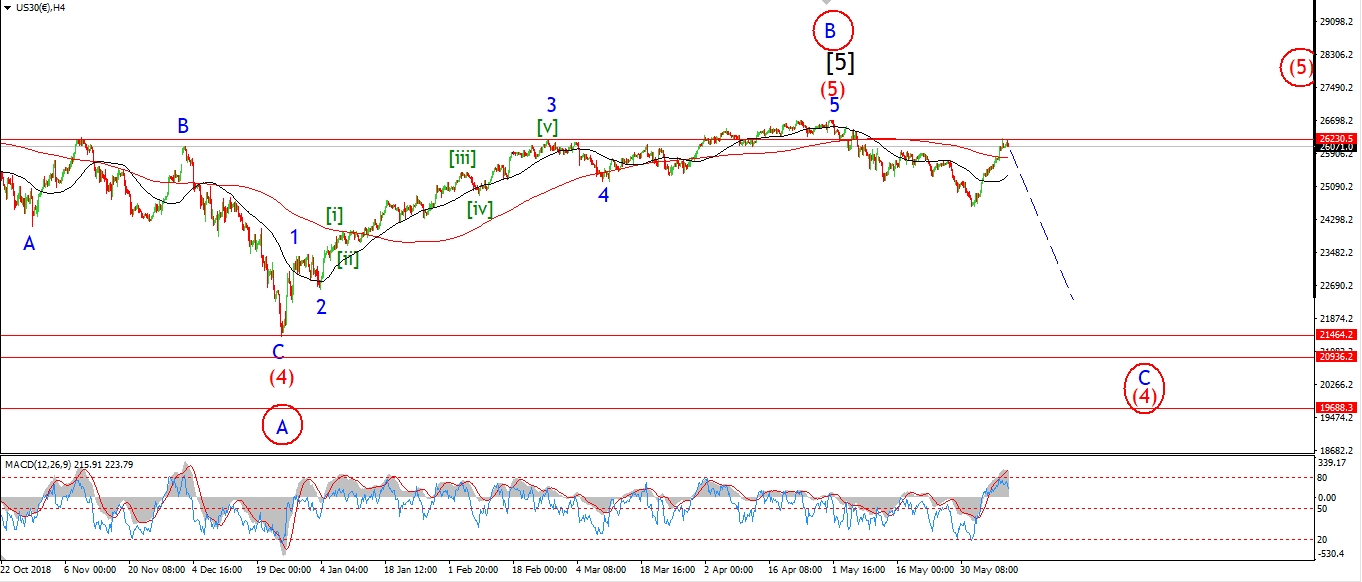 [/vc_column_text][vc_custom_heading text=”Daily” use_theme_fonts=”yes”][vc_column_text]
 [/vc_column_text][/vc_column][/vc_row]
[vc_row][vc_column][vc_column_text]
Wave ‘2’ is holding on for dear life today,
and the market is pretty flat off the wave [c] high of last Friday.
The price simply must head lower this week in a five wave form
to signal the turn lower into wave ‘3’ blue has begun.
So this week is looking like a critical week all round now.
Wave ‘1’ blue lies at 25222,
if the price falls for the next few sessions and breaks that level
that will be a good indication that wave (i) of [i] has begun as shown on the short term chart.
As for the 4hr chart;
last weeks blow out rally registered the highest momentum reading
in both MACD and RSI since the rally that began last January.
This was an extreme turnaround in momentum which I don’t think will last.
A second wave rally typically generates an over-bullish reaction,
and this time is now different.
I am reminded of the rally last November which was resulted in a complete collapse in December.
Something similar is on the cards this time also.
Tomorrow;
Watch for wave (i) of [i] of ‘3’ to begin with a five wave move lower towards 25500.
[/vc_column_text][/vc_column][/vc_row]
[vc_row][vc_column][vc_separator border_width=”5″][/vc_column][/vc_row][vc_row][vc_column][vc_column_text]
GOLD
[/vc_column_text][/vc_column][/vc_row][vc_row][vc_column][vc_separator border_width=”5″][/vc_column][/vc_row][vc_row][vc_column width=”2/3″][vc_custom_heading text=”1 hr” use_theme_fonts=”yes”][vc_column_text]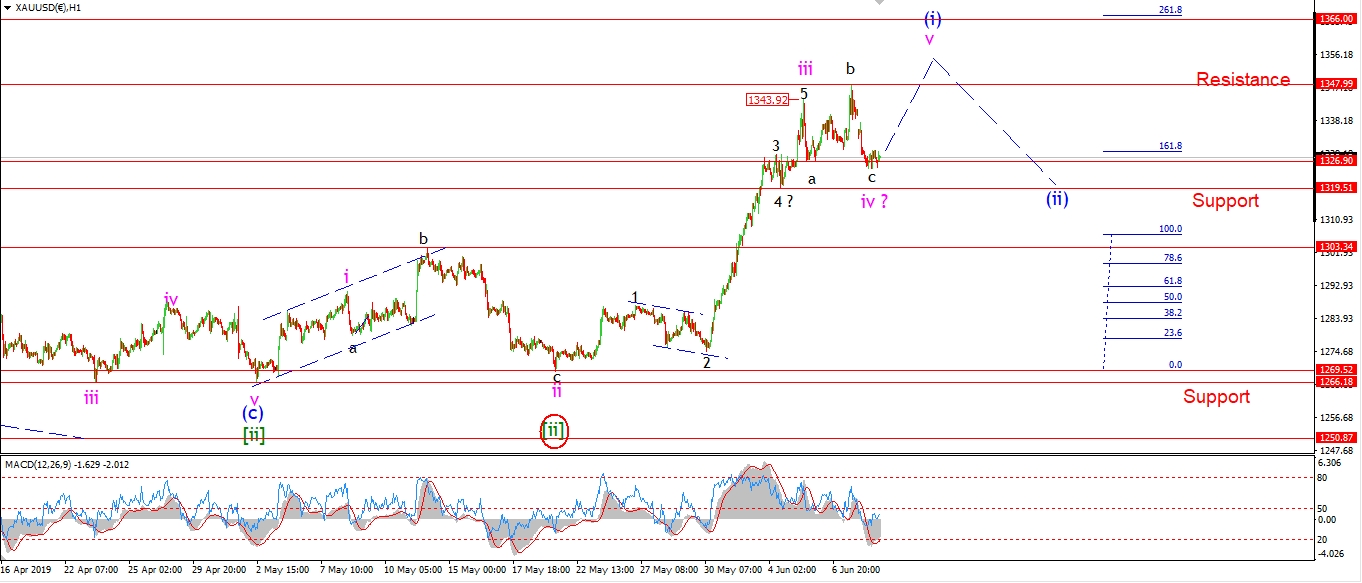 [/vc_column_text][/vc_column][vc_column width=”1/3″][vc_custom_heading text=”4 Hours” use_theme_fonts=”yes”][vc_column_text]
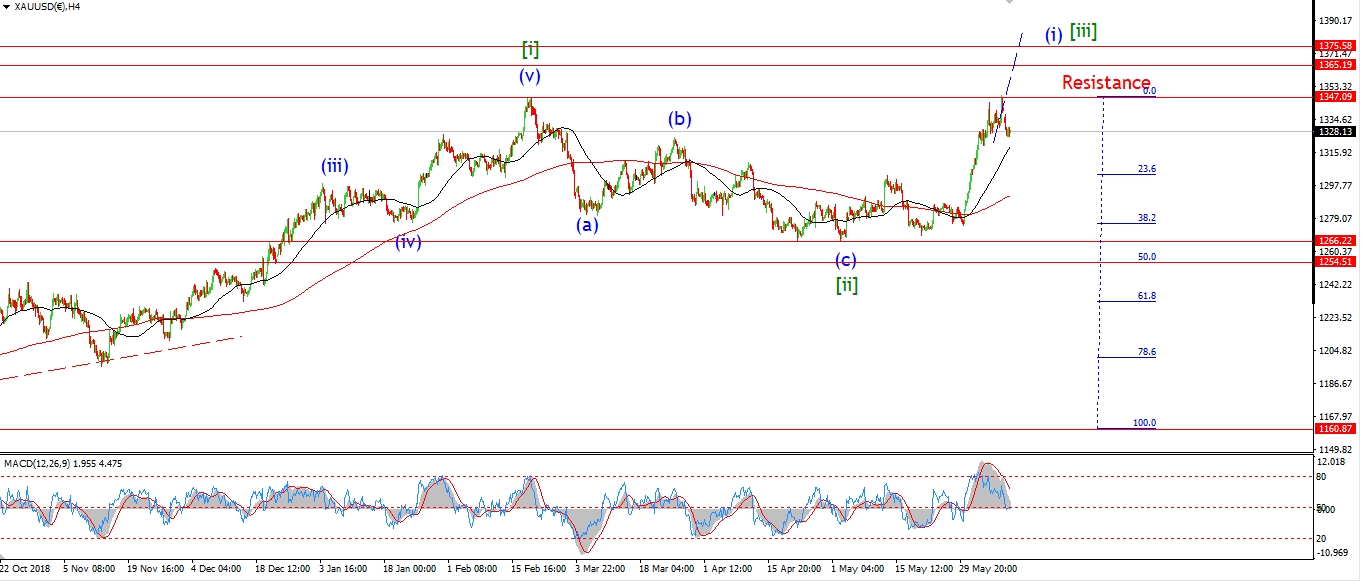 [/vc_column_text][vc_custom_heading text=”Daily” use_theme_fonts=”yes”][vc_column_text]
 [/vc_column_text][/vc_column][/vc_row]
[vc_row][vc_column][vc_column_text]
After a sharp move lower off the wave ‘b’ high,
GOLD has reached the the initial target area for wave ‘c’ and wave ‘iv’ with a slight break of the previous wave ‘a’ low at 1326.
The next support lies at 1319,
which is the previous fourth wave at one lower degree.
So we are again in an area of support which should form a short term low in wave ‘iv’.
Ideally this will lead to a rally in wave ‘v’ of (i) to complete five waves up off the recent extreme low at 1266.
This $80 rally has been on the cards for a while,
and should only be the beginning of the next leg up in the larger wave count on the 4hr chart.
But first we have to complete a five waves higher off the lows,
and then a three wave correction to a bullish higher low in wave (ii) as shown.
That price action will create yet another bullish opportunity for GOLD.
Tomorrow;
Watch for wave ‘iv’ to complete nearby.
A spike higher higher off 1319 will signal that wave ‘v’ has begun.
A break of 1348 will confirm it.
[/vc_column_text][/vc_column][/vc_row]
[vc_row][vc_column][vc_separator border_width=”5″][/vc_column][/vc_row][vc_row][vc_column][vc_column_text]
U.S CRUDE OIL
[/vc_column_text][/vc_column][/vc_row][vc_row][vc_column][vc_separator border_width=”5″][/vc_column][/vc_row][vc_row][vc_column width=”2/3″][vc_custom_heading text=”1 hr” use_theme_fonts=”yes”][vc_column_text]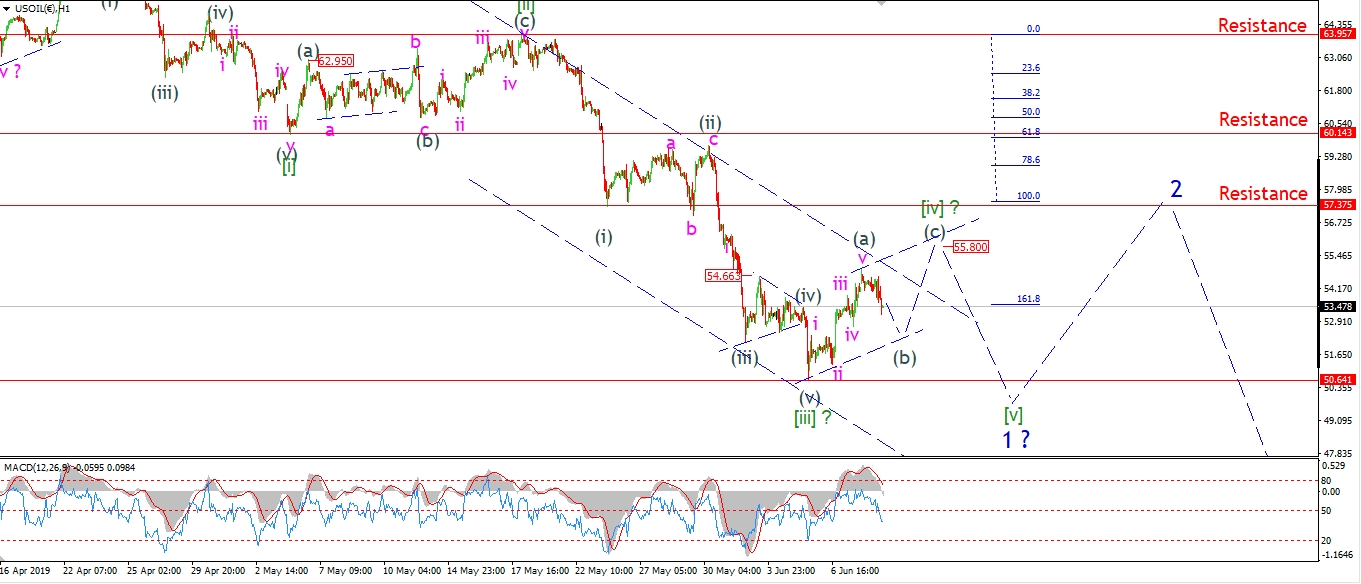 [/vc_column_text][/vc_column][vc_column width=”1/3″][vc_custom_heading text=”4 Hours” use_theme_fonts=”yes”][vc_column_text]
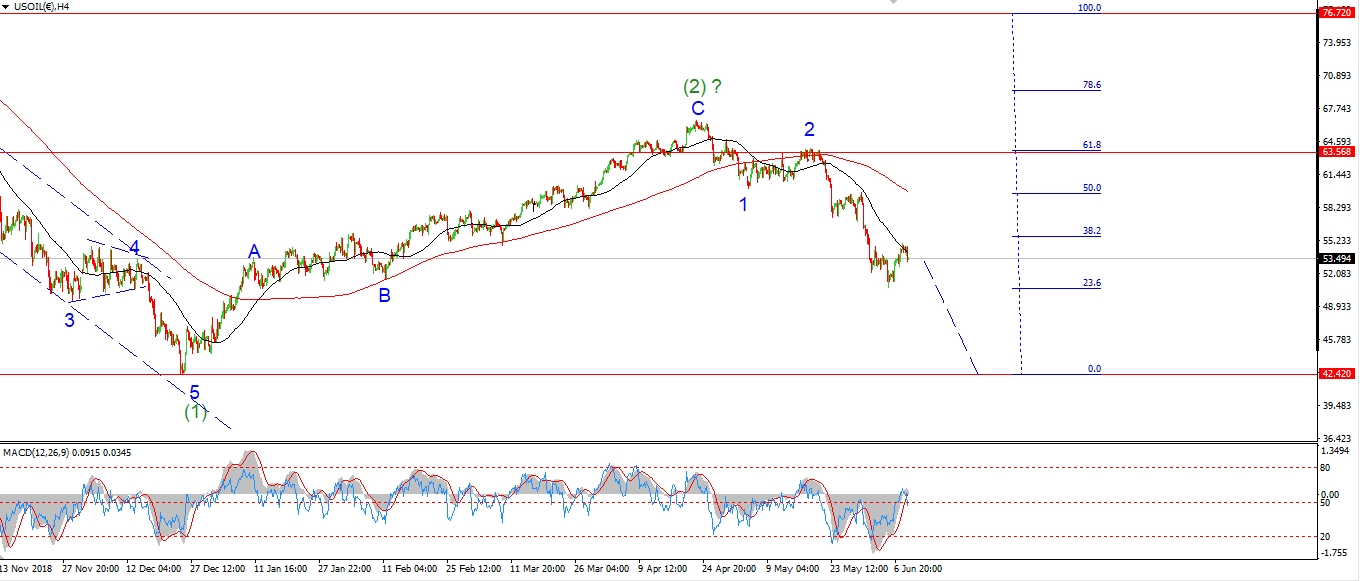 [/vc_column_text][vc_custom_heading text=”Daily” use_theme_fonts=”yes”][vc_column_text]
 [/vc_column_text][/vc_column][/vc_row]
[vc_row][vc_column][vc_column_text]
Crude seems to have topped out now in wave (a) of [iv].
Wave (a) created a five wave pattern higher,
so this correction is likely a simple zigzag correction,
which should trace out a 5,3,5 internal pattern.
Wave (b) is now underway off the high and should complete at about 52.70,
this level forms the low of wave ‘iv’ of (a).
Once this correction in wave (b) is done,
then wave (c) should rally to about 56.00 again and then close out wave [iv] green.
Tomorrow;
watch for wave (b) to complete at 52.50 and then turn higher into wave (c).
[/vc_column_text][/vc_column][/vc_row]
[vc_row][vc_column][vc_separator border_width=”5″][/vc_column][/vc_row][vc_row][vc_column][vc_column_text]
US 10 yr Treasuries.
[/vc_column_text][/vc_column][/vc_row][vc_row][vc_column][vc_separator border_width=”5″][/vc_column][/vc_row][vc_row][vc_column width=”2/3″][vc_custom_heading text=”1 hr” use_theme_fonts=”yes”][vc_column_text]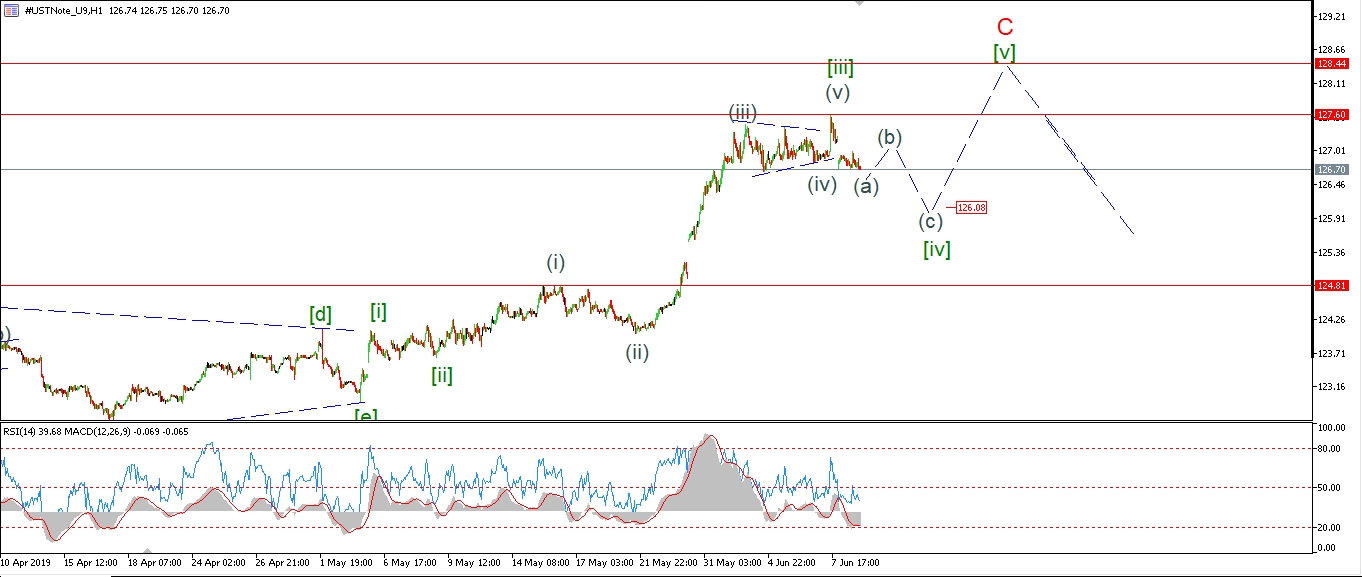 [/vc_column_text][/vc_column][vc_column width=”1/3″][vc_custom_heading text=”4 Hours” use_theme_fonts=”yes”][vc_column_text]
 [/vc_column_text][vc_custom_heading text=”Daily” use_theme_fonts=”yes”][vc_column_text]
 [/vc_column_text][/vc_column][/vc_row]
[vc_row][vc_column][vc_column_text]
The 10YR is lower again today in wave (a) of [iv].
I have shown a three wave pattern now underway in wave [iv] green.
And this should continue lower over the coming days.
Once wave [iv] completes, possibly later this week,
wave [v] of ‘C’ should then carry prices back towards the target at 128.00 again.
Tomorrow;
Watch for wave [iv] to continue for the rest of this week.
the eventual pattern is not yet known,
but we should see at least a three wave correction.
[/vc_column_text][/vc_column][/vc_row]
[vc_row][vc_column][vc_separator border_width=”5″][/vc_column][/vc_row][vc_row][vc_column][vc_column_text]
SILVER
[/vc_column_text][/vc_column][/vc_row][vc_row][vc_column][vc_separator border_width=”5″][/vc_column][/vc_row][vc_row][vc_column width=”2/3″][vc_custom_heading text=”1 hr” use_theme_fonts=”yes”][vc_column_text] [/vc_column_text][/vc_column][vc_column width=”1/3″][vc_custom_heading text=”4 Hours” use_theme_fonts=”yes”][vc_column_text]
 [/vc_column_text][vc_custom_heading text=”Daily” use_theme_fonts=”yes”][vc_column_text]
 [/vc_column_text][/vc_column][/vc_row]
[vc_row][vc_column][vc_column_text]
Silver dropped sharply off Fridays high as expected,
and broke the initial target level at 14.74 today.
This decline is in five waves and is labelled wave ‘c’,
and it completes an expanded flat wave ‘ii’ pink as shown.
The correction should now be exhausted at this low.
and the price should now begin to turn higher again tomorrow to begin wave ‘iii’ up.
A break of 15.14 will confirm that wave ‘iii’ has begun.
Tomorrow;
Price must hold above 14.26 at the extreme low of wave [ii].
Watch for wave ‘iii’ to begin with a spike higher again.
[/vc_column_text][/vc_column][/vc_row]
[vc_row][vc_column][vc_separator border_width=”5″][/vc_column][/vc_row][vc_row][vc_column][vc_column_text]
S&P 500.
[/vc_column_text][/vc_column][/vc_row][vc_row][vc_column][vc_separator border_width=”5″][/vc_column][/vc_row][vc_row][vc_column width=”2/3″][vc_custom_heading text=”1 hr” use_theme_fonts=”yes”][vc_column_text]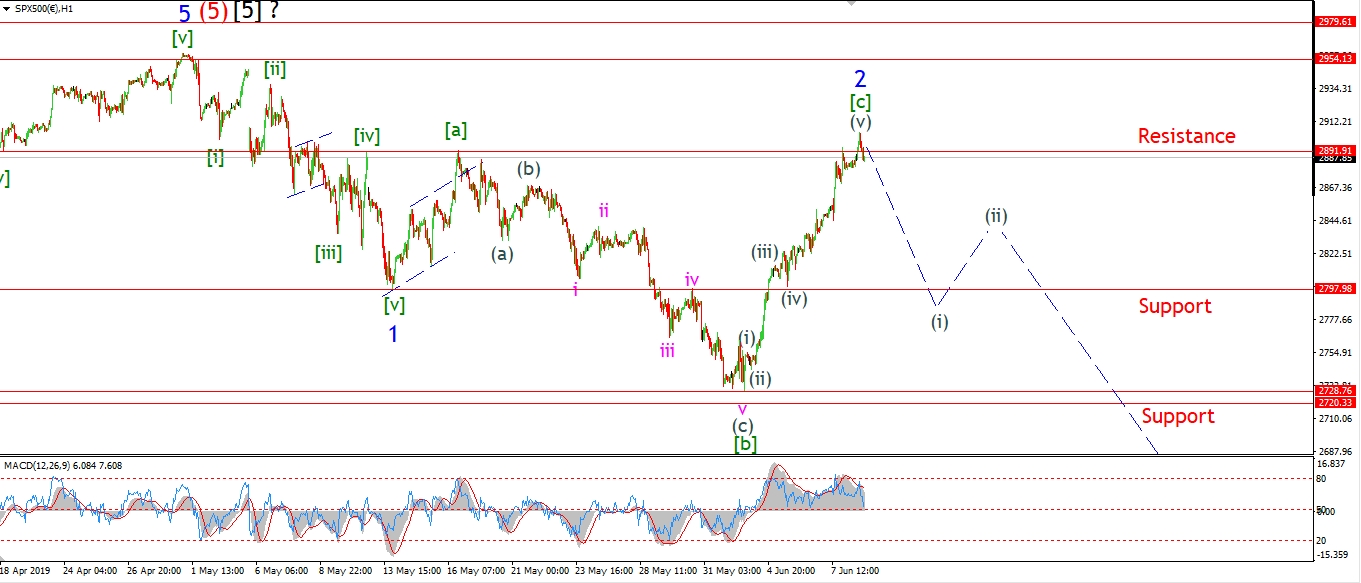 [/vc_column_text][/vc_column][vc_column width=”1/3″][vc_custom_heading text=”4 Hours” use_theme_fonts=”yes”][vc_column_text]
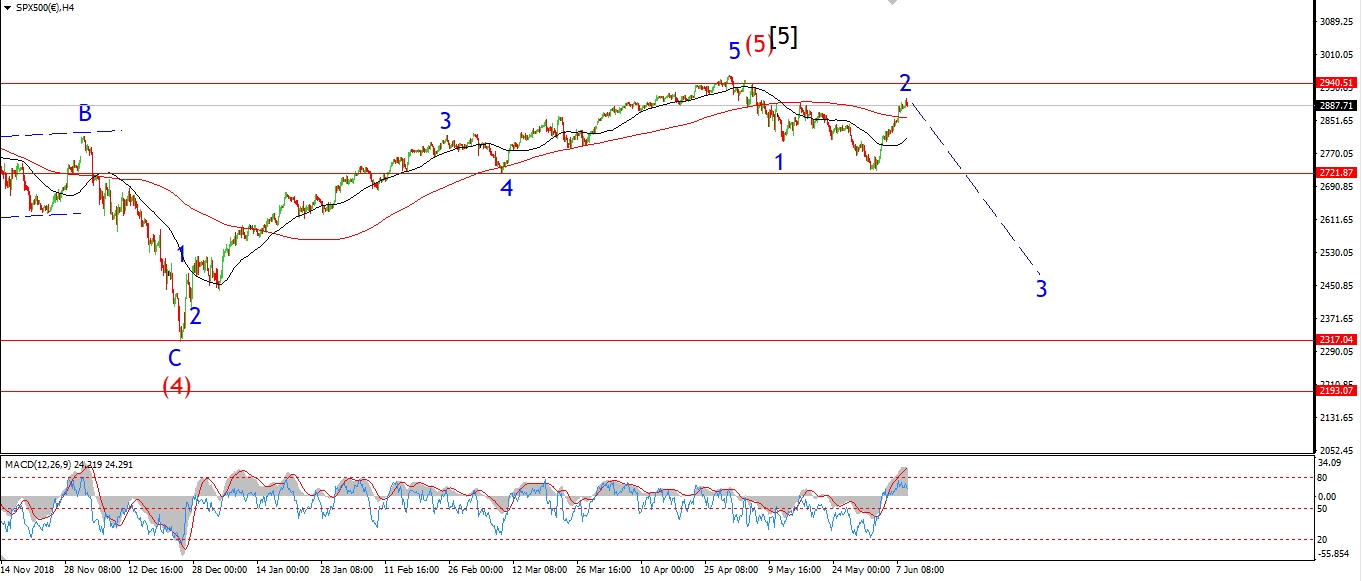 [/vc_column_text][vc_custom_heading text=”Daily” use_theme_fonts=”yes”][vc_column_text]
 [/vc_column_text][/vc_column][/vc_row]
[vc_row][vc_column][vc_column_text]
The exact same momentum setup is on display in the S&P as in the DOW.
MACD hit an extreme last week to match the previous highs of last November.
And we all know what happened in December when the market plunged for a month without an answer.
4hr chart;
This high is viewed as a second wave high labelled wave ‘2’ blue.
Wave ‘3’ down should follow soon,
and carry the price back towards 2400 when complete.
The market must fall this week off this high and create a five wave pattern lower.
If that happens in wave (i),
then wave (ii) should follow to a bearish lower high.
And at that point we will have a bearish signal in place to begin wave ‘3’ down.
Tomorrow;
All this depends on the all time high at 2954 holding as wave ‘2’ completes.
Watch for wave (i) of [i] to begin tomorrow.
A break below 2800 again will confirm wave (i).
[/vc_column_text][/vc_column][/vc_row]
[vc_row][vc_column][vc_separator border_width=”5″][/vc_column][/vc_row]