
Good evening folks, and may the Lord of hosts Bless you tonight.

EURUSD.
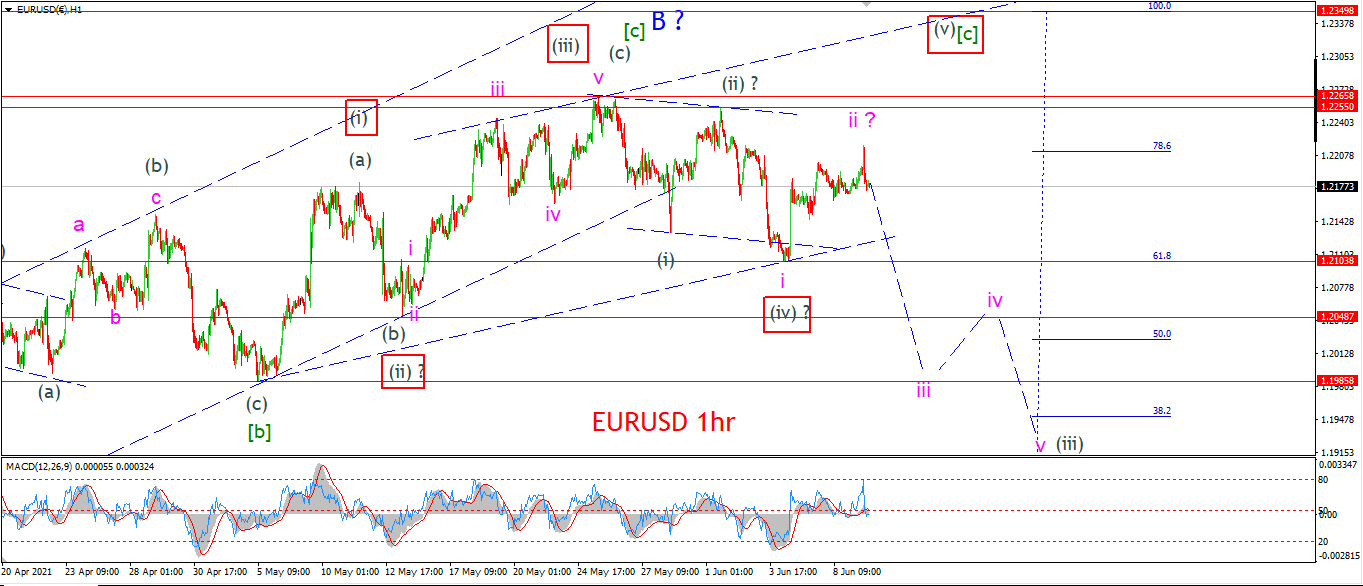
EURUSD 1hr.
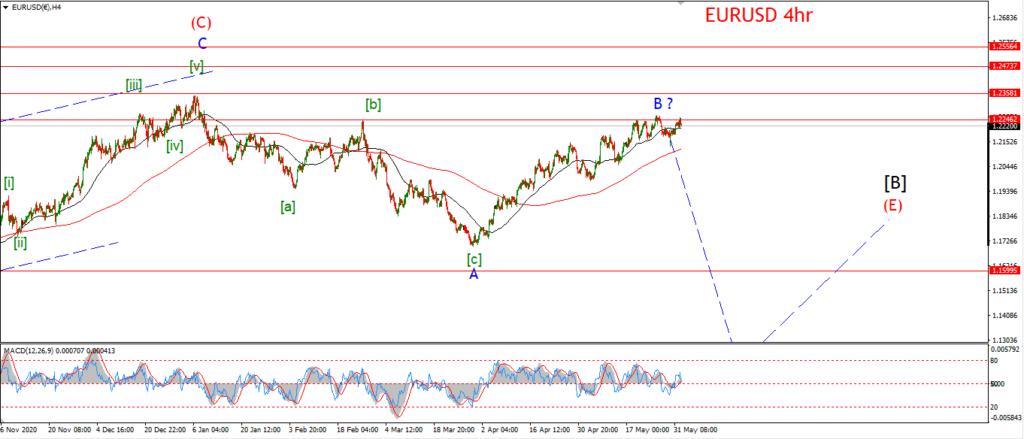
EURUSD 4hr.
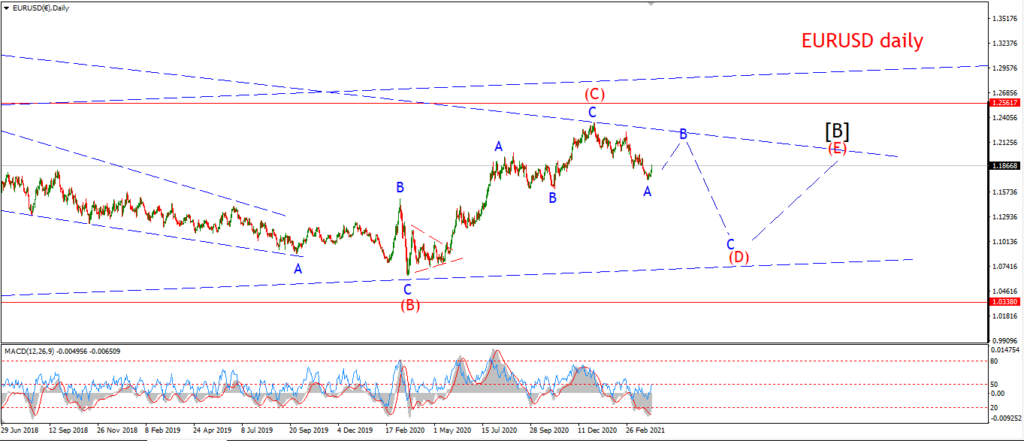
EURUSD daily.
Well,
I am going to be forced to think more seriously about alternate counts tomorrow I think!
The market has not budged off this lower high all week,
which actually keeps the door open for the wave (iii) down scenario.
But,
I cant rule out alternate count until we see confirmation of the main count by turning lower and breaking that wave ‘i’ low at 1.2103.
Tomorrow;
I will allow one more day for a break of that wave ‘i’ low to confirm the main count.
Watch 1.2103 at the wave ‘i’ low.
GBPUSD
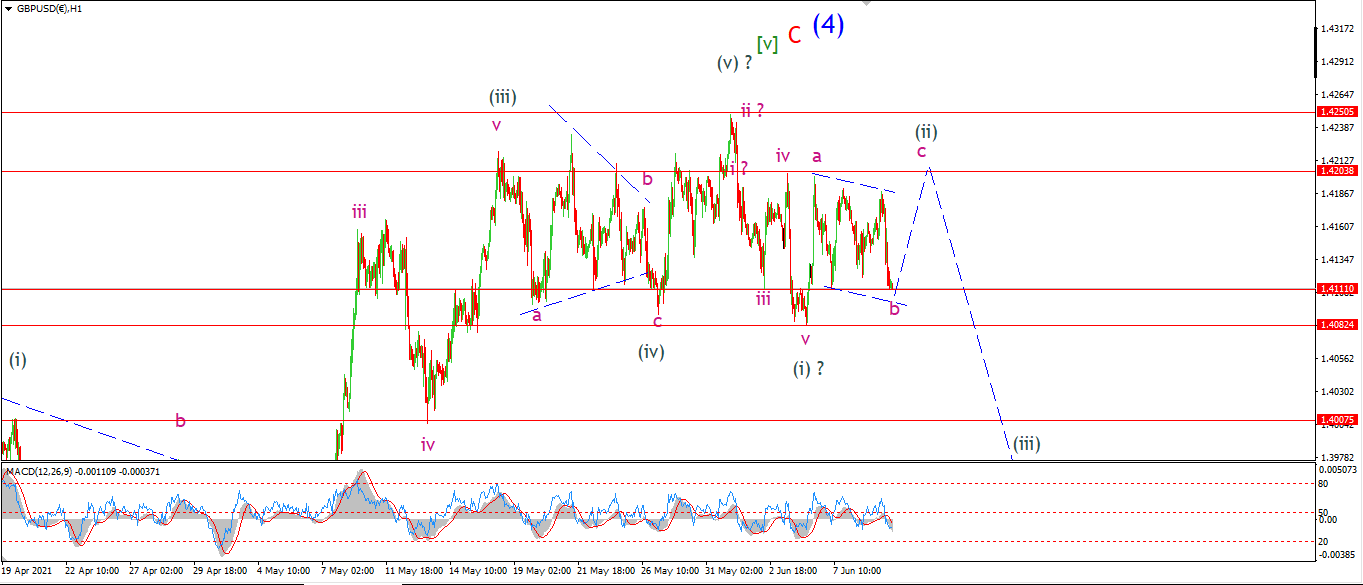
GBPUSD 1hr.
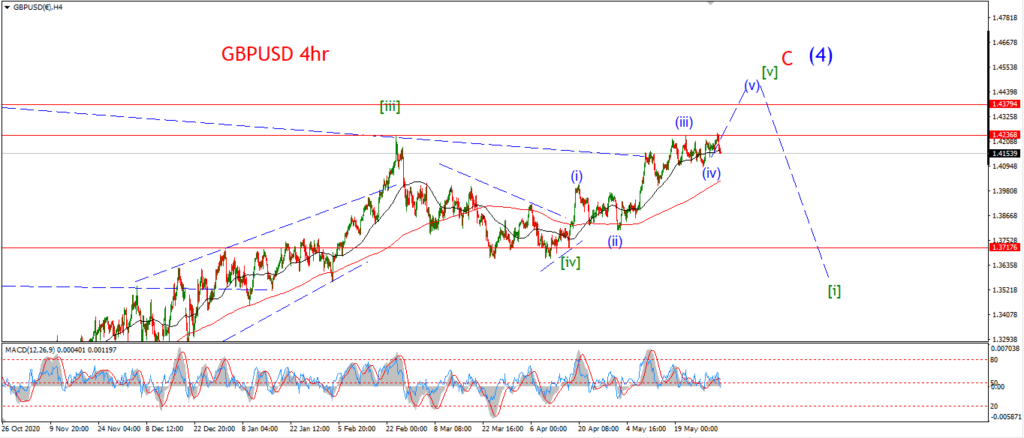
GBPUSD 4hr.
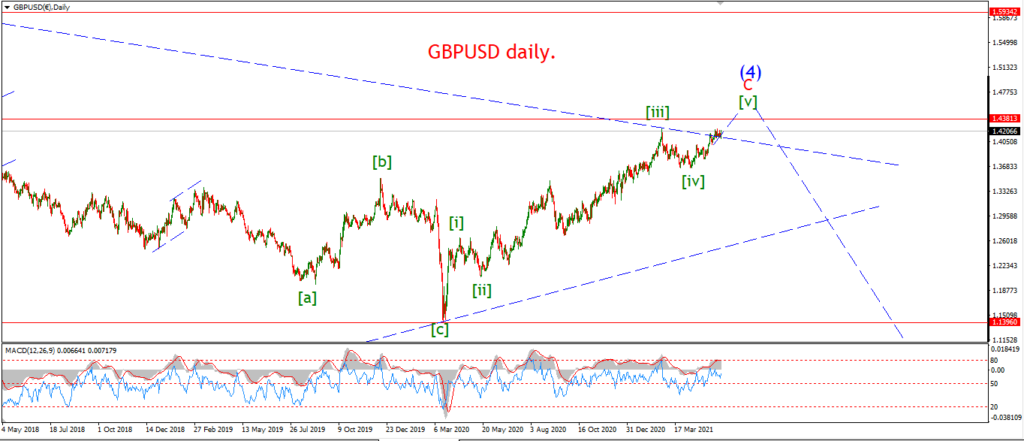
GBPUSD daily.
The price has broken out of the triangle wave ‘b’ pattern this evening by breaking 1.4120 again.
this does not rule out a decline in wave ‘b’ though altogether.
So this evening I am looking at a three wave flat correction in wave ‘b’,
once this pattern in wave ‘b’ completes with a break of 1.4111 again,
then I will look for wave ‘c’ to rally above 1.4203 again to complete the correction in wave (ii) and then on to wave (iii) down.
Tomorrow;
Watch for wave ‘b’ to bottom above 1.4082 at wave ‘i’,
and then rally again into wave ‘c’ of (ii).
USDJPY.
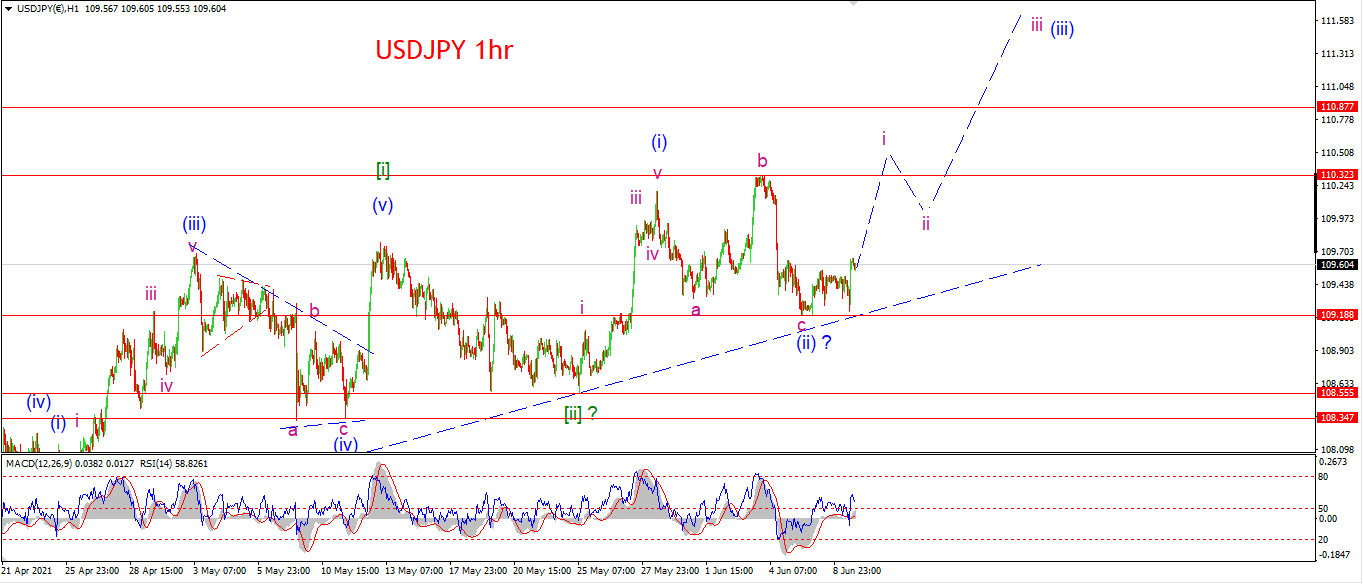
USDJPY 1hr.
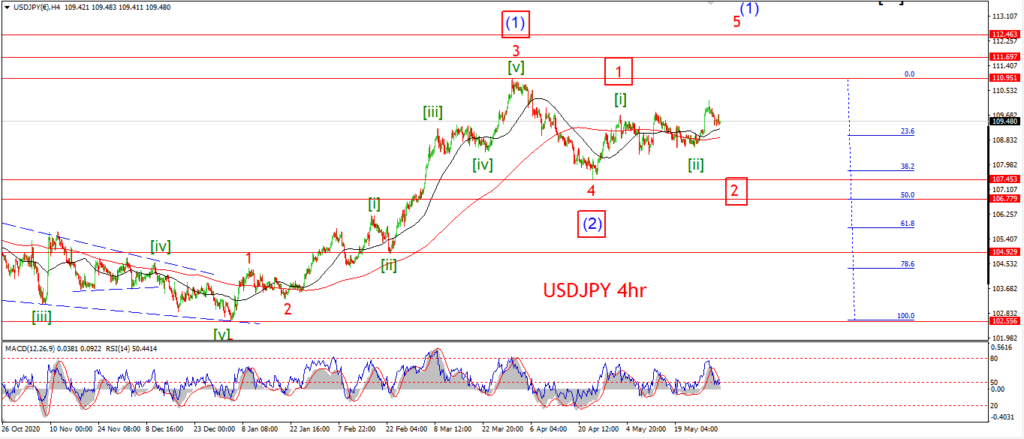
USDJPY 4hr.
USDJPY daily.
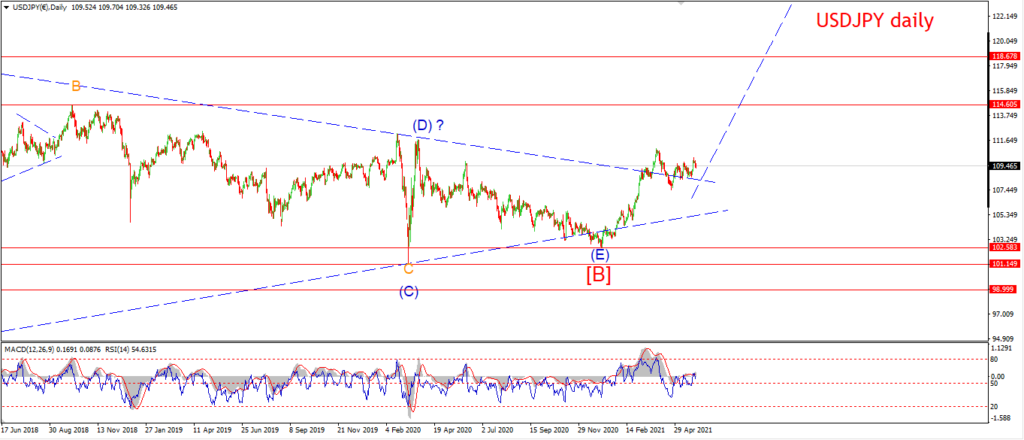
So far the low at wave ‘c’ of (ii) comes in at 109.18.
A the price did test that low today but held above and then we saw another spike higher this evening.
The rising trend line is holding firm again and now we have a possibility that wave ‘i’ of (iii) is now beginning.
Tomorrow.
Watch for wave ‘c’ of (ii) to hold at 109.18 overnight.
Wave ‘i’ of (iii) will be confirmed if we see a five wave rally to break 110.32 again.
DOW JONES.
DOW 1hr.
DOW 4hr
DOW daily.
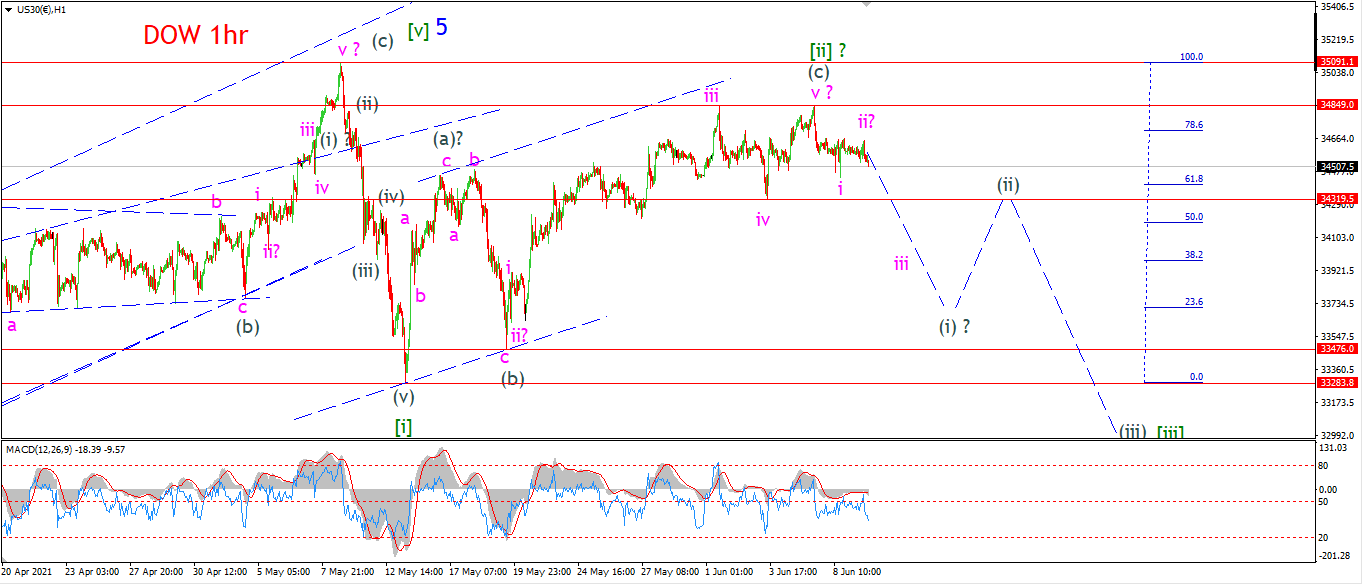
I think we might be experiencing a stay of execution today as the market is drifting flat to nowhere before options expiry on Friday.
It is likely to be pretty flat until after options expiry going on the last few expiry dates.
So I may well have to wait and bite my tongue a little longer until next week for the pattern to reveal itself.
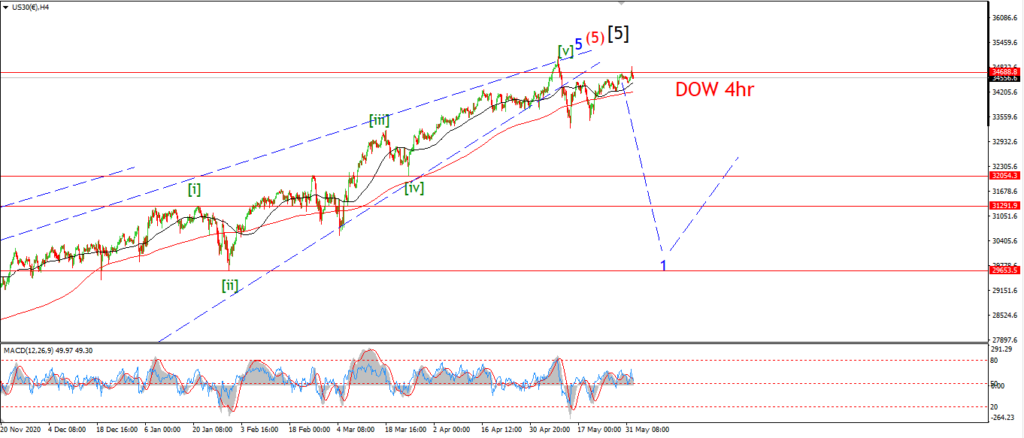
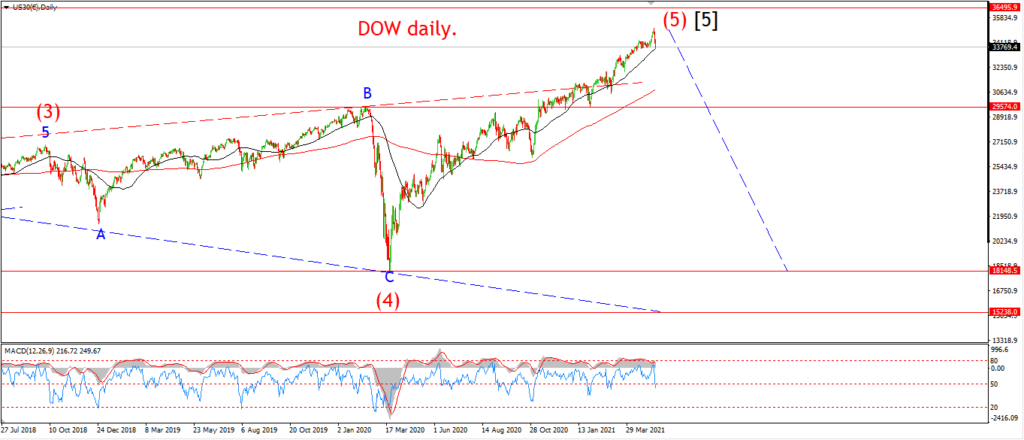
I am holding with the idea of a small impulse decline off wave [ii] to begin wave (i) down.
This pattern will be confirmed if the market falls below 34320 again.
Apart from that action into wave ‘iii’ down,
I am just waiting again to let the market speak!
Tomorrow;
The high at wave [ii] must hold at 34849.
34320 is the level to watch.
GOLD
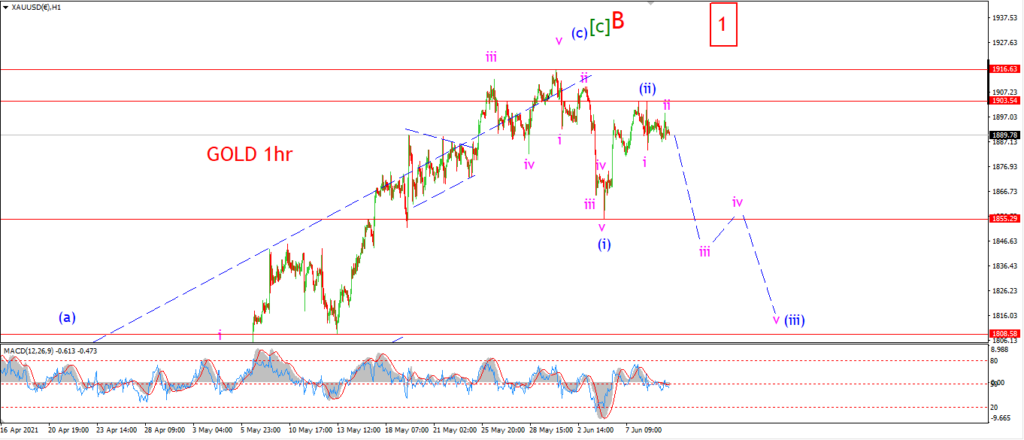
GOLD 1hr.
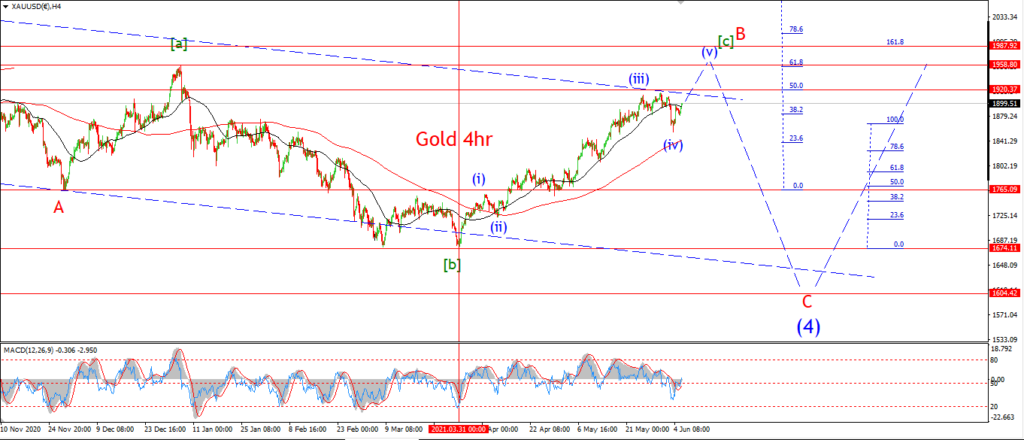
GOLD 4hr.
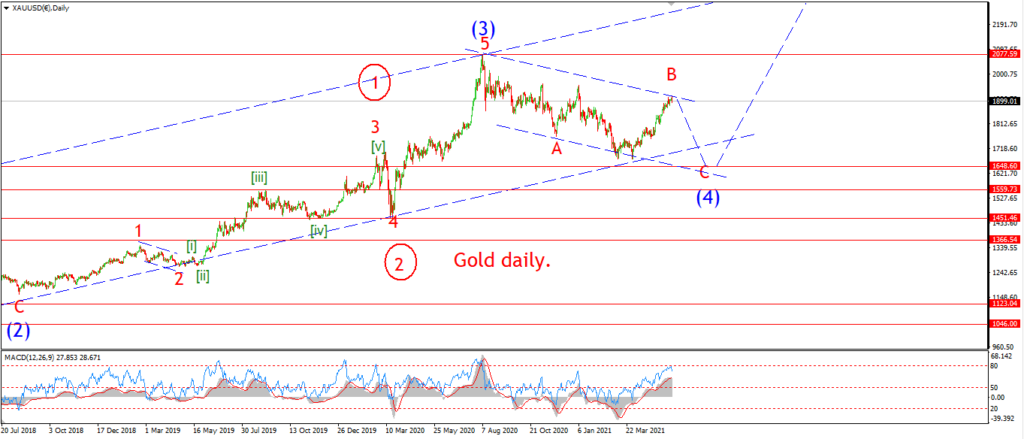
GOLD daily.
Am am willing tonight to suggest that wave (iii) has begun off Tuesdays high.
The price is corrective to the upside today with a very small lower high in place now .
Todays high takes the wave ‘ii’ label,
and now wave ‘iii’ down is expected to fall below 1855 again.
If this occurs as suggested,
then wave (iii) down will be confirmed and we can expect further declines next week to continue wave [i] down.
Tomorrow;
1855 is the key here.
Watch for wave (ii) to hold at 1903 and continue lower tomorrow.
CRUDE OIL.
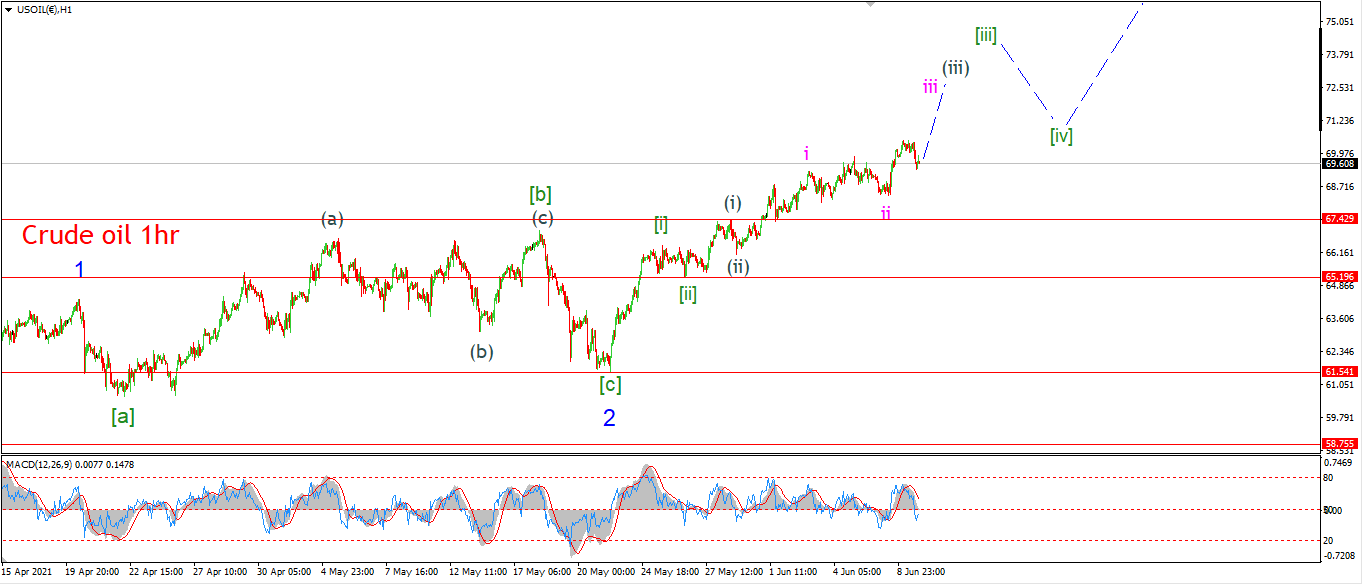
CRUDE OIL 1hr.
CRUDE OIL 4hr.
CRUDE OIL daily.
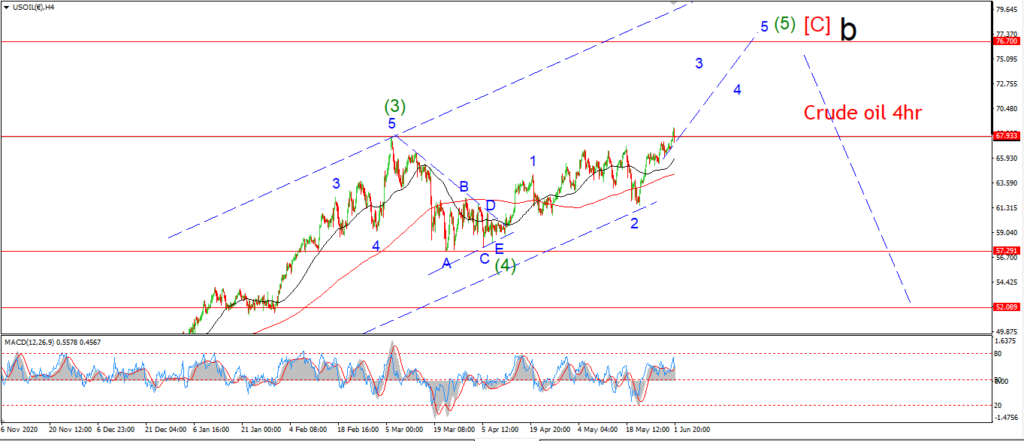
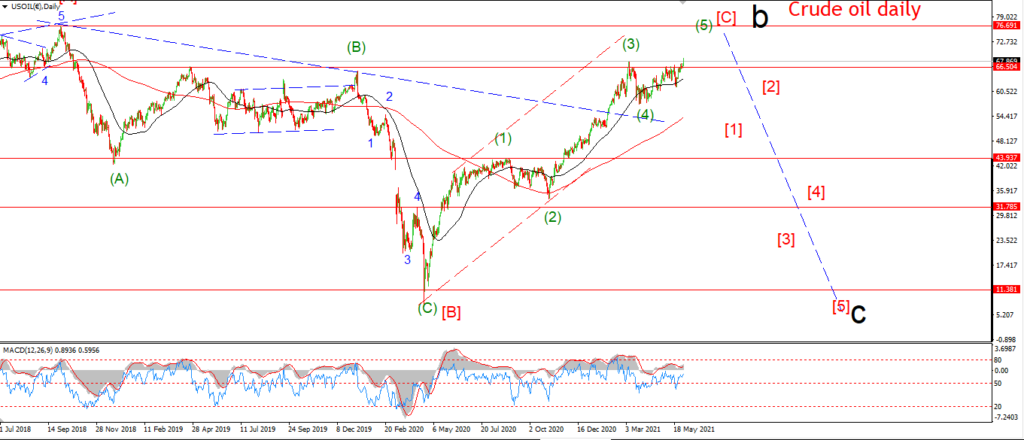
Another day and another overlap of a previous high in crude.
I have mentioned it a few times now this week,
that I am not at all convinced we are moving in a large third wave up.
The only problem being that,
at the moment I do not have a better alternative count to work with yet!
If we get a see a move below 65.19 again that will change circumstances in favor of a topping pattern again.
But until then wave (iii) up it is.
Tomorrow;
The initial support for the short term pattern lies at 67.42 at wave (i).
A break of that level will rule out wave (iii) up I think.
S&P 500.
S&P 500 1hr
S&P 500 4hr
S&P 500 daily.
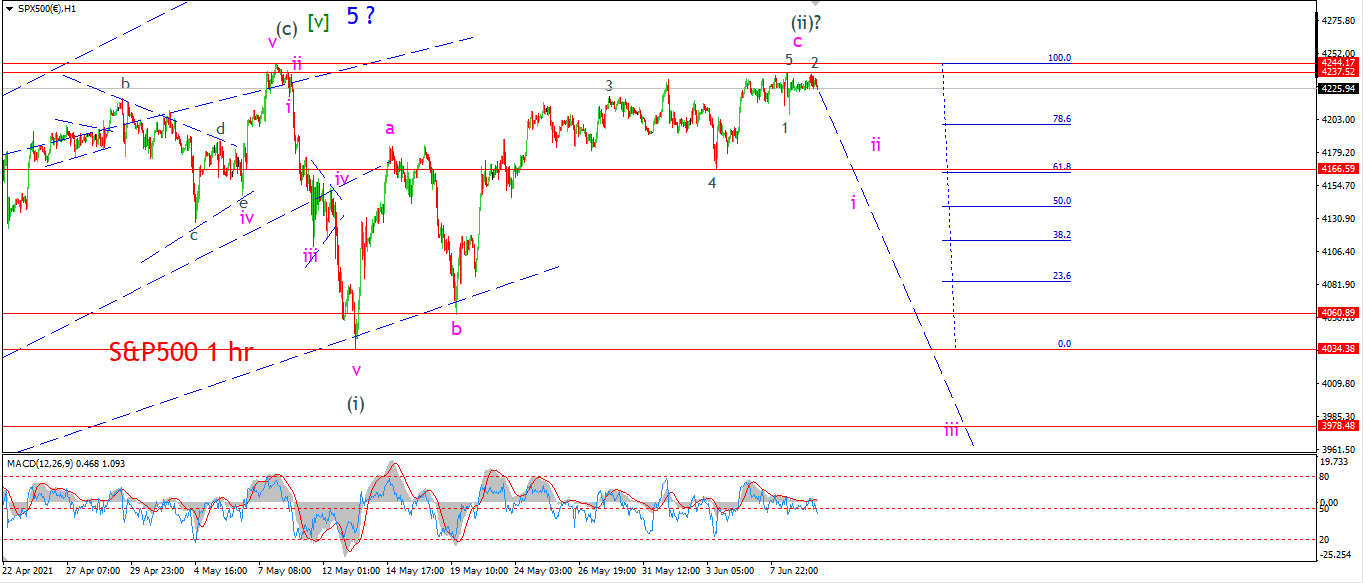
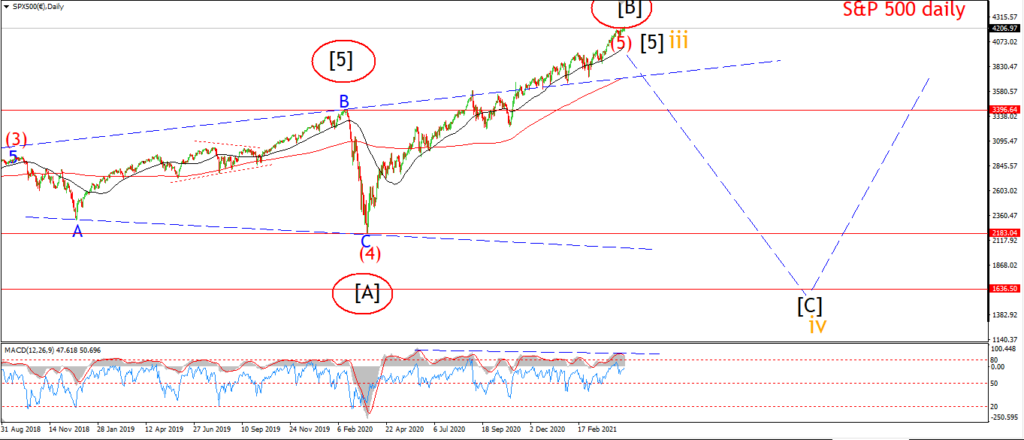
Is it possible that we have a very small impulse wave lower in place today?
That idea will allow for a decline in wave ‘i’ to occur before Friday.
Of course the margin for error her is miniscule with the market so close to its previous highs.
And options expiry this Friday can easily cause a spike to break this pattern.
In general,
I am dealing with razor thin margins here,
and I do not like it to be honest.
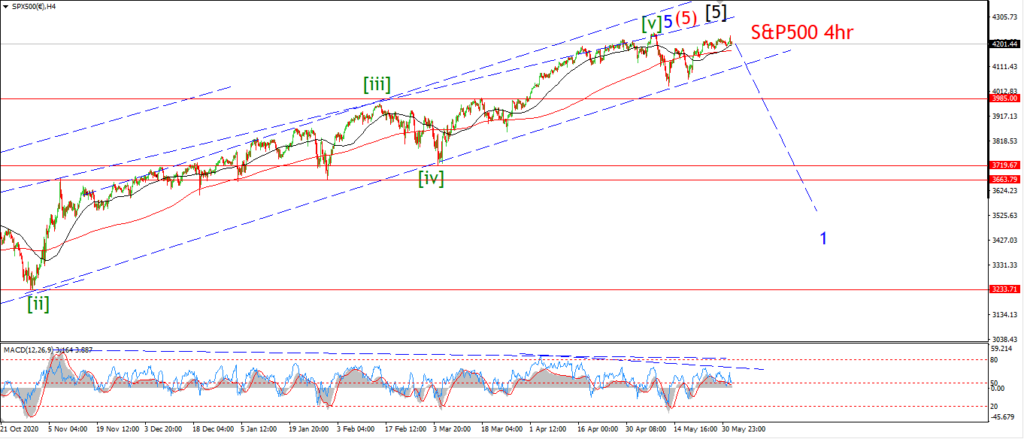
In defense of the bearish setup I am going to point out the obvious here,
the market has again refused to break and we sit below the all time high again.
And the pattern up off the wave (i) low has a three wave form into this high.
So at this point, even though we are too close for comfort to that all time high,
the bearish count still stands until it doesn’t!
Tomorrow;
4166 is the level I am watching for a signal that wave ‘i’ of (iii) is underway.
SILVER.
SILVER 1hr
SILVER 4hr.
SILVER daily.
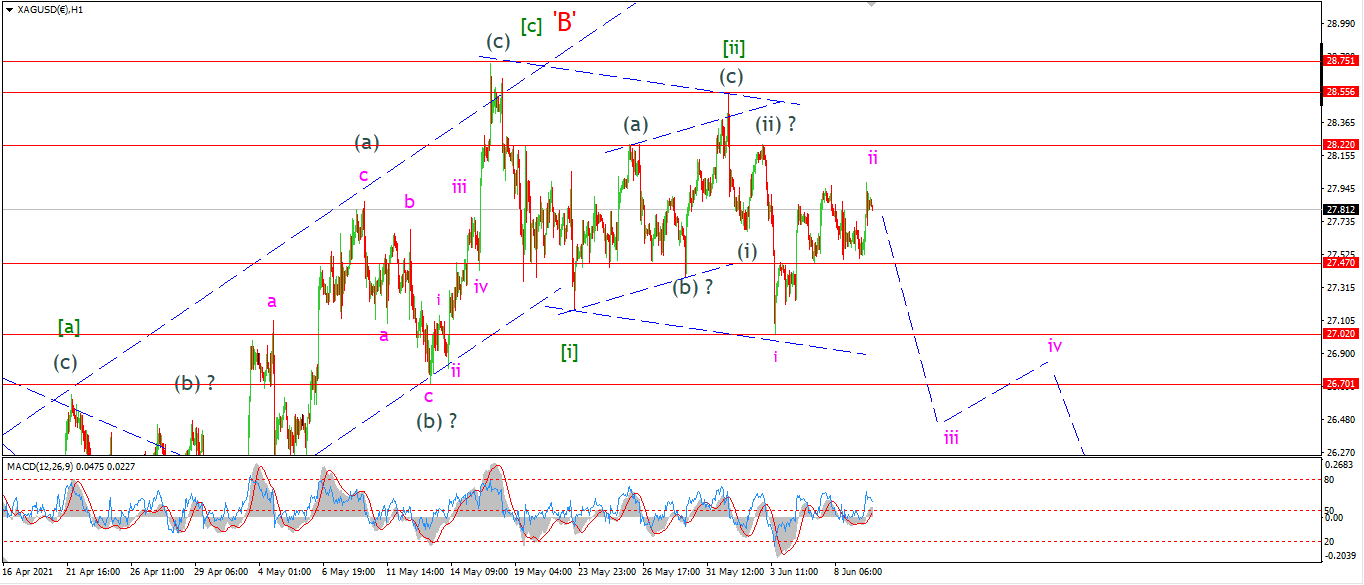
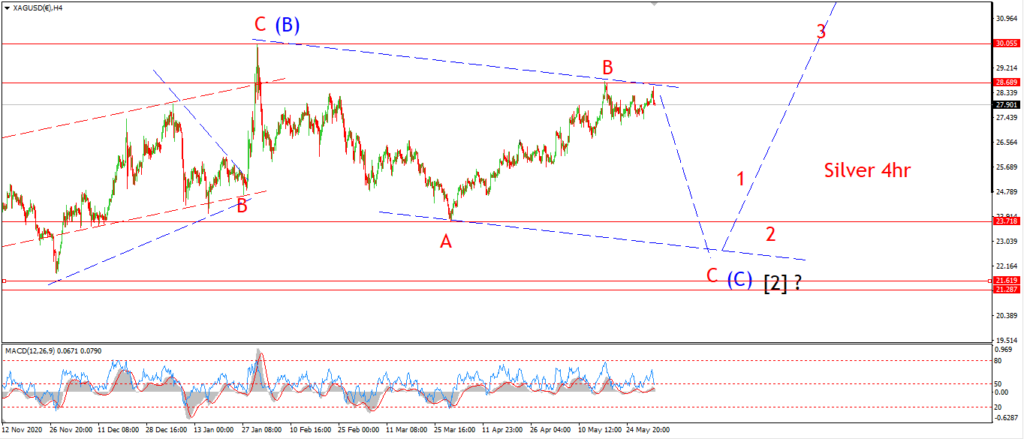
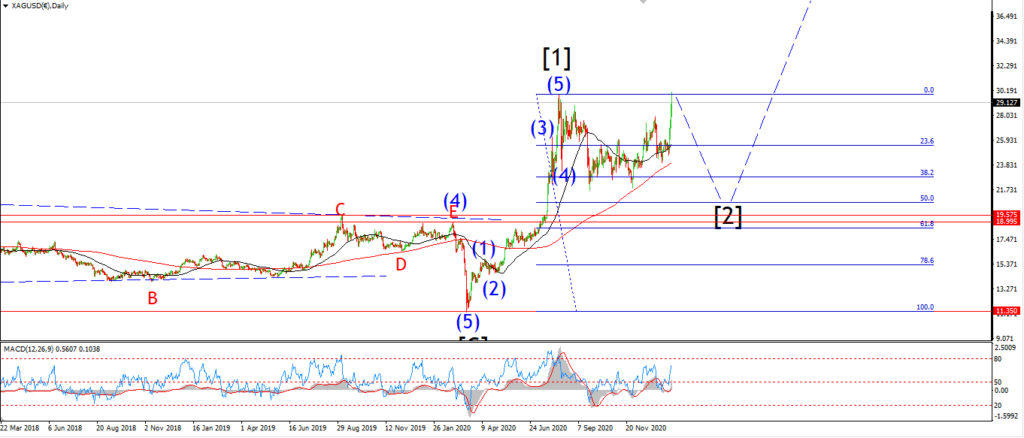
Silver is another market that is holding out until the very last moment before showing its hand.
Wave ‘ii’ is still holding the lower high below 28.20 at wave (ii) grey.
And the price has barely made any progress this week apart from hitting a wall below 28.00 and then turning lower again.
I am holding onto this bearish count as the most likely again this evening.
The momentum setup on the daily and 4hr charts are hinting at a rollover coming our way.
And I am still looking at wave (C) of [2] completing in the 20.00 area when all is said and done.
Tomorrow;
28.20 must continue to hold.
I am looking at the shelf that has been created by this weeks sideways action at 27.47.
Another drop below this level will suggest that wave ‘iii’ down is underway.
BITCOIN
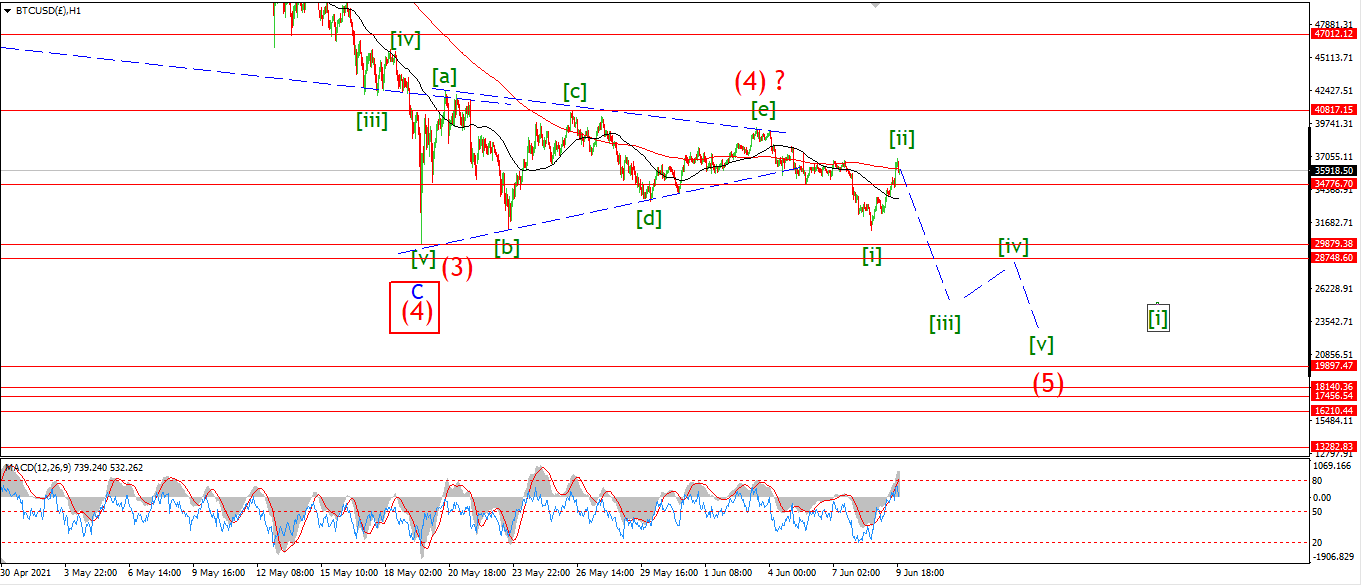
BITCOIN 1hr.
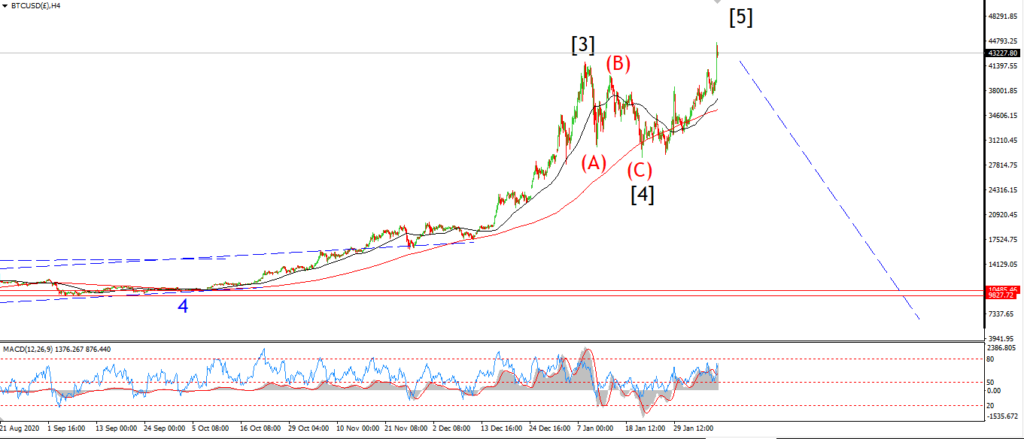
BITCOIN 4hr.
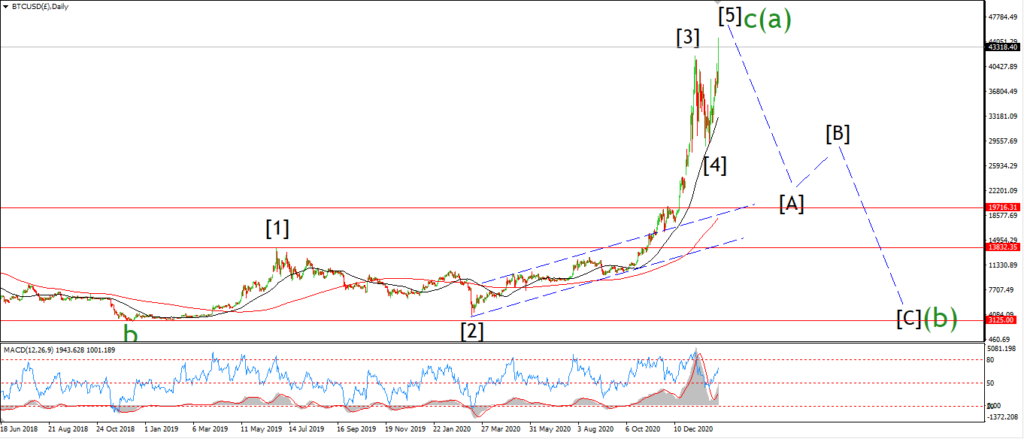
BITCOIN daily.
Topping in wave (a).
FTSE 100.
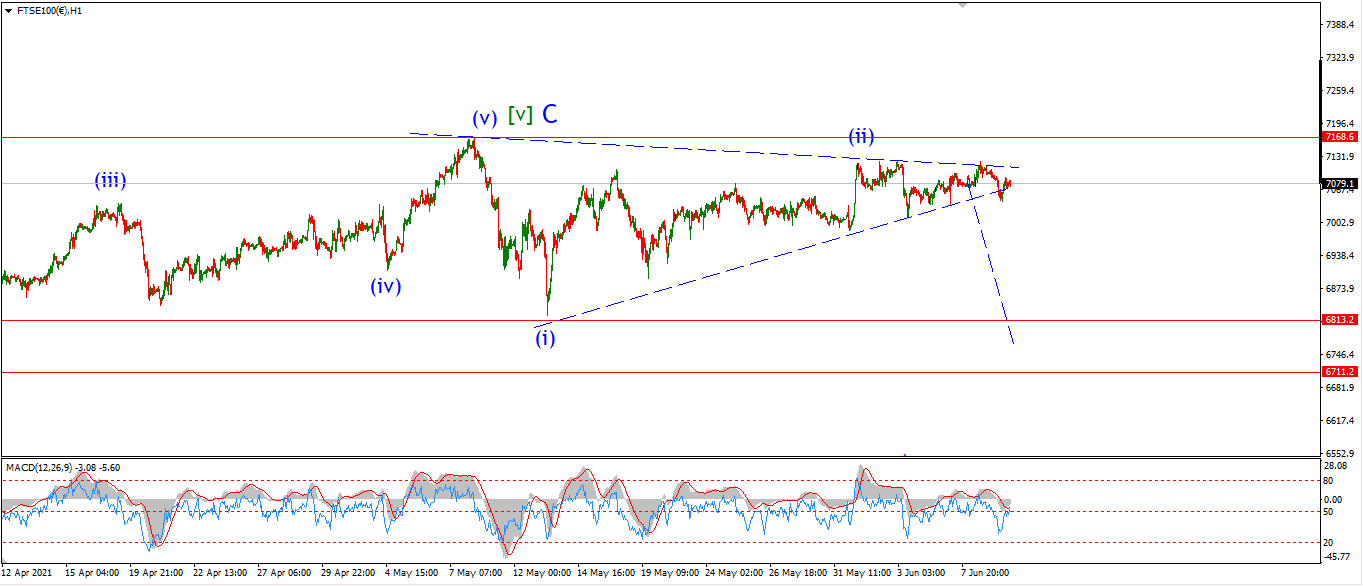
FTSE 100 1hr.
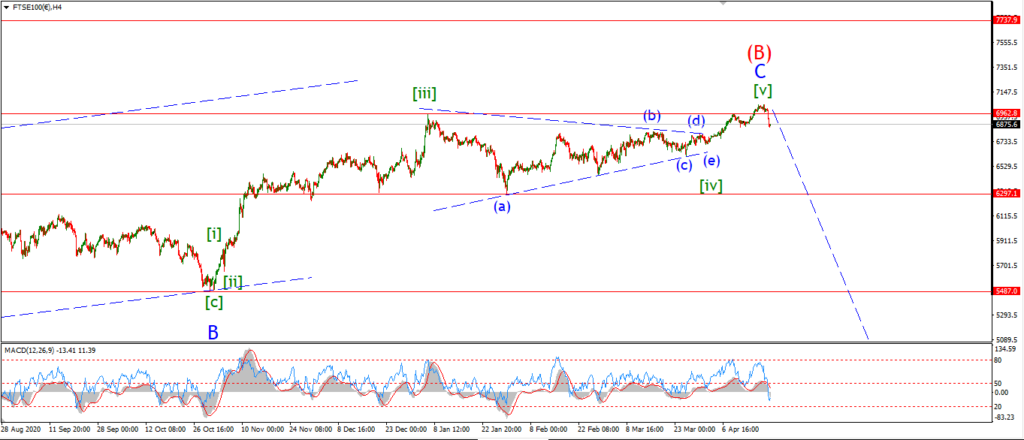
FTSE 100 4hr.

FTSE 100 daily.
Completing a fourth wave.
DAX.
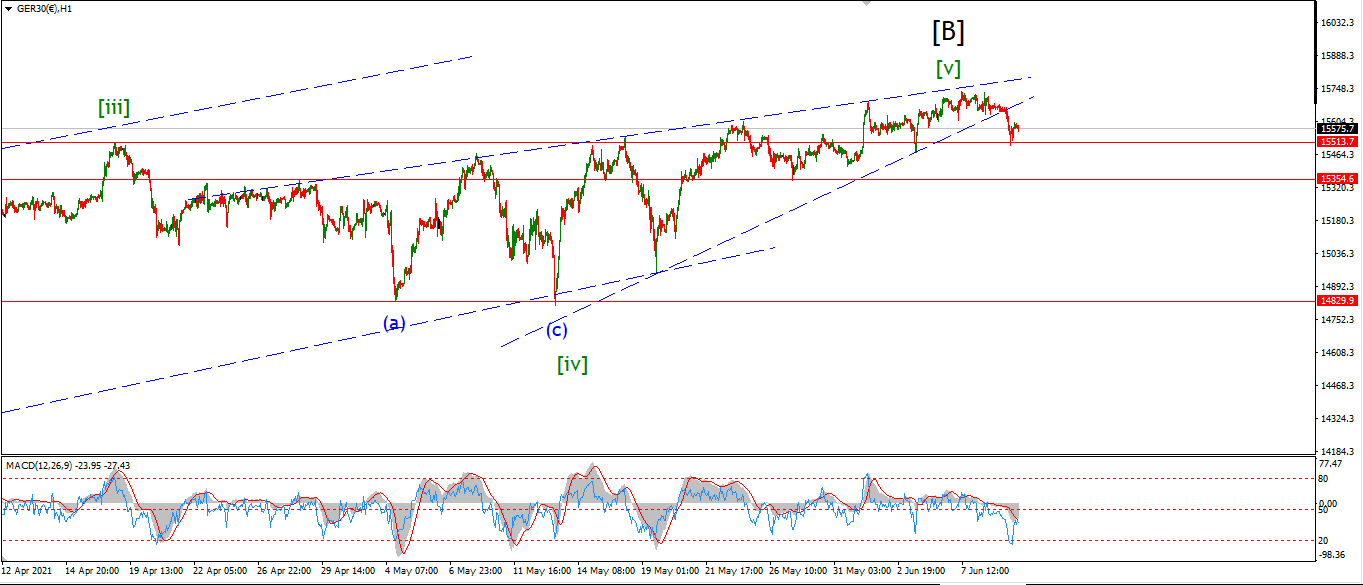
DAX 1hr
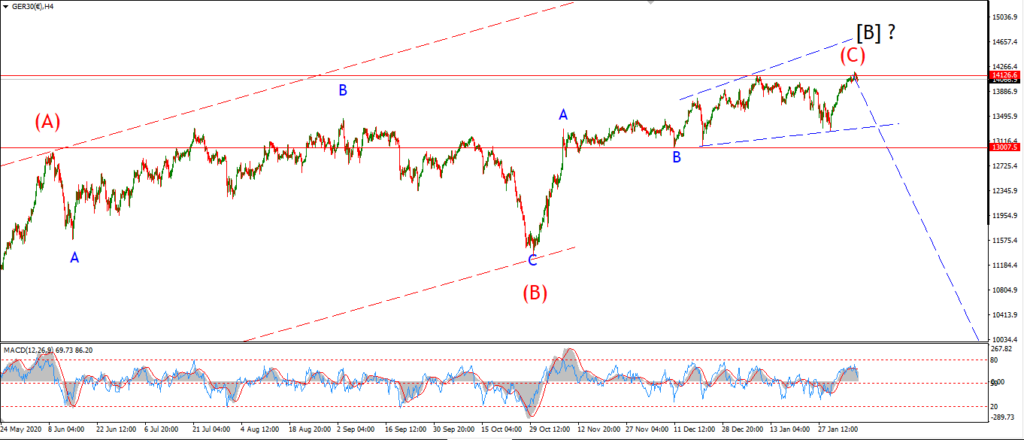
DAX 4hr
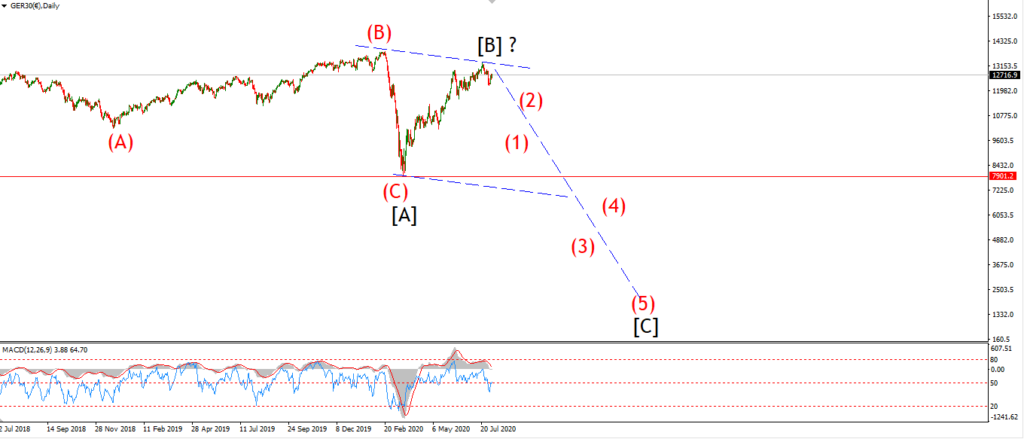
DAX daily.
Topping out in wave [B].
NASDAQ 100.
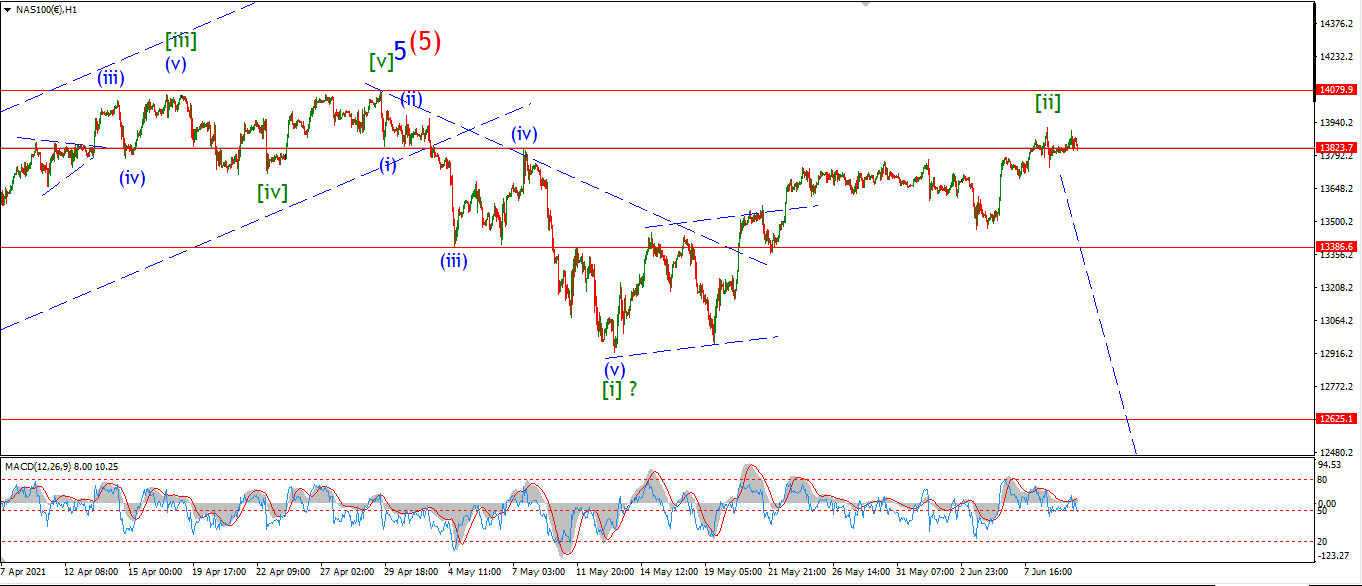
NASDAQ 1hr
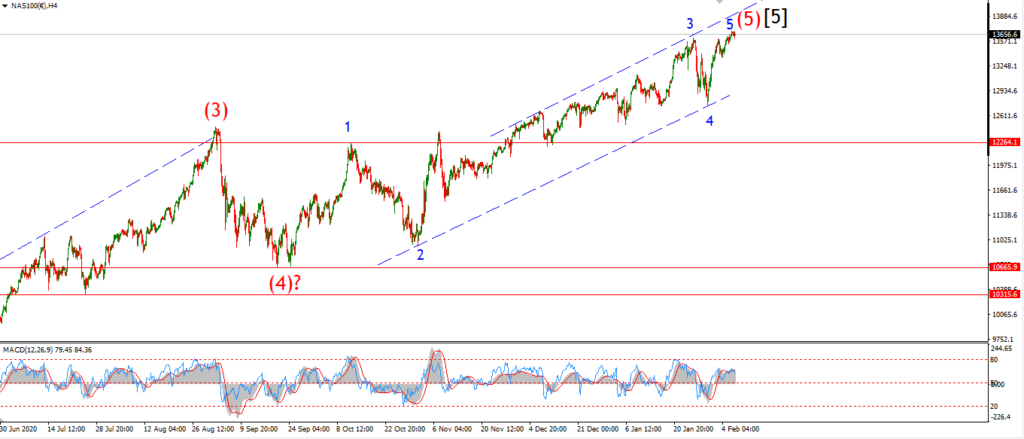
NASDAQ 4hr.
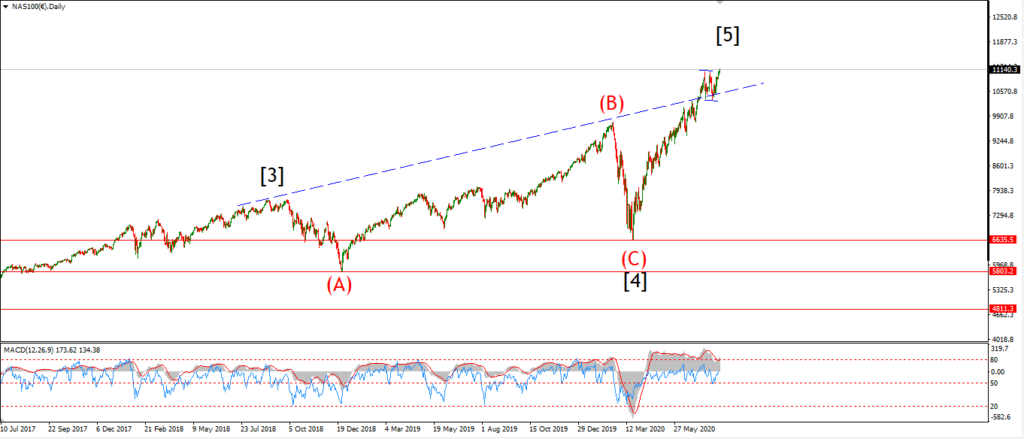
NASDAQ daily.
Topping out at all time high.