
Hello to one and all.
Its time for a few extra charts tonight.
From @Macrocharts who I really enjoy.
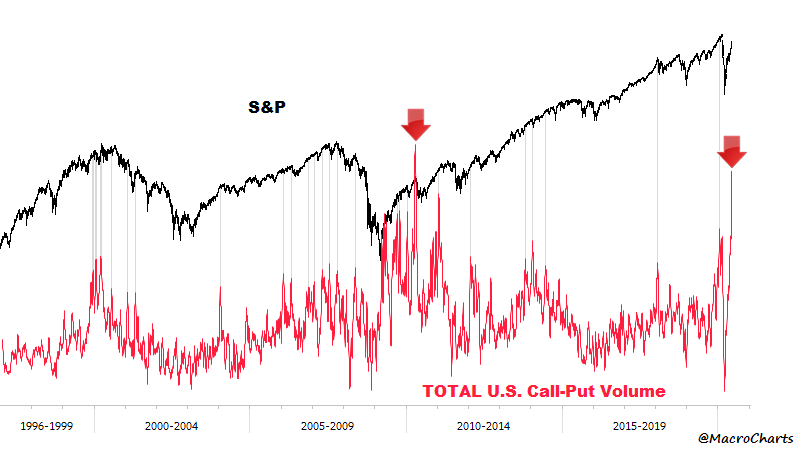
Total U.S. Call minus Put Volume. This is the 2nd largest Call-buying binge of all time – and measured from the lows, is THE biggest spike ever. At current pace, will make a new record high in less than a week.
Monitor for turn down to confirm a potential significant top.
From John Hussman:
Each line shows a notable point in history – either a bear market low such as August 1982, October 2002, and March 2009, or a bull market peak such as March 2000, October 2007, or February 2020. The line labeled “CURRENT” shows the present menu of investment options.
It should be clear that investors face among the worst set of passive investment choices in history.

And now from little ole me!
here we go.
EURUSD.
EURUSD 1hr.
EURUSD 4hr.
EURUSD daily.
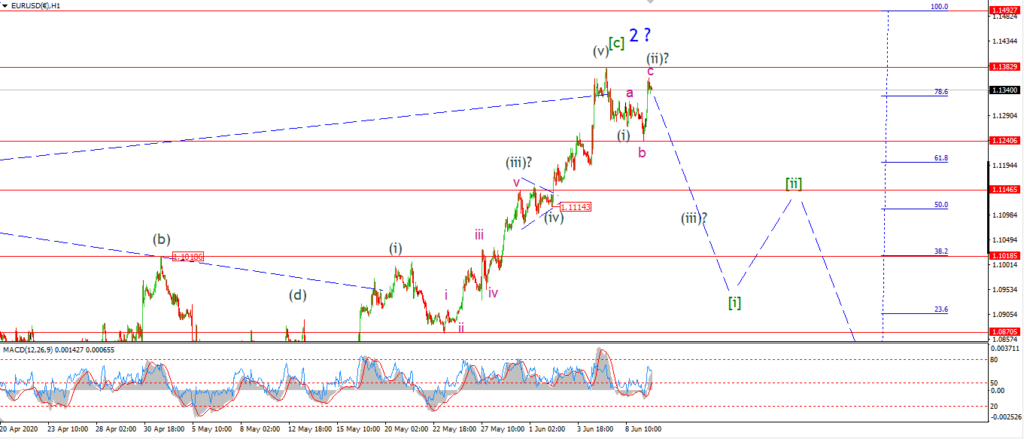
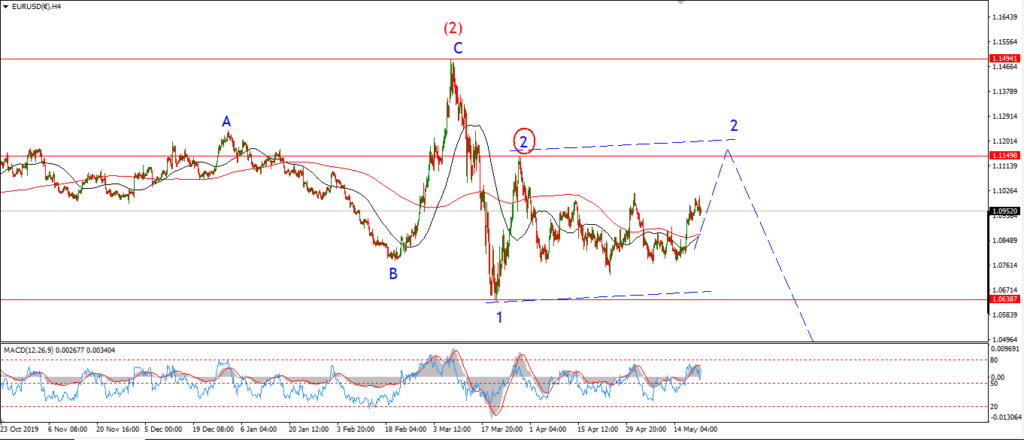
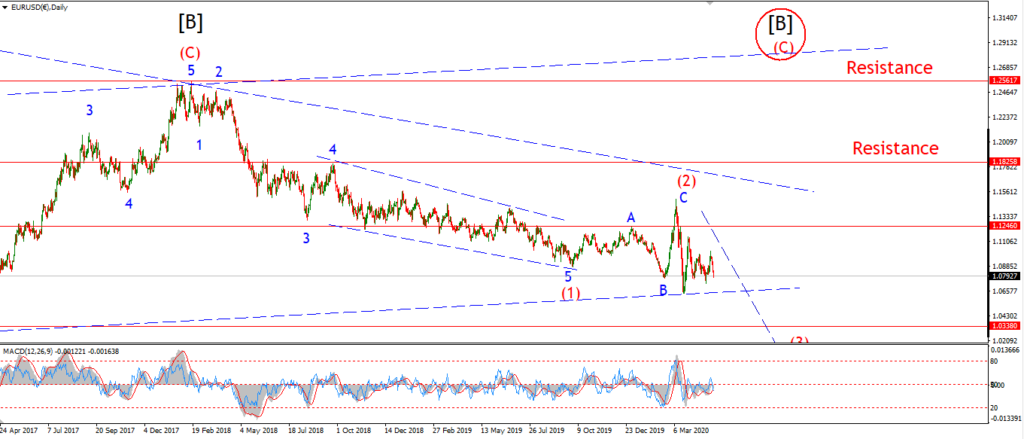
I really want to be careful now with EURUSD,
the price rallied today in a pretty impulsive fashion.
So far the price is still holding a lower high below 1.1382,
but it was a very close call today.
If I am to stick with the bearish wave count,
then we need to see a sharp reversal lower tomorrow in wave (iii).
It is possible to view wave (ii) as an expanded flat correction to the upside.
In that case todays rally is wave ‘c’ of (ii).
And wave (iii) should start immediately.
Tomorrow;
1.1492 must hold.
Watch for wave (iii) to begin.
A break of 1.1240 will signal wave wave (iii) has begun.
GBPUSD
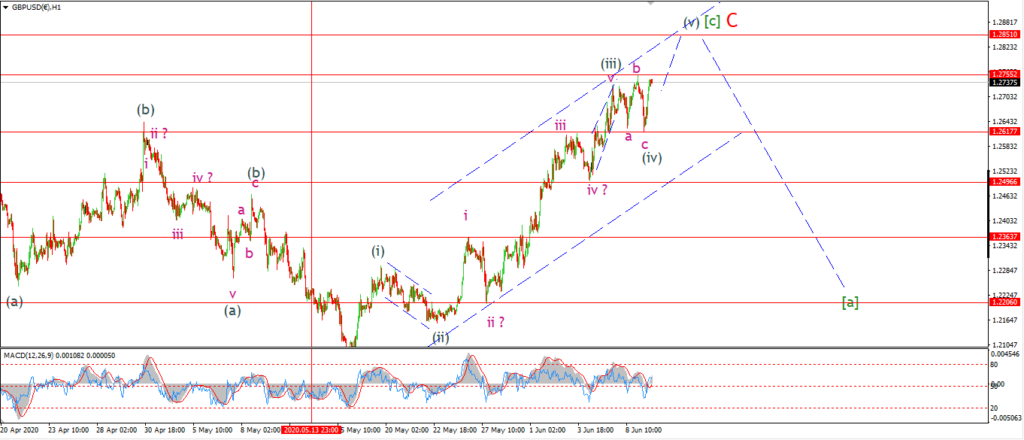
GBPUSD 1hr.
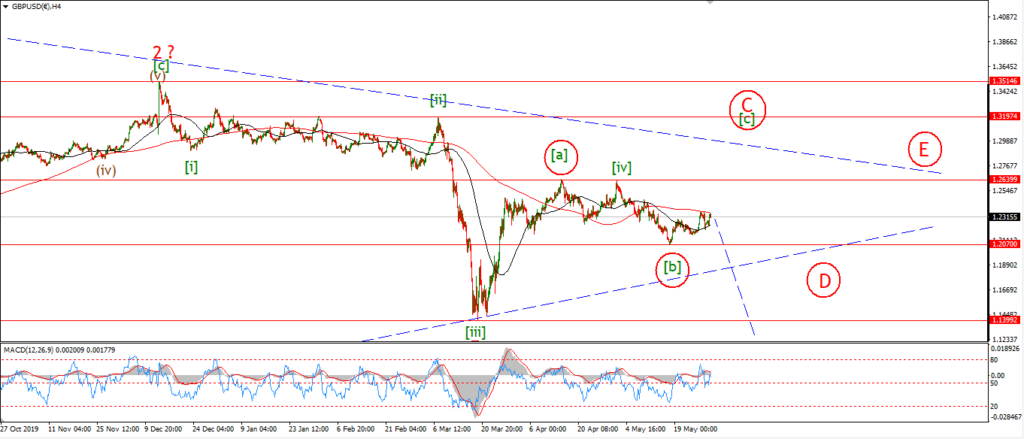
GBPUSD 4hr.
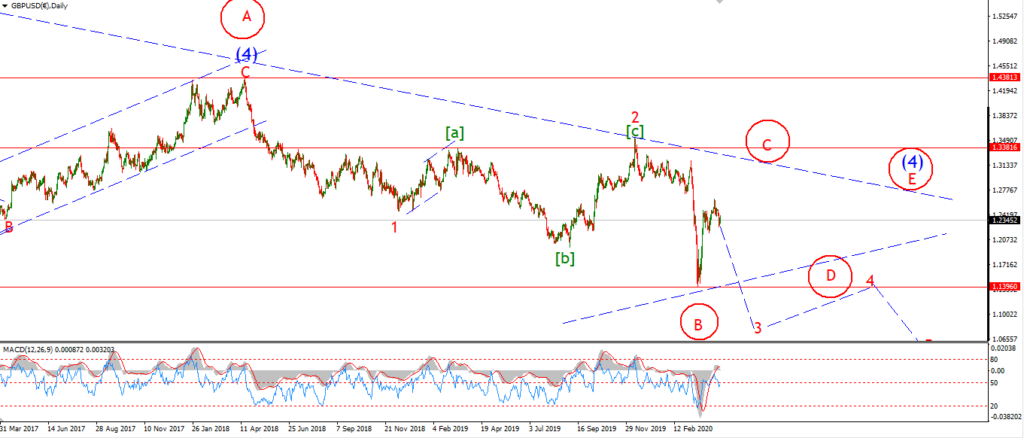
GBPUSD daily.
Cable completed an expanded flat correction in wave (iv) of [c] at todays lows.
Wave (iv) hit a low at 1.2617,
and then the rally came in off that level just stopping below the recent high this evening.
Wave (v) is expected to carry up to the upper trend channel line at about 1.2850.
Tomorrow;
1.2617 must hold as wave (v) completes,
and the minimum target for wave (v) lies at 1.2755.
USDJPY.
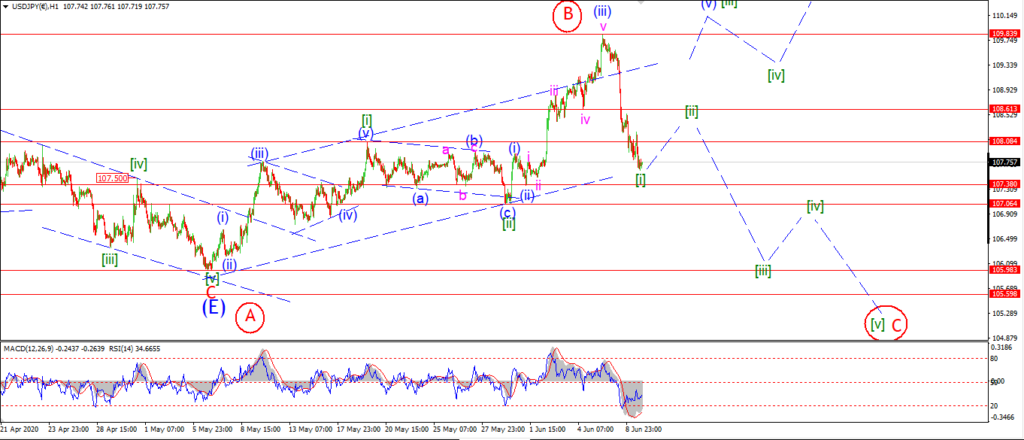
USDJPY 1hr.
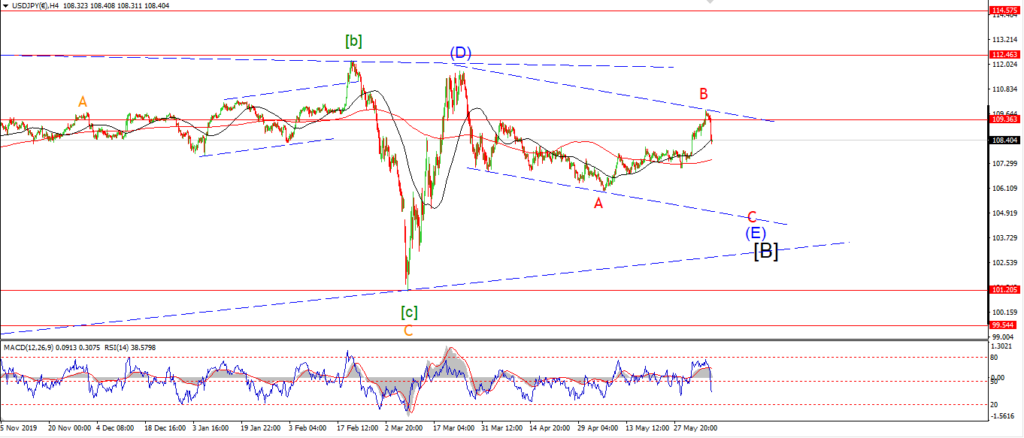
USDJPY 1hr.
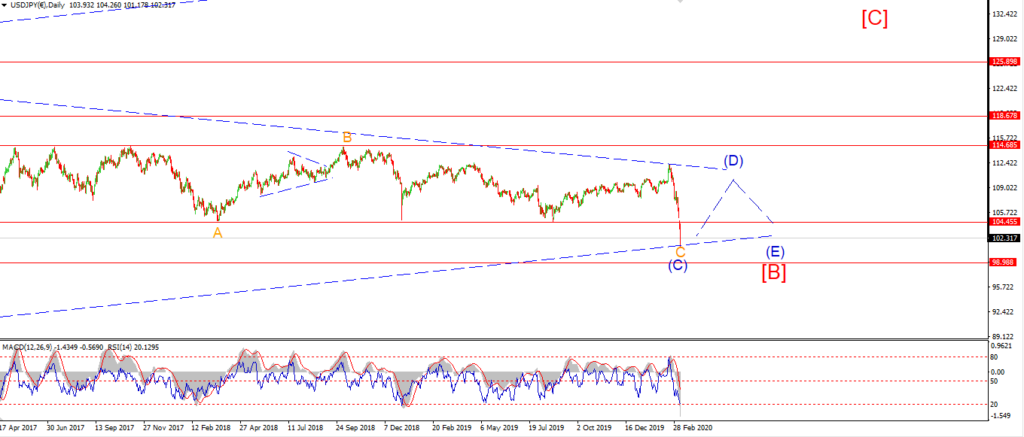
USDJPY daily.
USDJPY has now dropped off the recent high in a five wave form.
So I think to is time to seriously consider the alternate count for wave ‘C’.
This is shown circled in red on the short term chart.
The fact that we broke through 108.08 at the wave [i] high is a real hint that the rally is over for now.
So,
If the rise into the recent high is wave ‘B’ as it now looks like,
then we should fall in five waves from here in wave ‘C’ as shown.
Before confirming this wave count,
the price should create a lower high in wave [ii] first.
And the we can setup for a decline in wave [iii].
Tomorrow;
Watch for wave [ii] to correct higher from here,
and create a three wave pattern up to about 108.60 again.
Only a very strong and sustained rally will save the main wave count now.
DOW JONES.
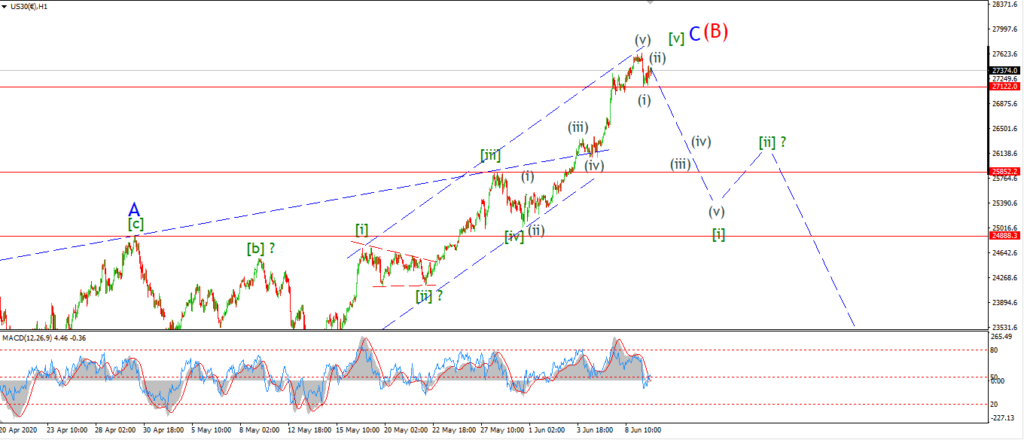
DOW 1hr.
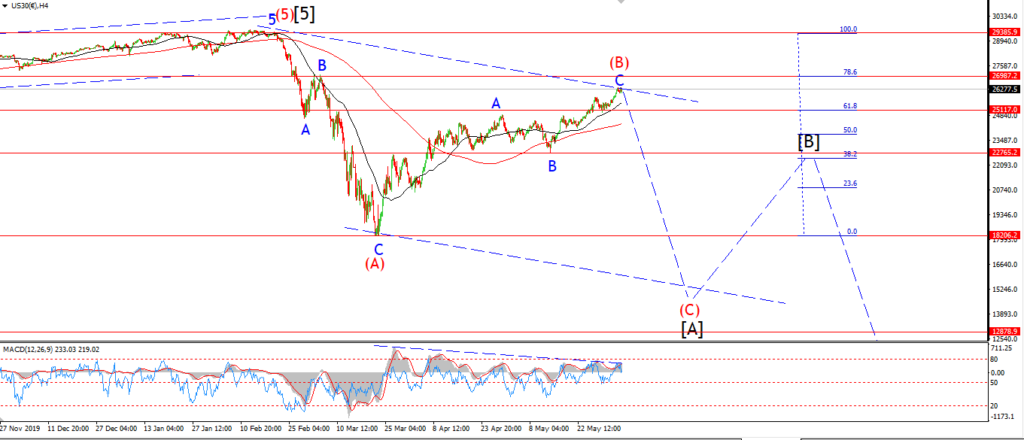
DOW 4hr
DOW daily.
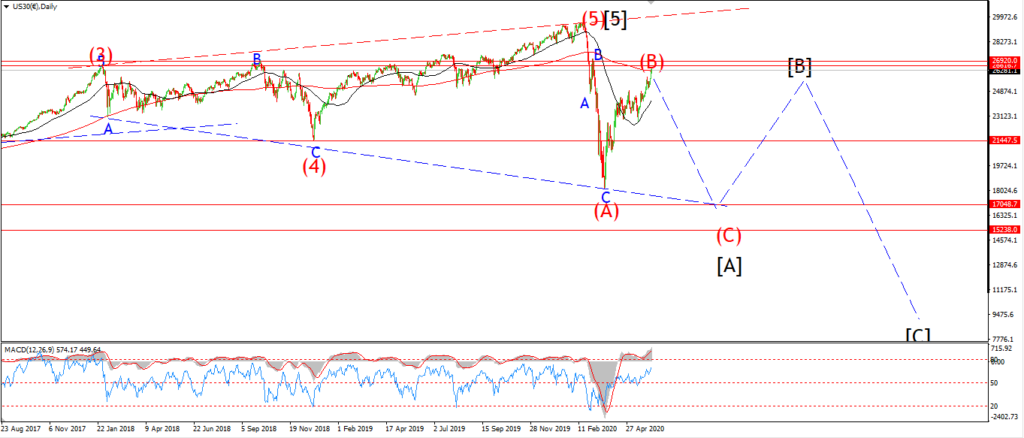
Here I am again looking at a drop off the high of a completed pattern,
and waiting for a substantial move lower to begin.
At this point it may be viewed as foolish to think that the market could ever fall again.
Ask Davey day trader!
https://twitter.com/stoolpresidente/status/1270084893691842566
The fed meets tomorrow,
so the I suspect the market is waiting to see what comes from the mouth of the supreme god of moral hazard.
There is not much I can add at this point to my outlook.
Apart from the fact that this market has given me a severe reality check over the last month.
I never thought that the madness of crowds could be this utterly overwhelmingly stupid.
But more the fool me!
And I still cant see it play out any other way right now.
Tomorrow;
Lets see if we can work our way lower off the high again.
Five waves down is the key.
GOLD
GOLD 1hr.
GOLD 4hr.
GOLD daily.
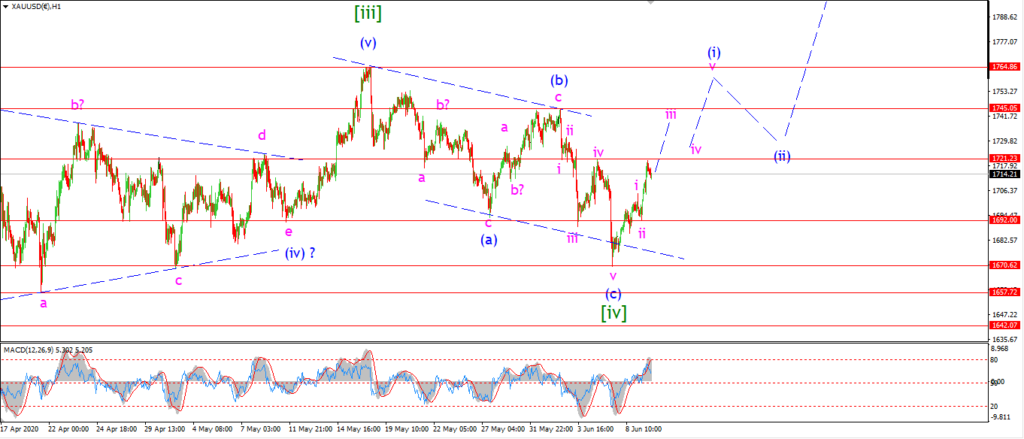
Gold is higher today but the price came to a halt just below the 1721 level,
which I have been keeping my eye on lately.
The if we see a rally back above that level tomorrow,
that will suggest wave ‘iii’ of (i) is in force.
After that,
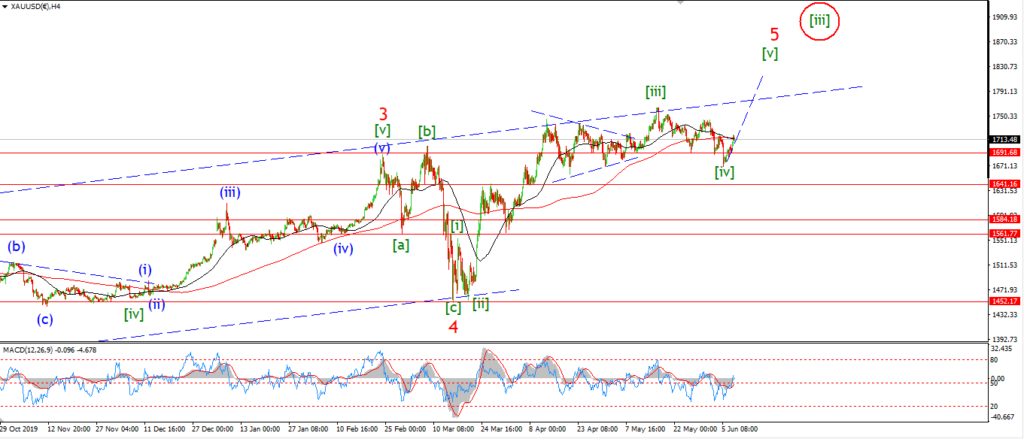
I will be expecting a break of the previous wave (b) high at 1745 again,
this should be enough to confirm the end of wave [iv] and the beginning for wave [v].
Tomorrow;
Watch for wave ‘iii’ to hold above 1700 again and continue higher towards the key resistance at 1745.
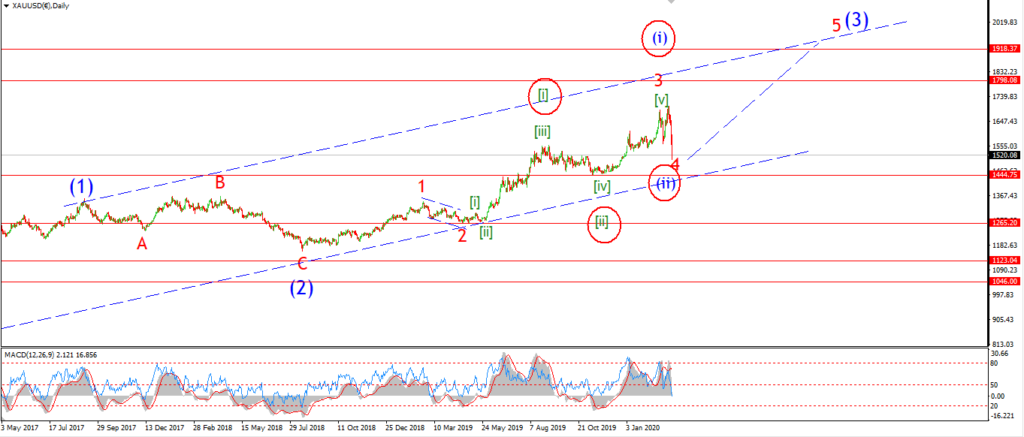
Overall I expect wave (i) should break out above 1764 again,
before turning down into wave (ii).
CRUDE OIL.
CRUDE OIL 1hr.
CRUDE OIL 4hr.
CRUDE OIL daily.
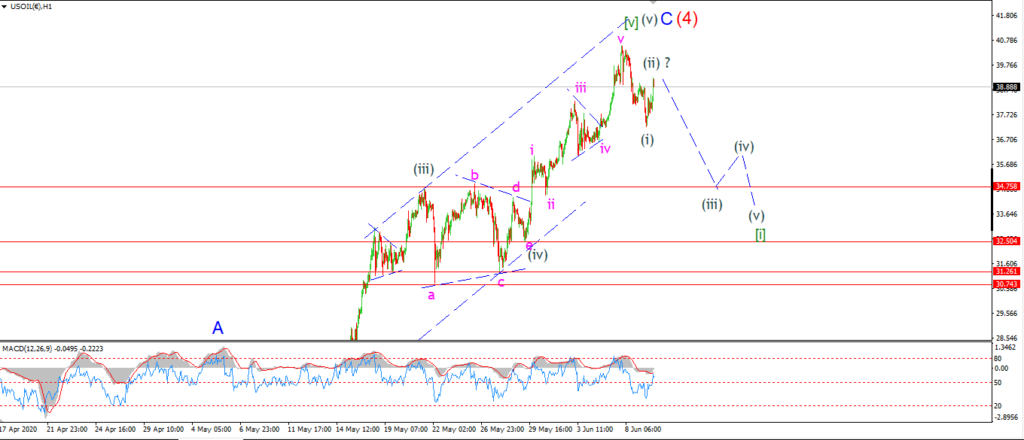
The decline off the highs looks like a completed five wave pattern lower into the early morning lows.
Crude has rallied off the lows today in three waves so far.
And the price is holding at a lower high this evening.
I have labelled this rise as wave (ii) of [i].
And this suggests we will see further declines over the coming days as wave (iii) down gets going.
Tomorrow;
As with the stock market,
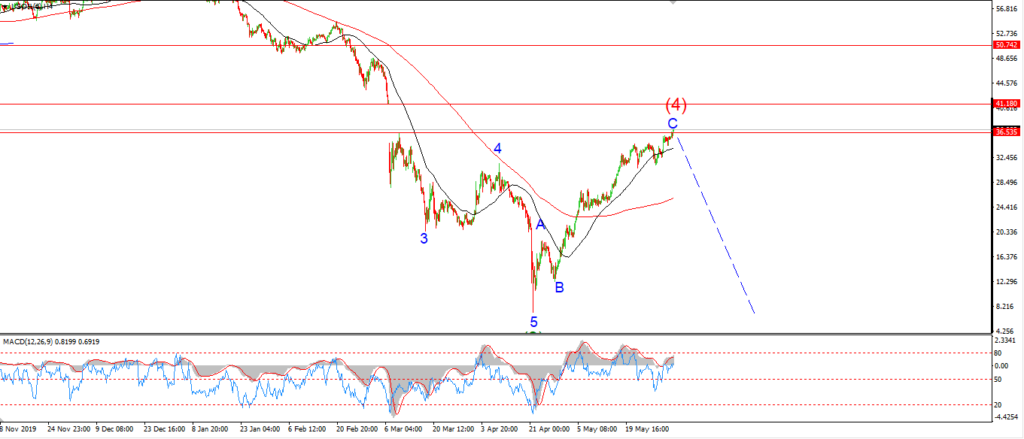
I am looking for five waves down off the high to signal that the top is in for wave (4).
Watch for this lower high to hold,
and wave (iii) down to drop back below the previous fourth wave triangle at 36.64.
The first real test will come at 34.75 where the previous left shoulder lies.
S&P 500.
S&P 500 1hr
S&P 500 4hr
S&P 500 daily.
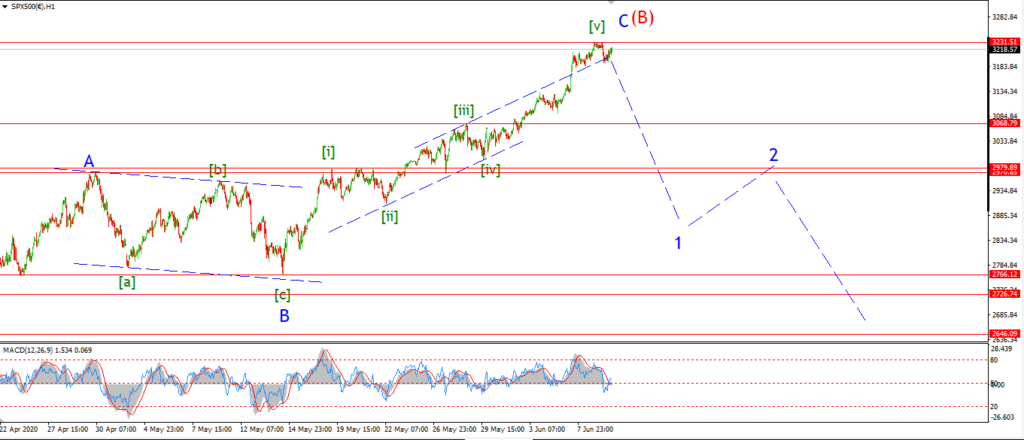
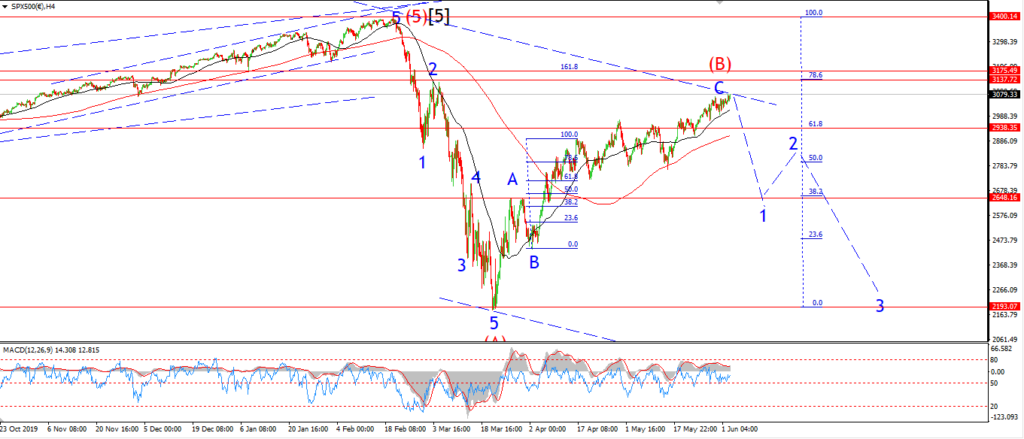
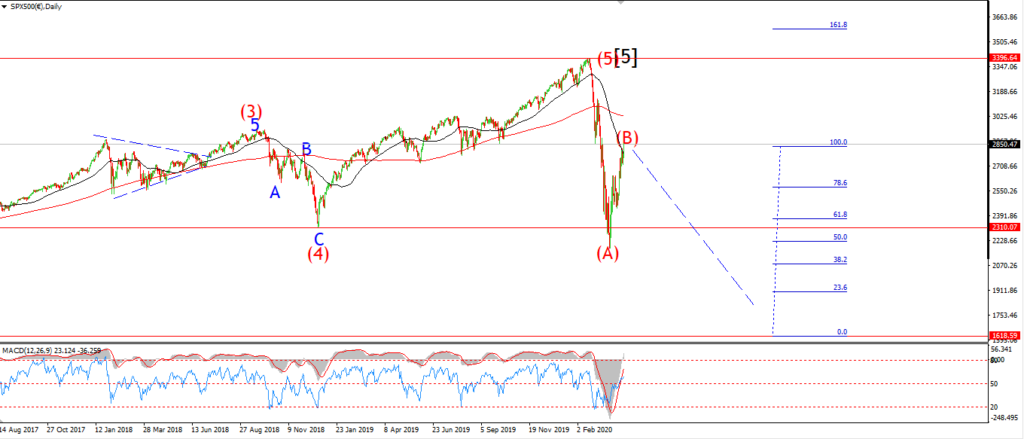
Today is a day of ‘nothing to report’ in the stock market.
I think I can only begin to get excited on the downside again if we see a break of the 3000 level again.
The wave ‘A’ high and the wave [i] high have formed a tight cluster at the 2970 handle.
A break through this ‘shoulder’ support level will add a whole lot of weight to my outlook.
And if the market breaks that level in a five wave decline,
that will go further again to confirming a top in place for wave (B).
Tomorrow;
A reversal this week would be ideal for sure.
So lets keep an eye out for that to happen over the coming days.
SILVER.
SILVER 1hr
SILVER 4hr.
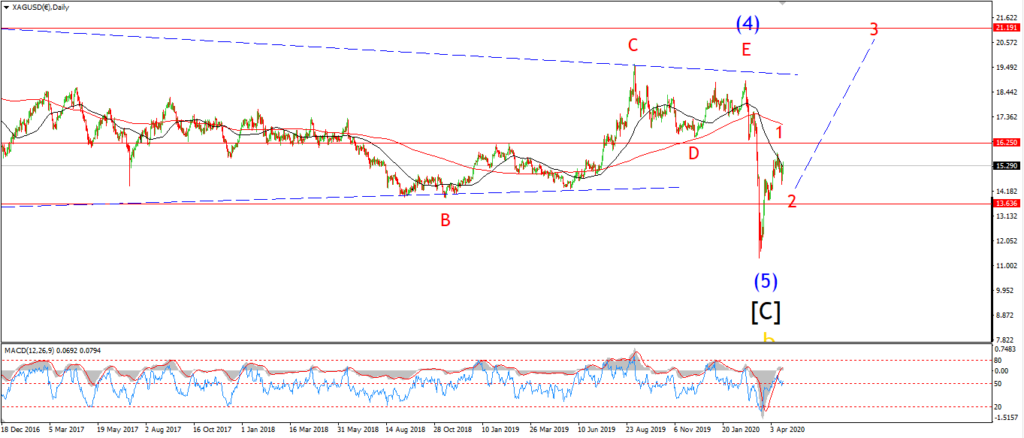
SILVER daily.
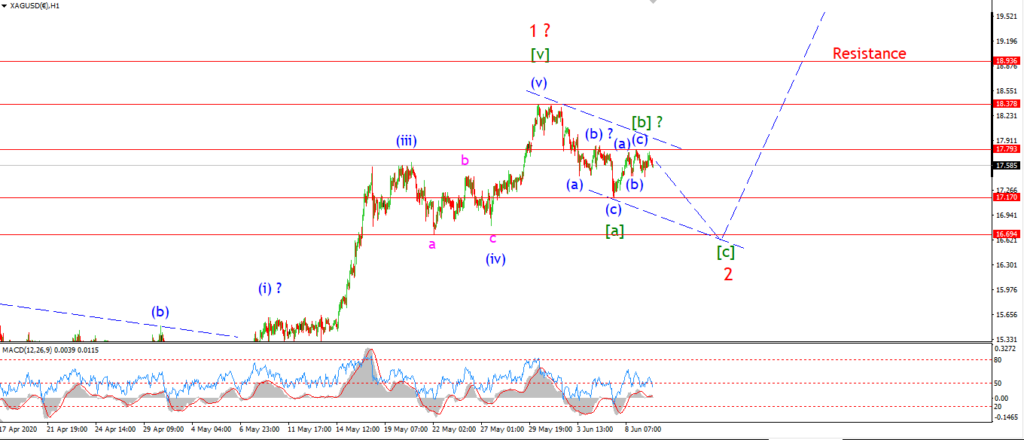
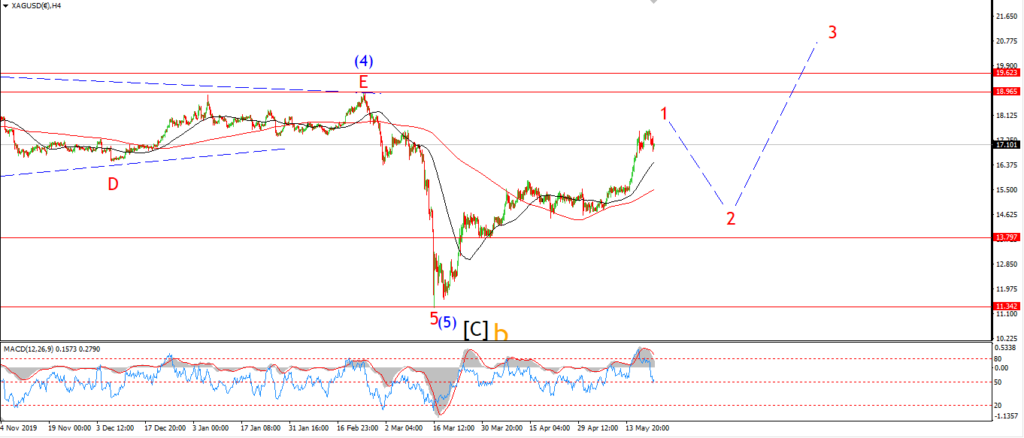
It a close call this evening,
but Silver may have completed wave (c) and wave [b] at the early highs this morning at 17.79.
the price has declined off that level again this evening to a small lower high.
So this may well be the beginning of wave [c] now in place.
I expect wave [c] to fall in five waves over the coming days.
And the initial target lies at about 16.69.
Tomorrow;
Watch for a decline back below 17.17 again to confirm wave [c] of ‘2’ has begun.