
[vc_row][vc_column][vc_separator border_width=”5″][/vc_column][/vc_row]
[vc_row][vc_column][vc_column_text]
Good evening to one and all.
We got a huge miss in the jobs numbers today which was predicted by John hussman in his latest update.
You can read that update here.
This is a harbinger for things to come have no doubt.
Every recession starts with an anomaly,
and then we will get a cascading set of anomalies to add fuel to that economic fire.
Bloomberg leads its market wrap with this tickler:
“U.S. stocks rallied for a fourth day after weak jobs data added to bets the Federal Reserve will cut rates.”
Yes stocks did rally today triggering the larger alternate count.
But no amount of rate cuts will stop this market falling in wave ‘3’ when it begins.
Remember the Fed cut rates drastically all the way down to the lows of 2009.
That did not halt the declines.
And it wont stop the market collapsing this time either.
The reason cited for the market rally over the last few years is that the economy was fantastic and warranted higher valuations.
Ok then;
How do you explain today then?
The fact that the market rallied today on bad data,
is evidence of pure double speak in action!
People are not investing now,
or even simply speculating.
They are diving into the market with reckless abandon no matter what happens.
And they will change their rationale for buying stocks,
to suit their whim on that day.
Good data – buy stocks.
Bad data – buy stocks anyway!
This is a recipe for absolute carnage!
God help us when this unravels………………………
[/vc_column_text][/vc_column][/vc_row]
[vc_row][vc_column][vc_separator border_width=”5″][/vc_column][/vc_row]
[vc_row][vc_column][vc_column_text]
EURUSD
[/vc_column_text][/vc_column][/vc_row]
[vc_row][vc_column][vc_separator border_width=”5″][/vc_column][/vc_row][vc_row][vc_column width=”2/3″][vc_custom_heading text=”1 hr” use_theme_fonts=”yes”][vc_column_text]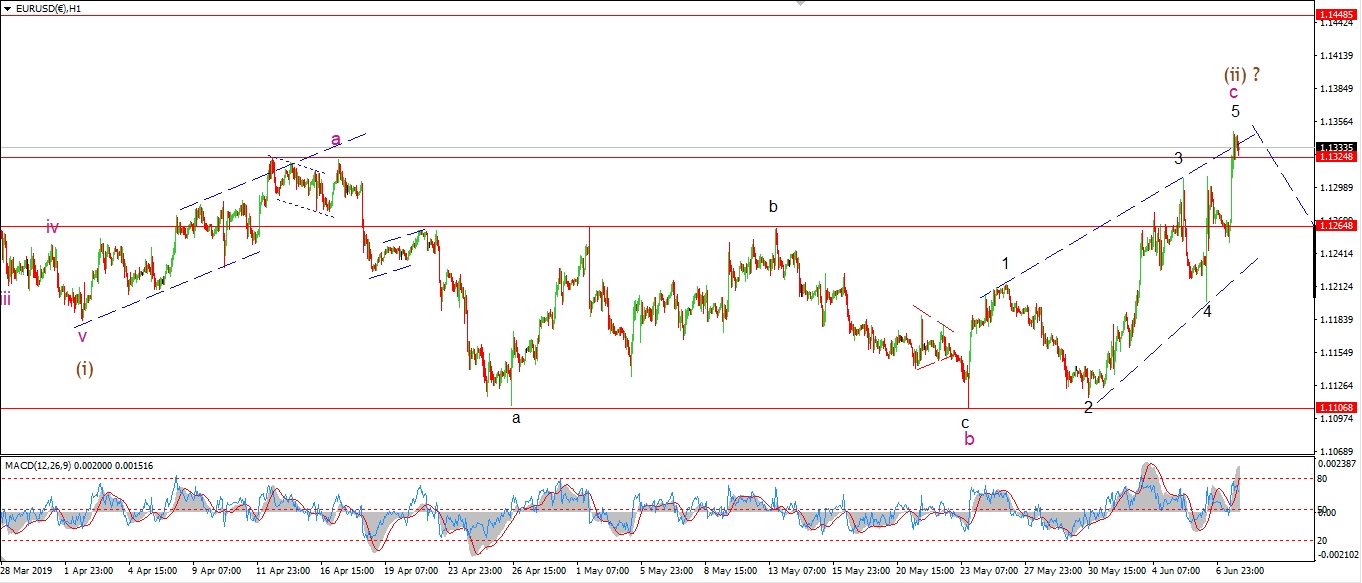 [/vc_column_text][/vc_column][vc_column width=”1/3″][vc_custom_heading text=”4 Hours” use_theme_fonts=”yes”][vc_column_text]
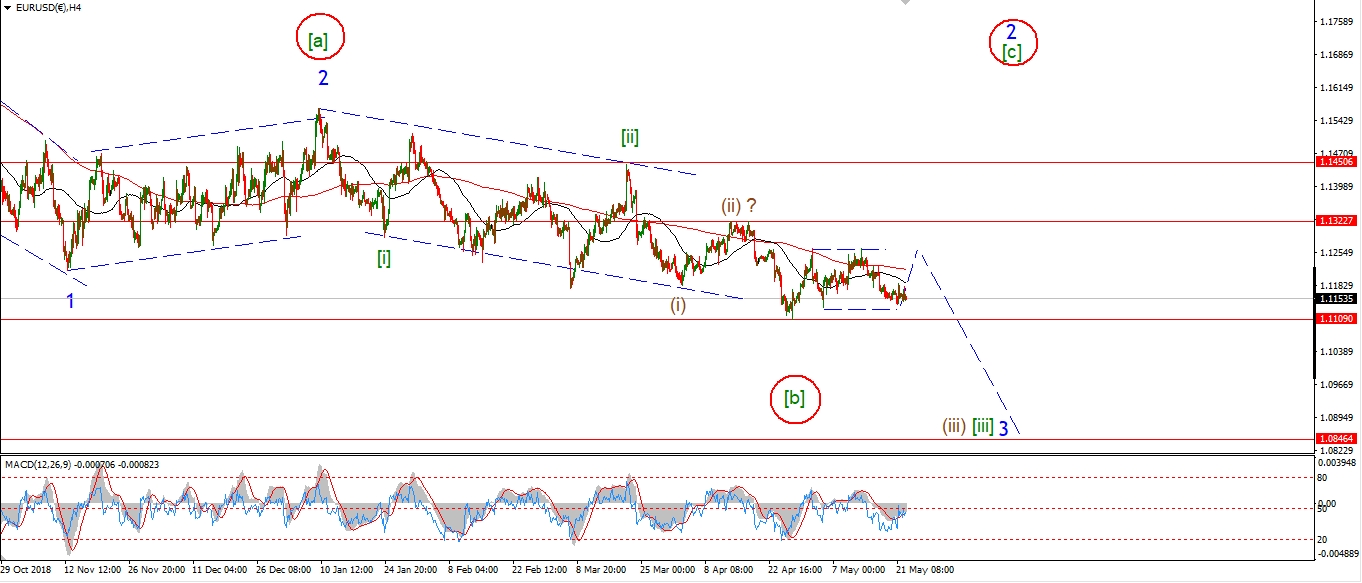 [/vc_column_text][vc_custom_heading text=”Daily” use_theme_fonts=”yes”][vc_column_text]
 [/vc_column_text][/vc_column][/vc_row]
[vc_row][vc_column][vc_column_text]
EURUSD spiked higher today to trigger the alternate count for wave (ii).
The rally off wave ‘b’ still has the form of an ending diagonal to it.
So this counts as a terminal rally in wave ‘c’ of (ii).
With wave (iii) down expected to begin soon.
Monday;
Watch for wave ‘c’ to complete below 1.1448.
Wave (iii) down will begin with a five wave decline off these highs in wave ‘i’ pink.
[/vc_column_text][/vc_column][/vc_row]
[vc_row][vc_column][vc_separator border_width=”5″][/vc_column][/vc_row][vc_row][vc_column][vc_column_text]
GBPUSD
[/vc_column_text][/vc_column][/vc_row][vc_row][vc_column][vc_separator border_width=”5″][/vc_column][/vc_row][vc_row][vc_column width=”2/3″][vc_custom_heading text=”1 hr” use_theme_fonts=”yes”][vc_column_text]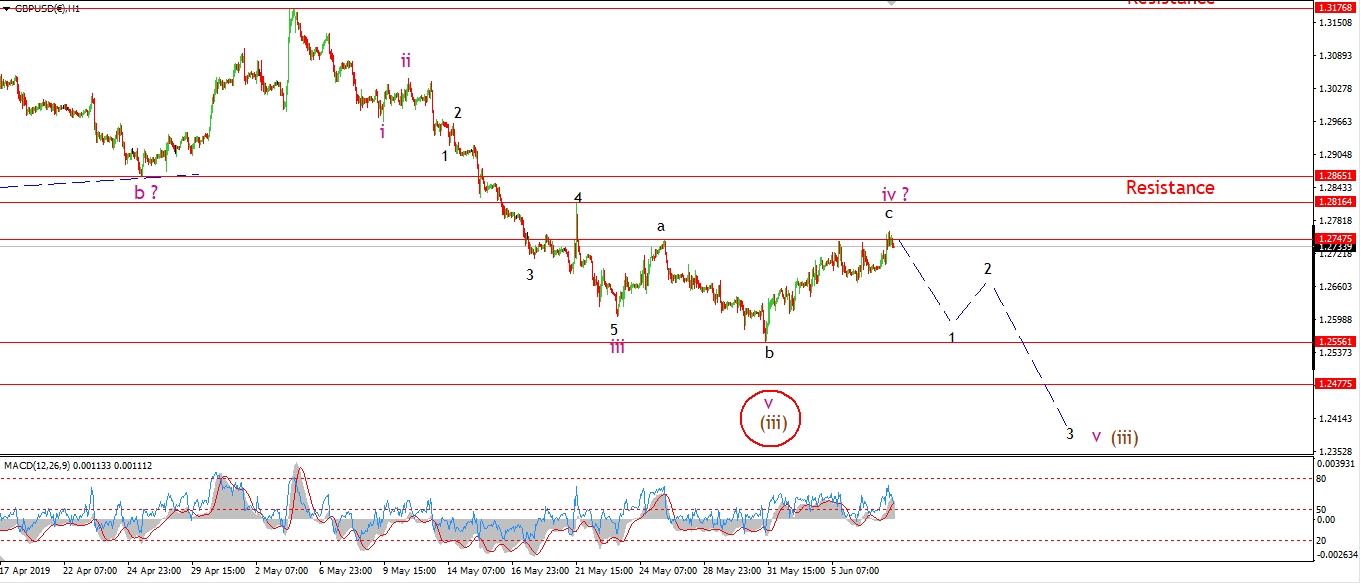 [/vc_column_text][/vc_column][vc_column width=”1/3″][vc_custom_heading text=”4 Hours” use_theme_fonts=”yes”][vc_column_text]
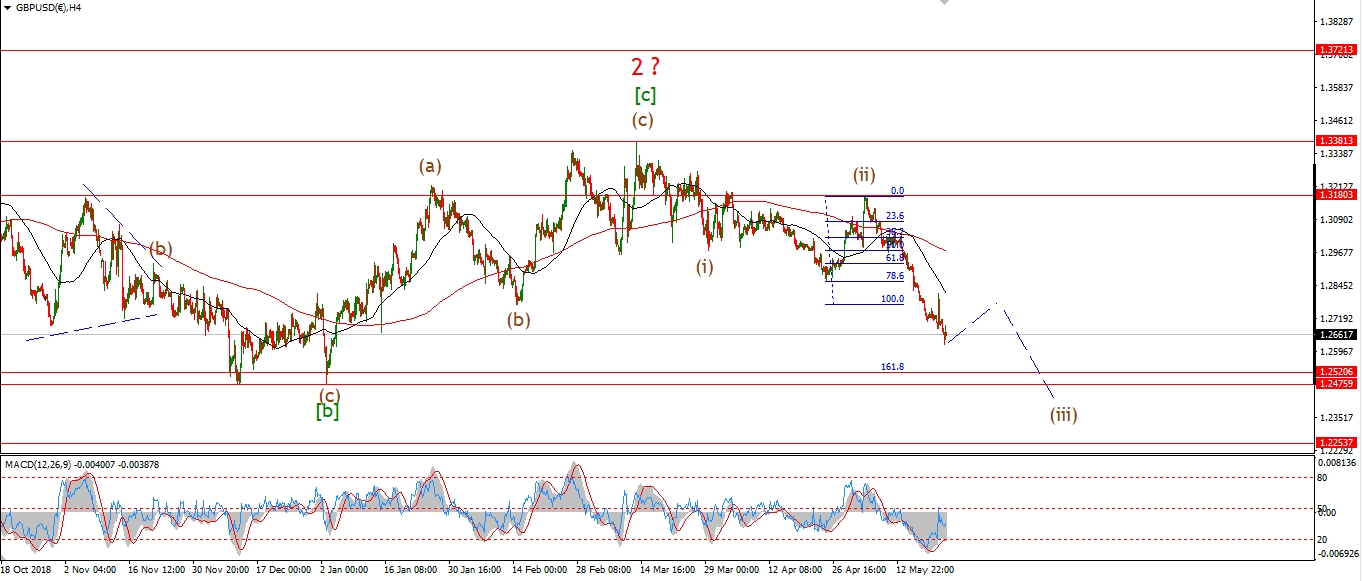 [/vc_column_text][vc_custom_heading text=”Daily” use_theme_fonts=”yes”][vc_column_text]
 [/vc_column_text][/vc_column][/vc_row]
[vc_row][vc_column][vc_column_text]
Cable pushed ever so slightly higher today,
and with that,
ruled out the triangle wave ‘iv’ scenario I was working with.
Wave ‘iv’ is now labelled as an expanded flat correction.
With the current rise in wave ‘c’ now coming to an end as the wave ‘a’ high has been broken.
Monday;
Watch for wave ‘v’ to begin with a push down towards 1.2556 again.
A break of that level will confirm wave ‘v’.
[/vc_column_text][/vc_column][/vc_row]
[vc_row][vc_column][vc_separator border_width=”5″][/vc_column][/vc_row][vc_row][vc_column][vc_column_text]
USDJPY
[/vc_column_text][/vc_column][/vc_row][vc_row][vc_column][vc_separator border_width=”5″][/vc_column][/vc_row][vc_row][vc_column width=”2/3″][vc_custom_heading text=”1 hr” use_theme_fonts=”yes”][vc_column_text]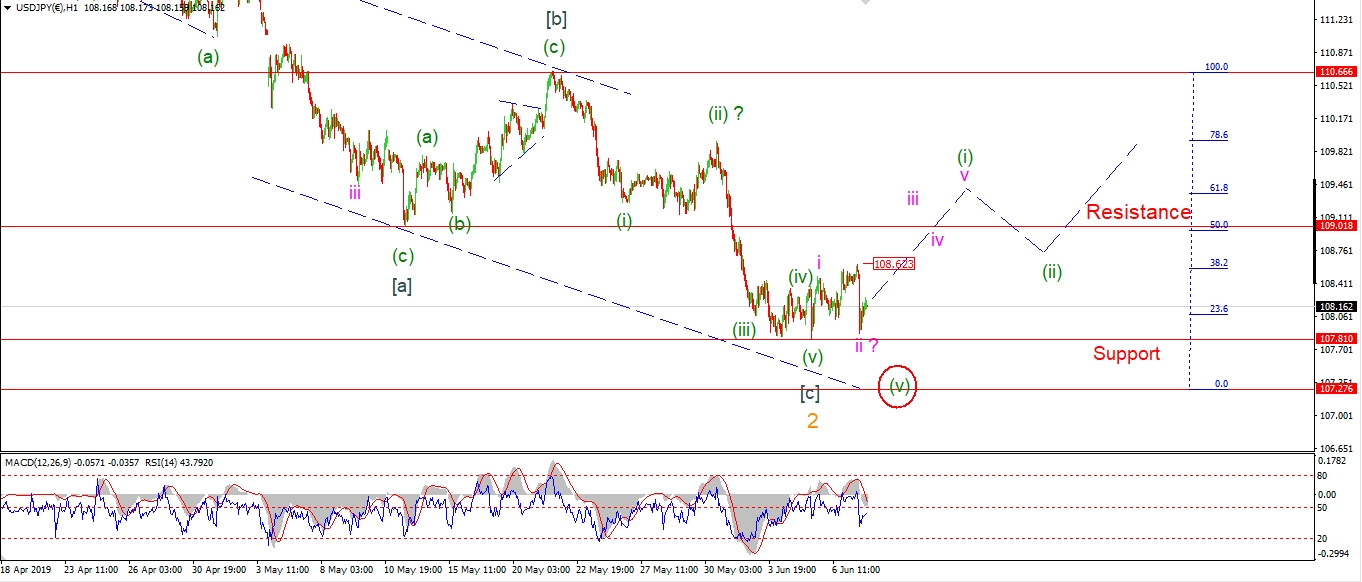 [/vc_column_text][/vc_column][vc_column width=”1/3″][vc_custom_heading text=”4 Hours” use_theme_fonts=”yes”][vc_column_text]
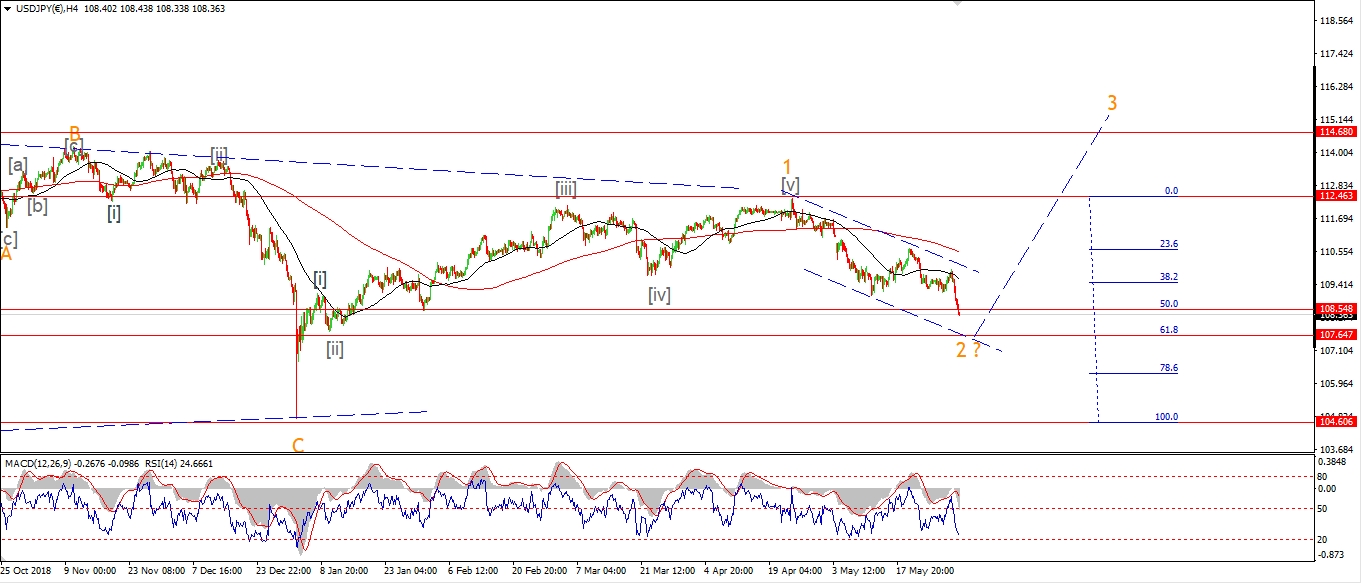 [/vc_column_text][vc_custom_heading text=”Daily” use_theme_fonts=”yes”][vc_column_text]
 [/vc_column_text][/vc_column][/vc_row]
[vc_row][vc_column][vc_column_text]
The sharp move lower this evening stopped above the initial support at 107.81 today.
The bullish count has not been invalidated.
So this still counts as a second wave correction labelled wave ‘ii’.
If the price rallies above 108.63 on Monday that will signal wave ‘iii’ of (i) has begun.
A break of 107.81 will mean that wave [c] has yet to complete.
But even that decline should end at about 107.26 and then turn higher into wave (i).
For the moment,
I will stick with the bullish setup in play.
Monday;
Watch for wave ‘iii’ of (i) to rally above 108.62.
[/vc_column_text][/vc_column][/vc_row]
[vc_row][vc_column][vc_separator border_width=”5″][/vc_column][/vc_row][vc_row][vc_column][vc_column_text]
DOW JONES INDUSTRIALS
[/vc_column_text][/vc_column][/vc_row][vc_row][vc_column][vc_separator border_width=”5″][/vc_column][/vc_row][vc_row][vc_column width=”2/3″][vc_custom_heading text=”1 hr” use_theme_fonts=”yes”][vc_column_text]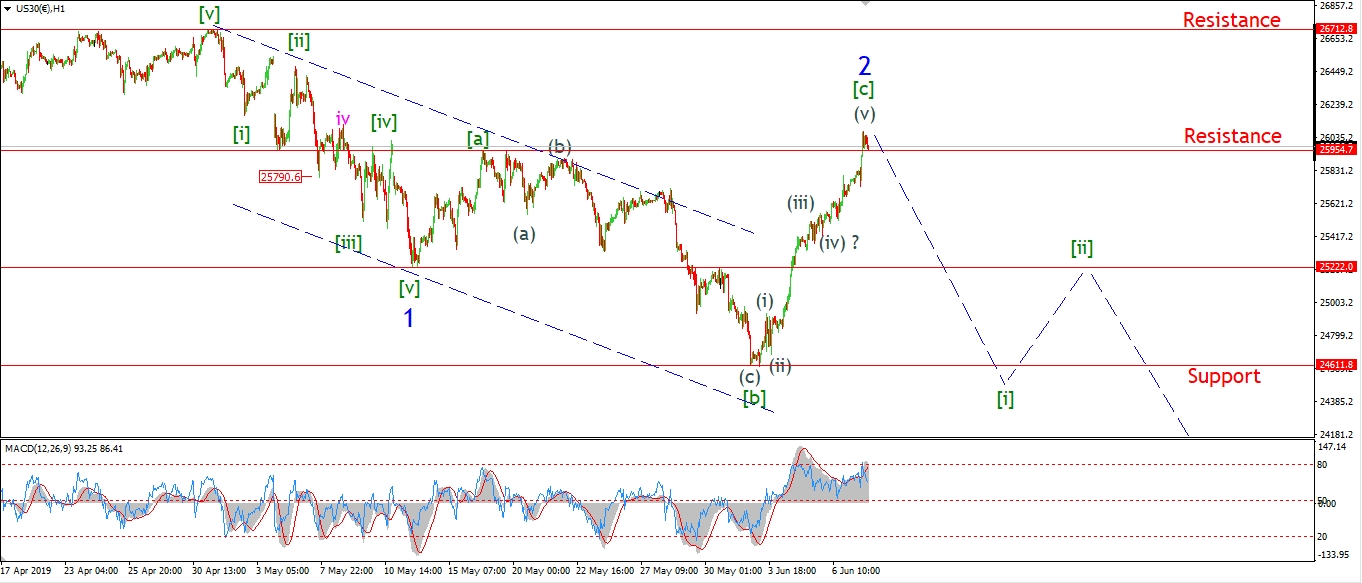 [/vc_column_text][/vc_column][vc_column width=”1/3″][vc_custom_heading text=”4 Hours” use_theme_fonts=”yes”][vc_column_text]
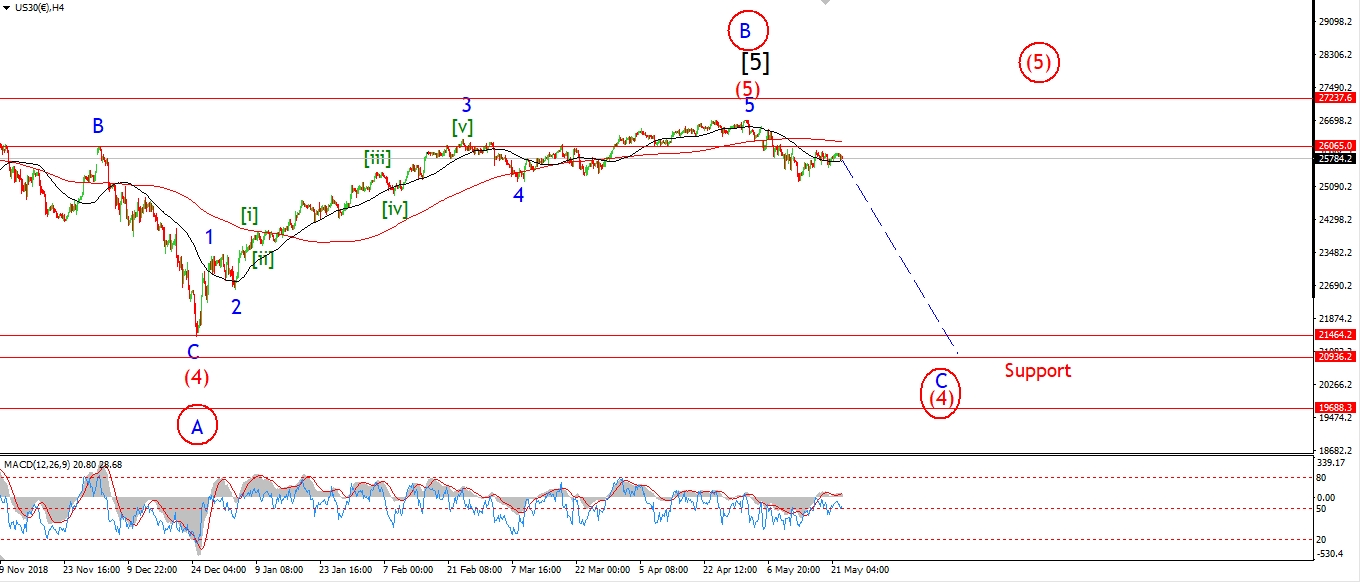 [/vc_column_text][vc_custom_heading text=”Daily” use_theme_fonts=”yes”][vc_column_text]
 [/vc_column_text][/vc_column][/vc_row]
[vc_row][vc_column][vc_column_text]
The first alternate count has been triggered today with a continuation of the five wave rally.
Wave ‘2’ blue now counts as an expanded flat correction.
And the latest rally is labelled as wave [c] of ‘2’.
We should see an early selloff as momentum in wave [c] is dying off now.
And the initial decline off these highs should trace out a five wave structure.
the next leg down should occur in wave ‘3’.
And this wave has a serious bearish potential given the obscene optimism now on display.
Monday;
Watch for an initial five wave decline to develop early next week.
A break of 25222 again will signal that wave ‘3’ down has begun.
[/vc_column_text][/vc_column][/vc_row]
[vc_row][vc_column][vc_separator border_width=”5″][/vc_column][/vc_row][vc_row][vc_column][vc_column_text]
GOLD
[/vc_column_text][/vc_column][/vc_row][vc_row][vc_column][vc_separator border_width=”5″][/vc_column][/vc_row][vc_row][vc_column width=”2/3″][vc_custom_heading text=”1 hr” use_theme_fonts=”yes”][vc_column_text]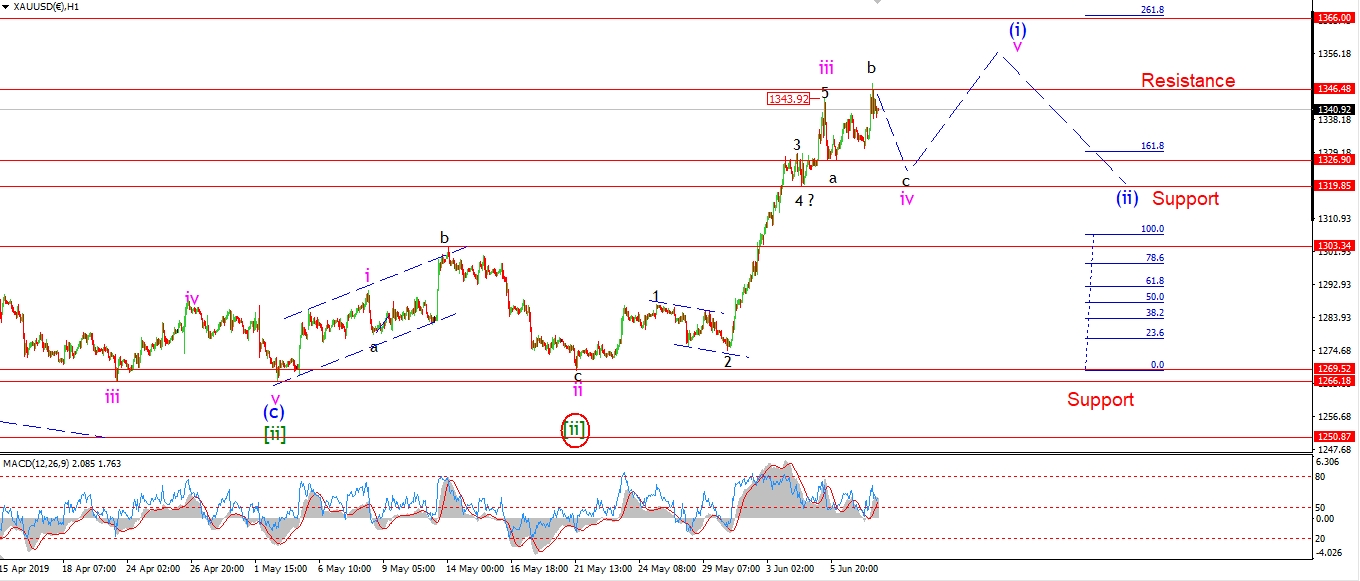 [/vc_column_text][/vc_column][vc_column width=”1/3″][vc_custom_heading text=”4 Hours” use_theme_fonts=”yes”][vc_column_text]
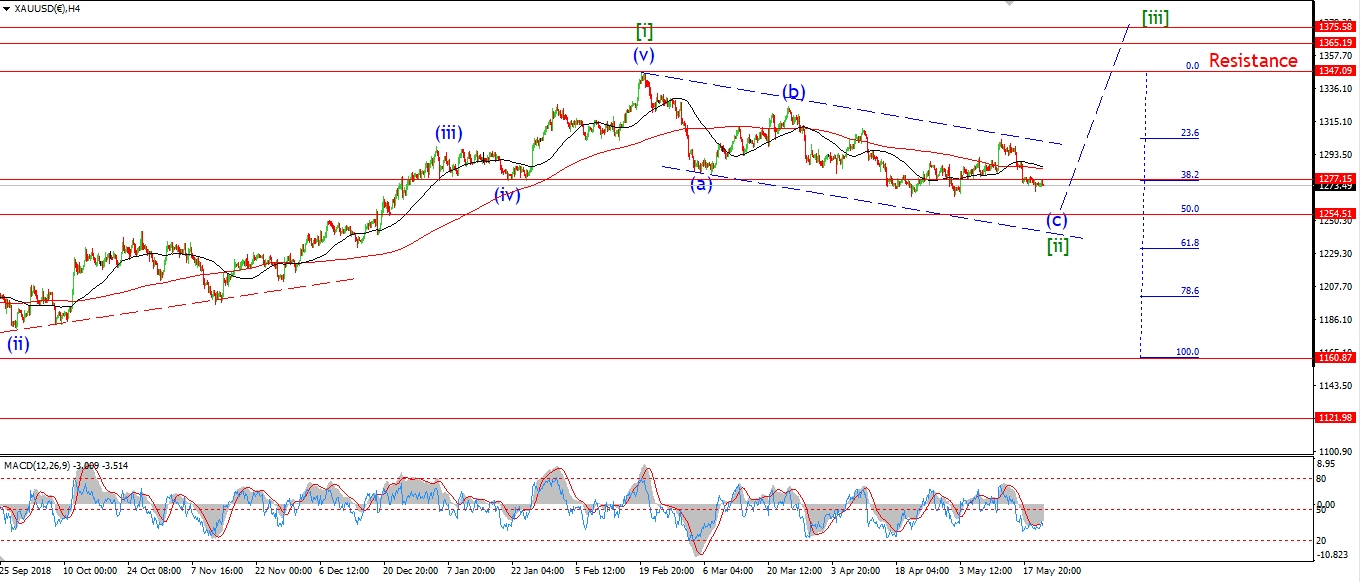 [/vc_column_text][vc_custom_heading text=”Daily” use_theme_fonts=”yes”][vc_column_text]
 [/vc_column_text][/vc_column][/vc_row]
[vc_row][vc_column][vc_column_text]
Golds rally today is labelled wave ‘b’ of ‘iv’.
The rise off wave ‘a’ did break to a new high today,
but it is in a clear three wave structure.
So the new high today classifies wave ‘iv’ as an expanded flat correction.
Wave ‘c’ of ‘iv’ should decline below 1326 again to complete the correction.
The price is declining again this evening,
this may be the start of wave ‘c’.
Monday;
watch for wave ‘c’ to find support between 1326 and 1319.
Next week should bring a further rally in wave ‘v’.
[/vc_column_text][/vc_column][/vc_row]
[vc_row][vc_column][vc_separator border_width=”5″][/vc_column][/vc_row][vc_row][vc_column][vc_column_text]
U.S CRUDE OIL
[/vc_column_text][/vc_column][/vc_row][vc_row][vc_column][vc_separator border_width=”5″][/vc_column][/vc_row][vc_row][vc_column width=”2/3″][vc_custom_heading text=”1 hr” use_theme_fonts=”yes”][vc_column_text]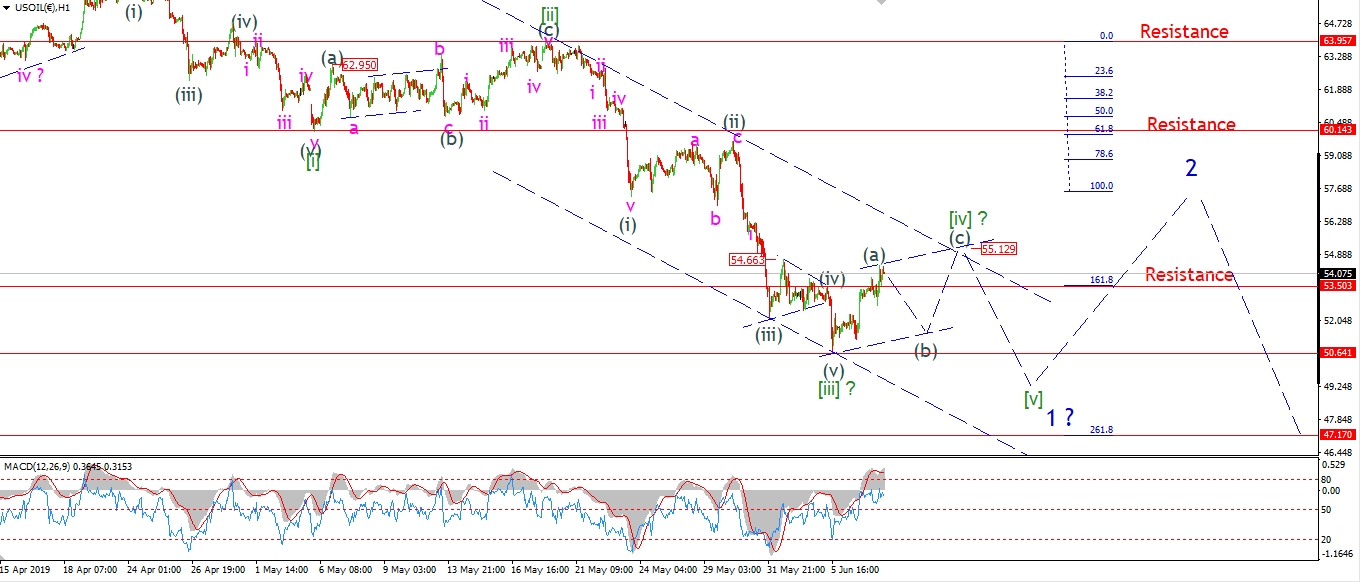 [/vc_column_text][/vc_column][vc_column width=”1/3″][vc_custom_heading text=”4 Hours” use_theme_fonts=”yes”][vc_column_text]
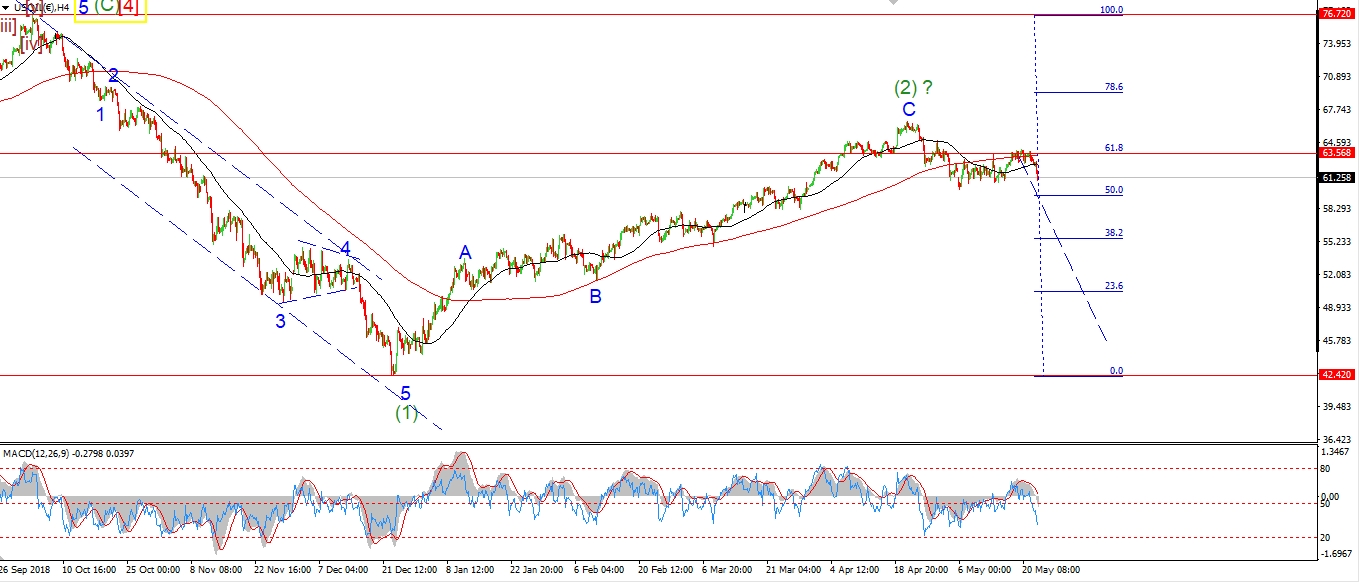 [/vc_column_text][vc_custom_heading text=”Daily” use_theme_fonts=”yes”][vc_column_text]
 [/vc_column_text][/vc_column][/vc_row]
[vc_row][vc_column][vc_column_text]
Crude has risen off the wave [iii] low in a five wave form so far.
This rally is labelled as wave (a) of [iv].
And the five wave form suggests wave [iv] will be a simple zigzag 5,3,5 structure.
The overall correction in wave ‘iv’ should trace out three waves.
Monday;
Watch for wave (b) to decline in three waves early next week and create a higher low.
Wave [iv] should complete by the end of next week.
[/vc_column_text][/vc_column][/vc_row]
[vc_row][vc_column][vc_separator border_width=”5″][/vc_column][/vc_row][vc_row][vc_column][vc_column_text]
US 10 yr Treasuries.
[/vc_column_text][/vc_column][/vc_row][vc_row][vc_column][vc_separator border_width=”5″][/vc_column][/vc_row][vc_row][vc_column width=”2/3″][vc_custom_heading text=”1 hr” use_theme_fonts=”yes”][vc_column_text]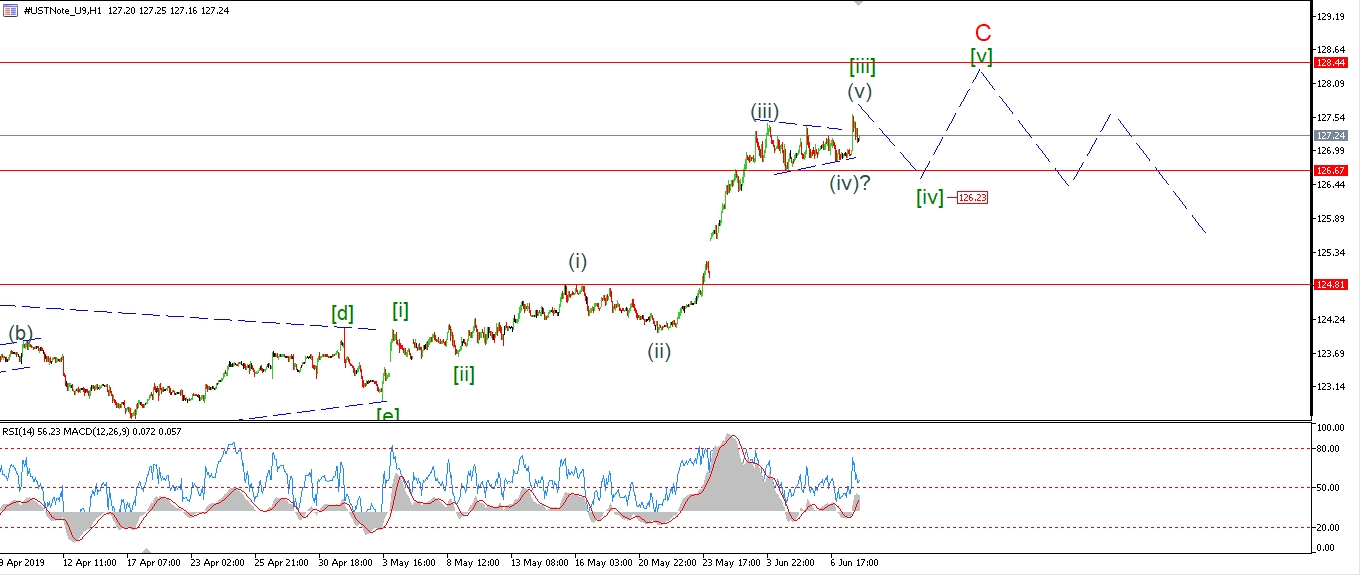 [/vc_column_text][/vc_column][vc_column width=”1/3″][vc_custom_heading text=”4 Hours” use_theme_fonts=”yes”][vc_column_text]
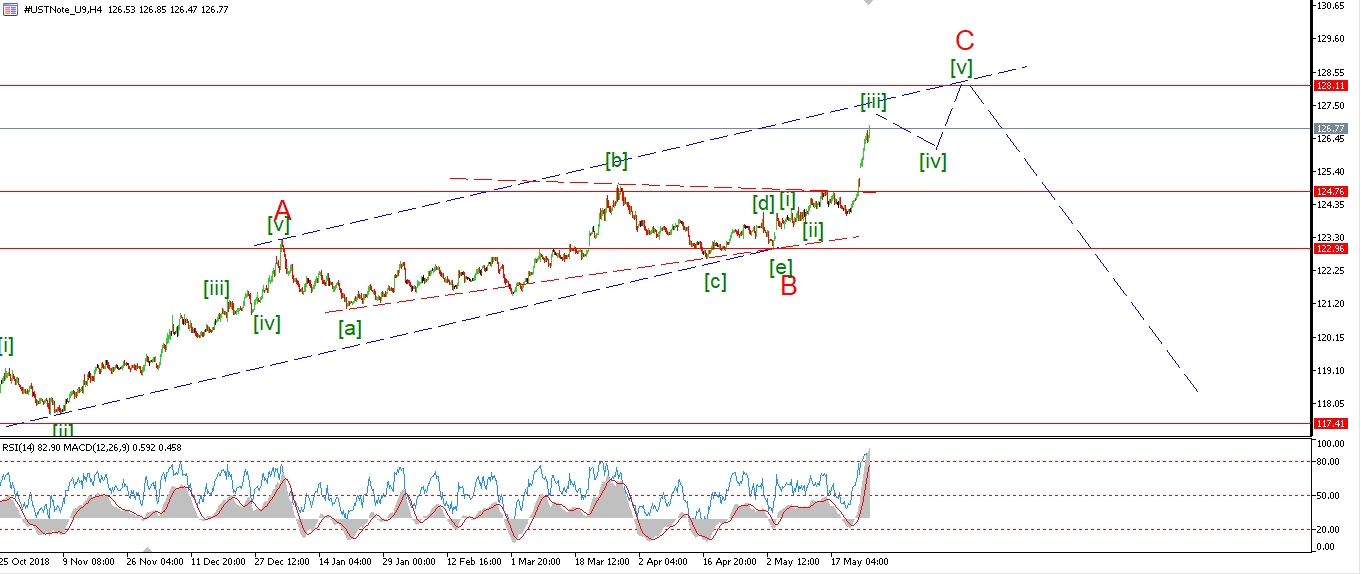 [/vc_column_text][vc_custom_heading text=”Daily” use_theme_fonts=”yes”][vc_column_text]
 [/vc_column_text][/vc_column][/vc_row]
[vc_row][vc_column][vc_column_text]
I reverted back the the triangle idea for wave (iv) again this evening.
The price did not fall to a new low as expected in a flat correction.
And the price rallied out of the triangle formation this morning in wave (v).
Wave (v) has met the minimum target to complete the larger wave [iii],
but I will have to wait and see if we get an extension higher in wave (v) next week.
A break back below 126.67 will signal that wave [iv[ has begun.
Monday;
Watch for a possible decline to begin wave [iv] green.
We are moving closer to the end of this rally now as wave [v] of ‘C’ is coming into view.
That should take no more than a couple of weeks to complete.
[/vc_column_text][/vc_column][/vc_row]
[vc_row][vc_column][vc_separator border_width=”5″][/vc_column][/vc_row][vc_row][vc_column][vc_column_text]
SILVER
[/vc_column_text][/vc_column][/vc_row][vc_row][vc_column][vc_separator border_width=”5″][/vc_column][/vc_row][vc_row][vc_column width=”2/3″][vc_custom_heading text=”1 hr” use_theme_fonts=”yes”][vc_column_text]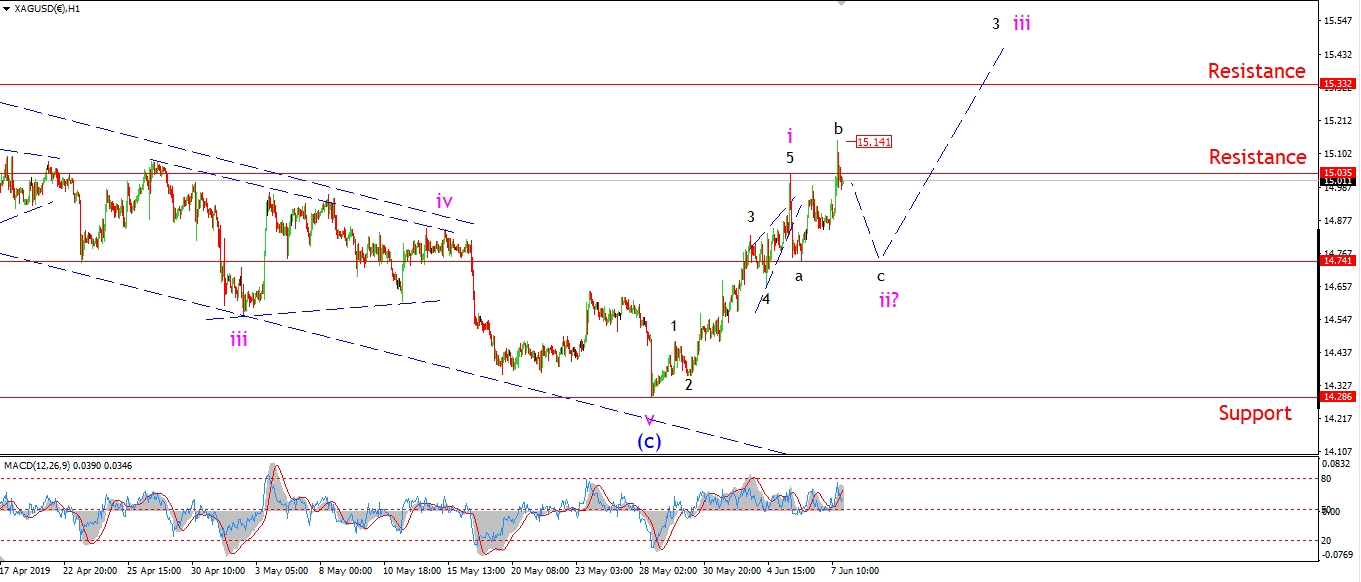 [/vc_column_text][/vc_column][vc_column width=”1/3″][vc_custom_heading text=”4 Hours” use_theme_fonts=”yes”][vc_column_text]
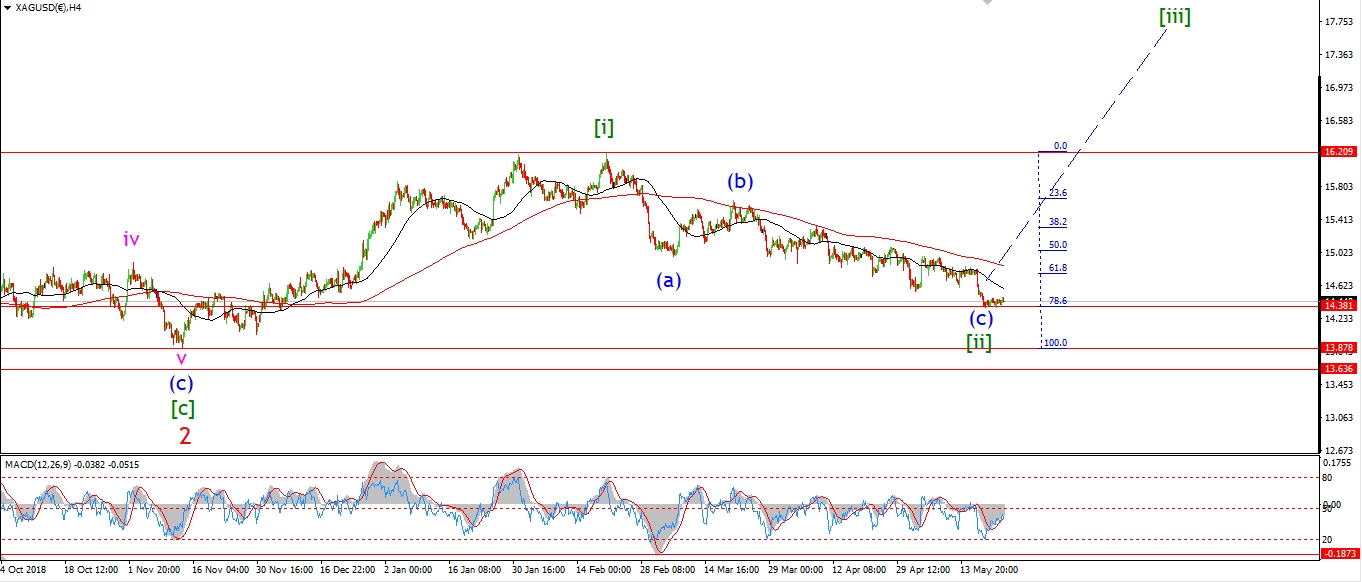 [/vc_column_text][vc_custom_heading text=”Daily” use_theme_fonts=”yes”][vc_column_text]
 [/vc_column_text][/vc_column][/vc_row]
[vc_row][vc_column][vc_column_text]
Silver is falling this evening after rallying to a new high above wave ‘i’ today.
The rally is in three waves similar to Gold,
so this rally is labelled wave ‘b’ of ‘ii’ in an expanded flat correction.
Wave ‘c’ should drop below wave ‘a’ at 14.74 on Monday
and then silver should begin a rally in wave ‘iii’ with a break of 15.15 again.
Monday;
Watch for wave ‘ii’ to complete with a break of 14.74.
[/vc_column_text][/vc_column][/vc_row]
[vc_row][vc_column][vc_separator border_width=”5″][/vc_column][/vc_row][vc_row][vc_column][vc_column_text]
S&P 500.
[/vc_column_text][/vc_column][/vc_row][vc_row][vc_column][vc_separator border_width=”5″][/vc_column][/vc_row][vc_row][vc_column width=”2/3″][vc_custom_heading text=”1 hr” use_theme_fonts=”yes”][vc_column_text]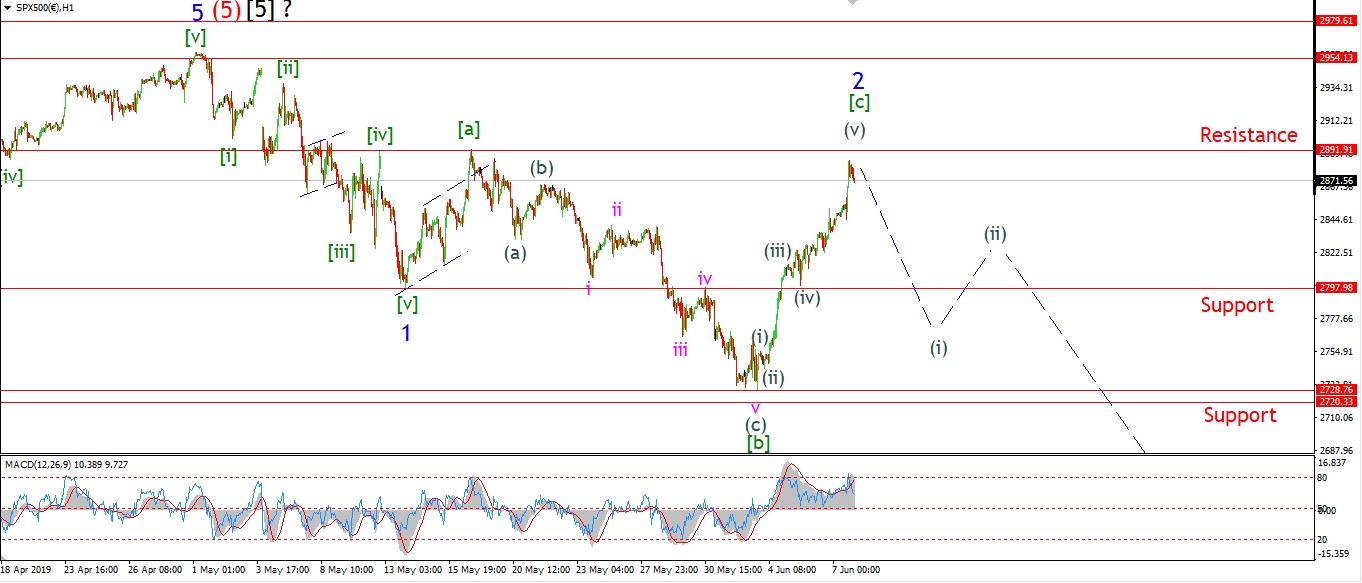 [/vc_column_text][/vc_column][vc_column width=”1/3″][vc_custom_heading text=”4 Hours” use_theme_fonts=”yes”][vc_column_text]
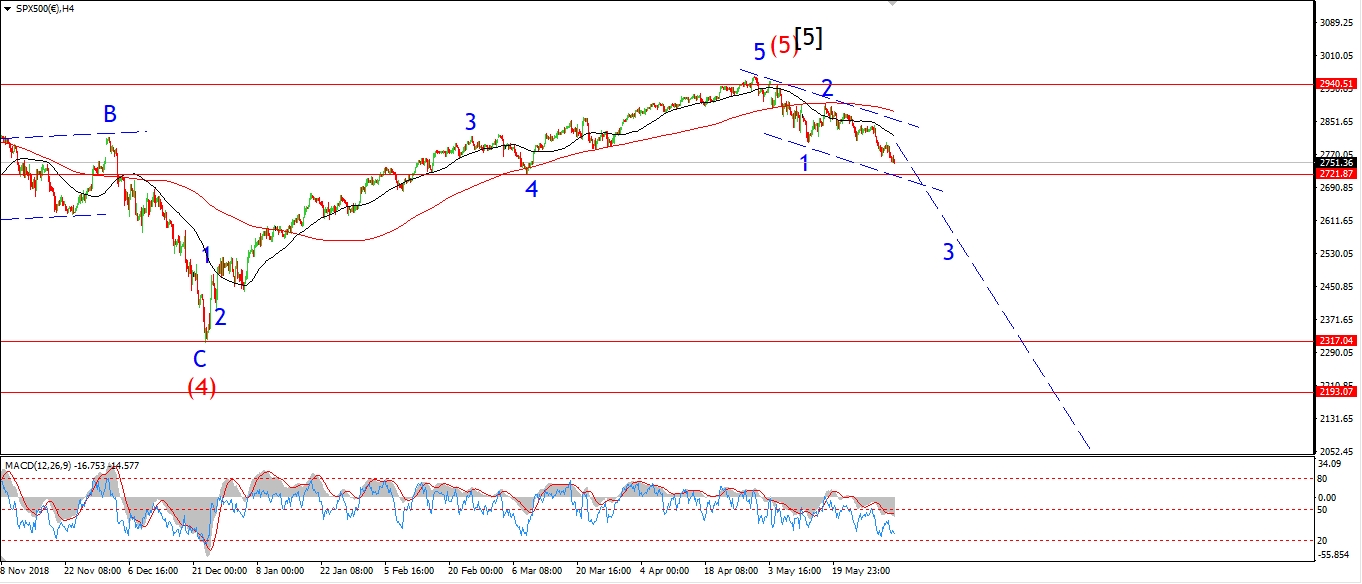 [/vc_column_text][vc_custom_heading text=”Daily” use_theme_fonts=”yes”][vc_column_text]
 [/vc_column_text][/vc_column][/vc_row]
[vc_row][vc_column][vc_column_text]
The S&P did rally also today but not to a new high above 2891.
The extent of the rally off the low at 2728 does fit the alternate count better though.
So I have switched to that count this evening also.
If the price holds below 2891 and turns lower again early next week.
Then this corrective rally in wave ‘2’ will be a running flat.
Wave ‘3’ down is now expected to begin any day.
If we see a five wave decline come in early next week,
that will signal wave (i) of [i] of ‘3’ has begun.
Wave [i] of ‘3’ should break below 2728 at a minimum over the coming weeks.
Monday;
Watch for wave (i) down to begin with a break of 2797 next week.
The market should create a lower high in wave (ii) by Friday.
Gods speed to you all.
See you Monday evening again.
[/vc_column_text][/vc_column][/vc_row]
[vc_row][vc_column][vc_separator border_width=”5″][/vc_column][/vc_row]