
[vc_row][vc_column][vc_separator border_width=”5″][/vc_column][/vc_row]
[vc_row][vc_column][vc_column_text]
Good evening all,
I posted the video this evening as I won’t have a chance to do it tomorrow.
I will be alone with my 2 year old and 5mth old for the weekend as my wife and eldest daughter travel to Rome to live it up!
so time will be at a premium tomorrow!
Ok down to it.
[/vc_column_text][/vc_column][/vc_row]
[vc_row][vc_column][vc_separator border_width=”5″][/vc_column][/vc_row]
[vc_row][vc_column][vc_column_text]
EURUSD
[/vc_column_text][/vc_column][/vc_row]
[vc_row][vc_column][vc_separator border_width=”5″][/vc_column][/vc_row][vc_row][vc_column width=”2/3″][vc_custom_heading text=”1 hr” use_theme_fonts=”yes”][vc_column_text]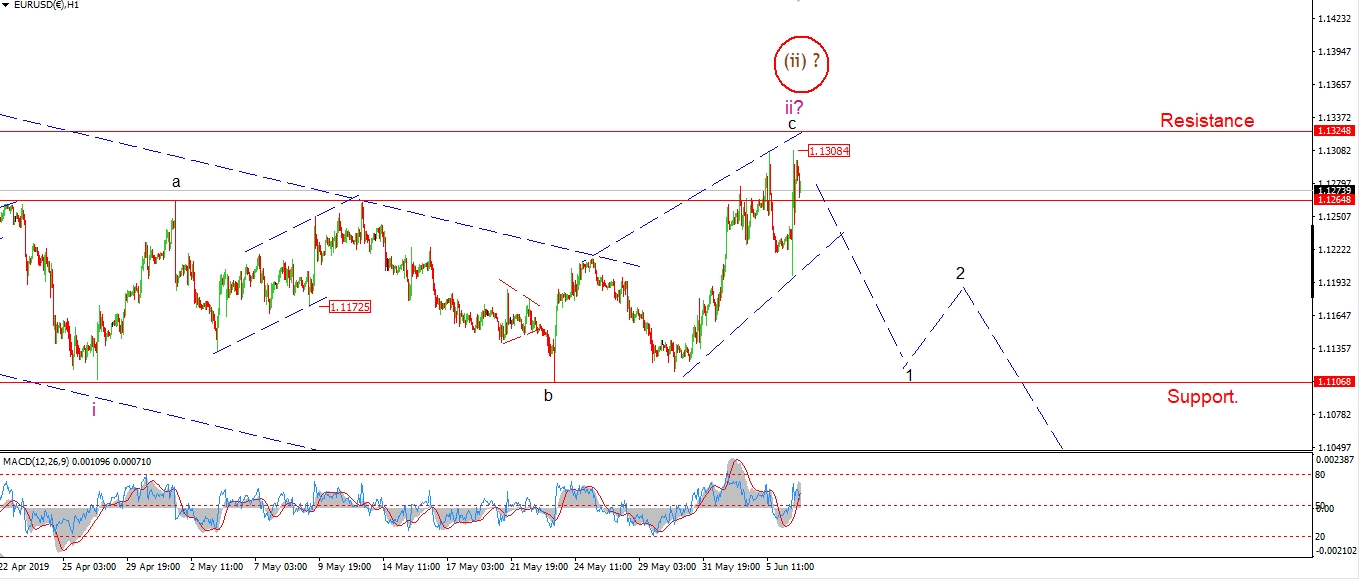 [/vc_column_text][/vc_column][vc_column width=”1/3″][vc_custom_heading text=”4 Hours” use_theme_fonts=”yes”][vc_column_text]
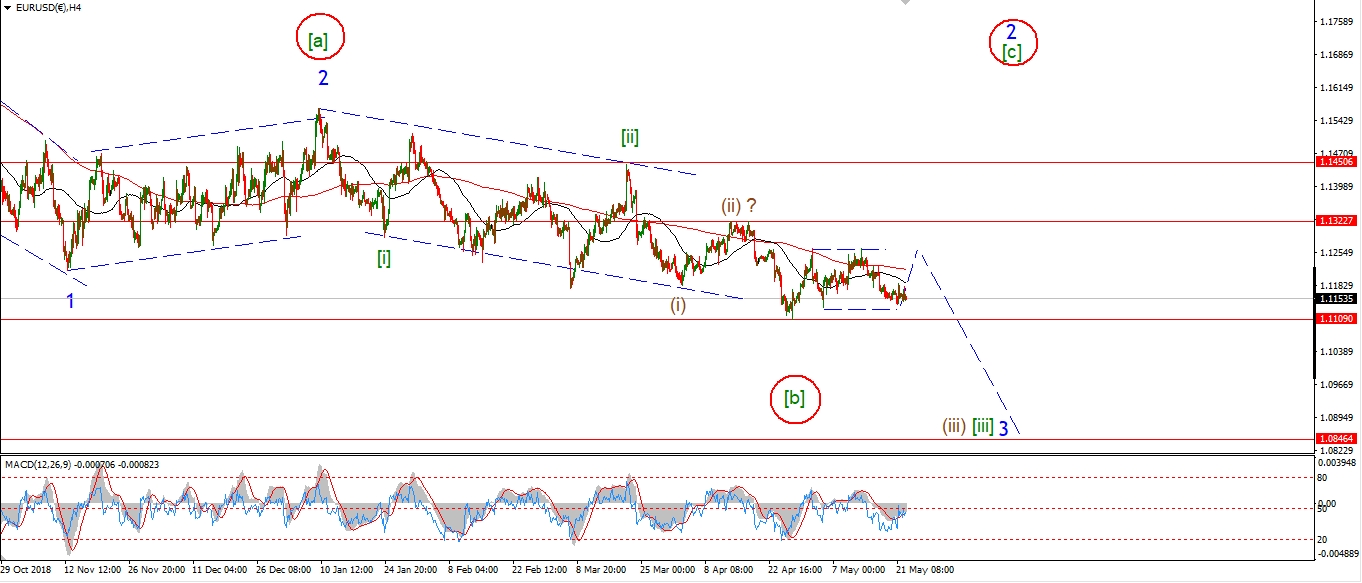 [/vc_column_text][vc_custom_heading text=”Daily” use_theme_fonts=”yes”][vc_column_text]
 [/vc_column_text][/vc_column][/vc_row]
[vc_row][vc_column][vc_column_text]
Heres one for you.
EURUSD is trading at the exact same price it was 7 months ago at the wave ‘1’ low.
You might call that stability in the market,
or, you could also call it a correction.
I prefer the latter!
The biggest problem is this,
at what degree is this correction operating in.
I went through a few of the options in the weekend video.
But all the wave count options all lead the same way in the end.
That is a decline in a large degree third wave down.
Tomorrow;
Wave ‘c’ of ‘ii’ is clinging for dear life to the price over the last week.
Sp far price has been rejected below resistance at 1.1324 twice.
So the current wave count still stands.
Watch for wave ‘iii’ down to begin tomorrow.
[/vc_column_text][/vc_column][/vc_row]
[vc_row][vc_column][vc_separator border_width=”5″][/vc_column][/vc_row][vc_row][vc_column][vc_column_text]
GBPUSD
[/vc_column_text][/vc_column][/vc_row][vc_row][vc_column][vc_separator border_width=”5″][/vc_column][/vc_row][vc_row][vc_column width=”2/3″][vc_custom_heading text=”1 hr” use_theme_fonts=”yes”][vc_column_text]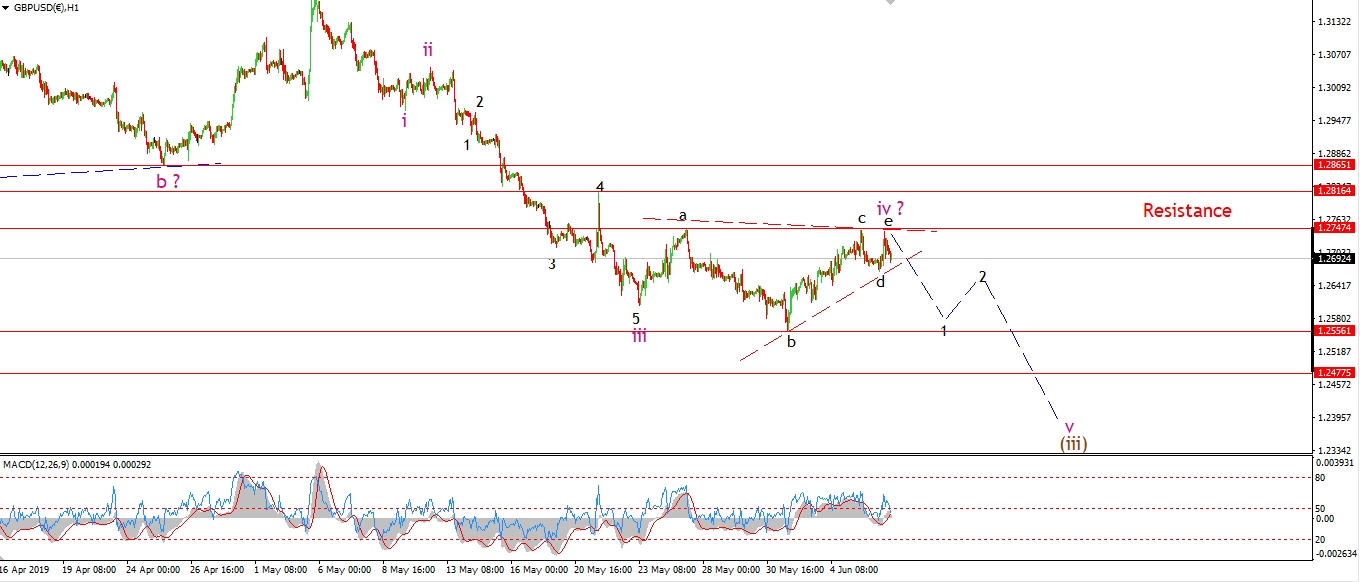 [/vc_column_text][/vc_column][vc_column width=”1/3″][vc_custom_heading text=”4 Hours” use_theme_fonts=”yes”][vc_column_text]
 [/vc_column_text][vc_custom_heading text=”Daily” use_theme_fonts=”yes”][vc_column_text]
 [/vc_column_text][/vc_column][/vc_row]
[vc_row][vc_column][vc_column_text]
The triangle wave ‘iv’ is now looking complete at the session high today.
The price is dropping off the highs now and this is viewed as the beginning of wave ‘v’ of (iii).
Ideally, wave (iii) should break 1.2475.
This level marks the wave [b] low of last January.
A break of this level will go a long way to confirming the trend change to the downside.
Tomorrow;
watch for wave ‘iv’ to hold at 1.2747.
Wave ‘v’ will be confirmed with a break of 1.2556.
[/vc_column_text][/vc_column][/vc_row]
[vc_row][vc_column][vc_separator border_width=”5″][/vc_column][/vc_row][vc_row][vc_column][vc_column_text]
USDJPY
[/vc_column_text][/vc_column][/vc_row][vc_row][vc_column][vc_separator border_width=”5″][/vc_column][/vc_row][vc_row][vc_column width=”2/3″][vc_custom_heading text=”1 hr” use_theme_fonts=”yes”][vc_column_text]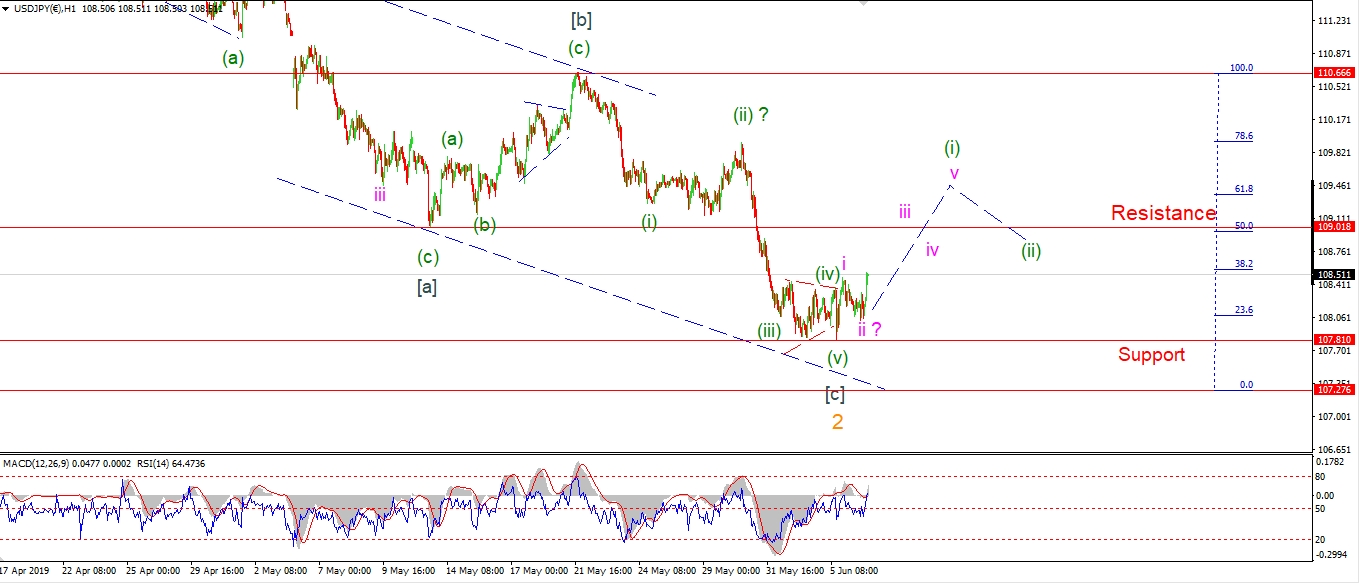 [/vc_column_text][/vc_column][vc_column width=”1/3″][vc_custom_heading text=”4 Hours” use_theme_fonts=”yes”][vc_column_text]
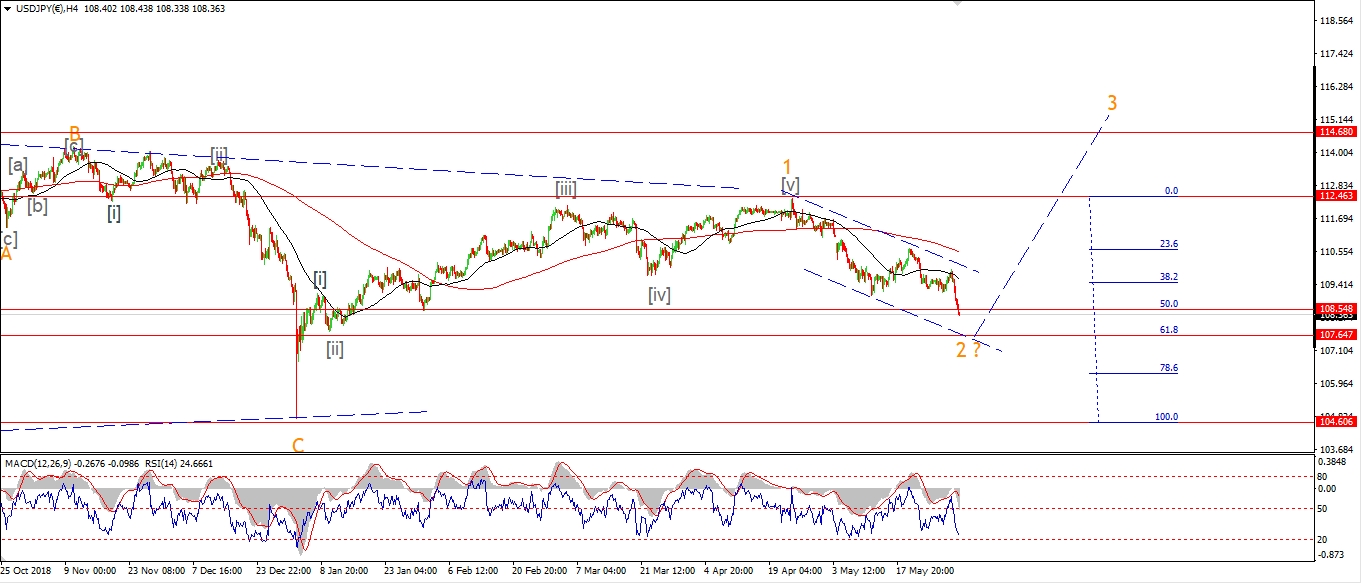 [/vc_column_text][vc_custom_heading text=”Daily” use_theme_fonts=”yes”][vc_column_text]
 [/vc_column_text][/vc_column][/vc_row]
[vc_row][vc_column][vc_column_text]
USDJPY fell throughout the day in a corrective overlapping fashion.
The price created a higher low above 107.80,
and now the price has rallied again in the last hour to break above the previous high labelled wave ‘i’ pink.
Although we need a five wave pattern to develop off the lows,
this short term action again suggests a significant low may be in for wave ‘2’.
The next week will be crucial for USDJPY.
Tomorrow;
If we see a continuation higher tomorrow,
this will signal that wave ‘iii’ of (i) is underway.
Watch for 107.81 to continue to hold at wave [c] of ‘2’.
[/vc_column_text][/vc_column][/vc_row]
[vc_row][vc_column][vc_separator border_width=”5″][/vc_column][/vc_row][vc_row][vc_column][vc_column_text]
DOW JONES INDUSTRIALS
[/vc_column_text][/vc_column][/vc_row][vc_row][vc_column][vc_separator border_width=”5″][/vc_column][/vc_row][vc_row][vc_column width=”2/3″][vc_custom_heading text=”1 hr” use_theme_fonts=”yes”][vc_column_text]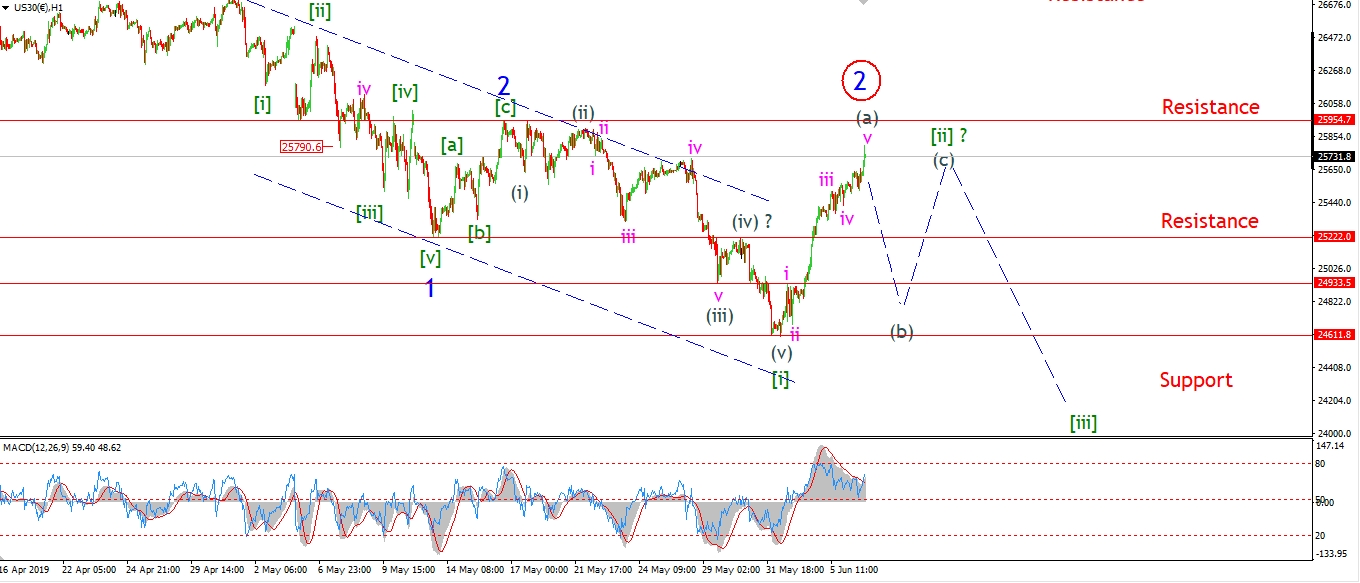 [/vc_column_text][/vc_column][vc_column width=”1/3″][vc_custom_heading text=”4 Hours” use_theme_fonts=”yes”][vc_column_text]
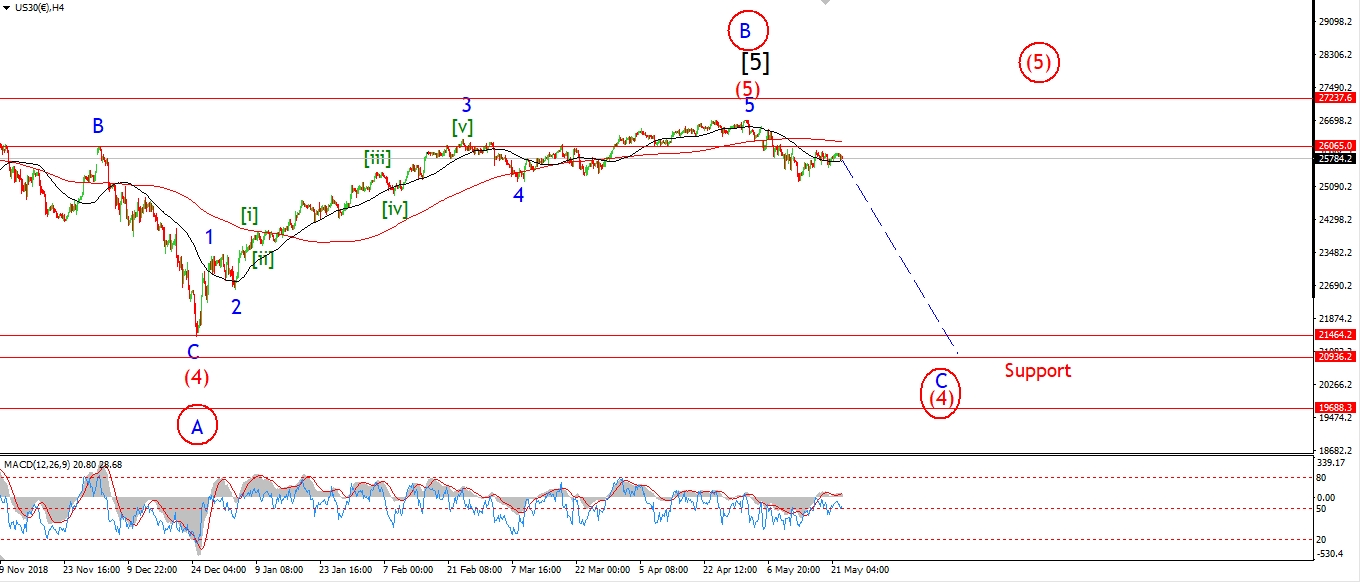 [/vc_column_text][vc_custom_heading text=”Daily” use_theme_fonts=”yes”][vc_column_text]
 [/vc_column_text][/vc_column][/vc_row]
[vc_row][vc_column][vc_column_text]
The DOW is creeping higher again today,
but with very little momentum behind the move.
This action is beginning to favor the larger wave ‘2’ alternate count at the moment,
But I have not switched to that count just yet,
as the market action expected in both wave count is similar over the coming week.
Wave [ii] will complete soon enough,
And then wave [iii] of ‘3’ will begin with a break of 24600 again.
On the 4hr chart,
There is a clear head and shoulders now in place around the recent high at wave [5].
The result of this should be a large decline in wave ‘3’ over the coning weeks.
Tomorrow;
Watch for a decline to begin in either wave (b) of ‘2’,
or wave [i] of ‘3’.
A break of 2460 next week will trigger the alternate count.
[/vc_column_text][/vc_column][/vc_row]
[vc_row][vc_column][vc_separator border_width=”5″][/vc_column][/vc_row][vc_row][vc_column][vc_column_text]
GOLD
[/vc_column_text][/vc_column][/vc_row][vc_row][vc_column][vc_separator border_width=”5″][/vc_column][/vc_row][vc_row][vc_column width=”2/3″][vc_custom_heading text=”1 hr” use_theme_fonts=”yes”][vc_column_text]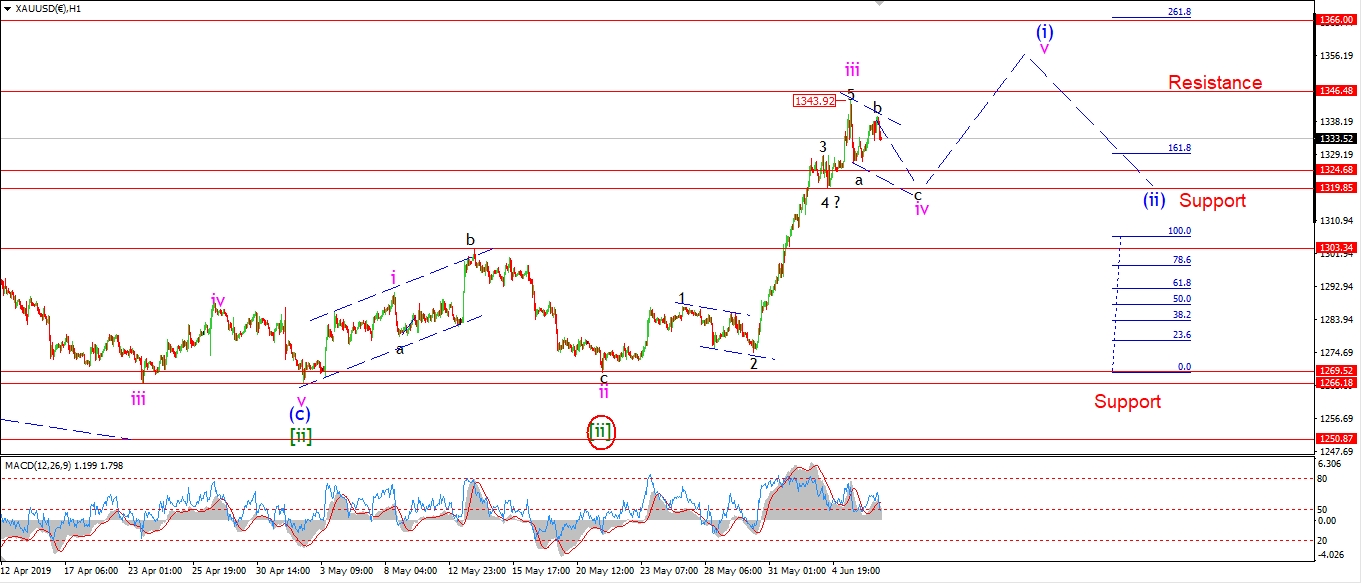 [/vc_column_text][/vc_column][vc_column width=”1/3″][vc_custom_heading text=”4 Hours” use_theme_fonts=”yes”][vc_column_text]
 [/vc_column_text][vc_custom_heading text=”Daily” use_theme_fonts=”yes”][vc_column_text]
 [/vc_column_text][/vc_column][/vc_row]
[vc_row][vc_column][vc_column_text]
Gold rose today to a lower high below wave ‘iii’ pink.
This is labelled as wave ‘b’ of ‘iv’.
The price should decline again in wave ‘c’ of ‘iv’ tomorrow,
into the the target range between 1324 and 13.19.
The lower trend channel line favors the lower target at 1319 to complete wave ‘iv’.
Once wave ‘iv’ completes we can expect a rally again in wave ‘v’ of (i).
Tomorrow;
Watch for wave ‘c’ of ‘iv’ to complete at 1319 and then turn higher again.
[/vc_column_text][/vc_column][/vc_row]
[vc_row][vc_column][vc_separator border_width=”5″][/vc_column][/vc_row][vc_row][vc_column][vc_column_text]
U.S CRUDE OIL
[/vc_column_text][/vc_column][/vc_row][vc_row][vc_column][vc_separator border_width=”5″][/vc_column][/vc_row][vc_row][vc_column width=”2/3″][vc_custom_heading text=”1 hr” use_theme_fonts=”yes”][vc_column_text]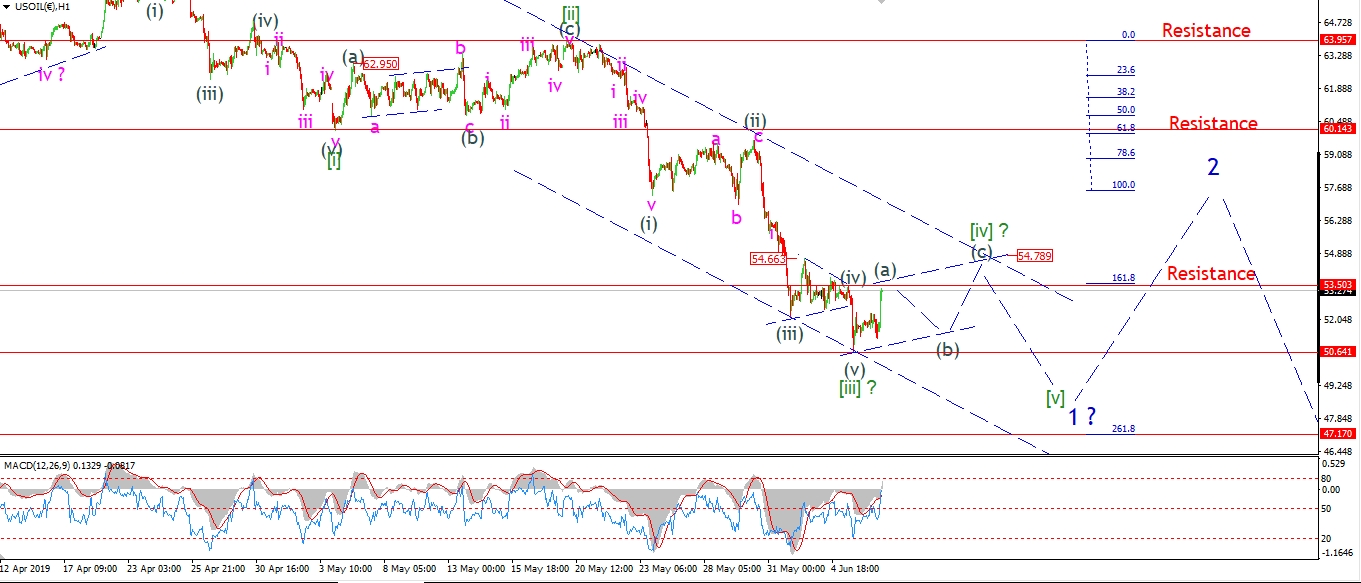 [/vc_column_text][/vc_column][vc_column width=”1/3″][vc_custom_heading text=”4 Hours” use_theme_fonts=”yes”][vc_column_text]
 [/vc_column_text][vc_custom_heading text=”Daily” use_theme_fonts=”yes”][vc_column_text]
 [/vc_column_text][/vc_column][/vc_row]
[vc_row][vc_column][vc_column_text]
Crude oil has risen off the wave [iii] low in three waves into this evenings highs at 53.20.
Todays action labelled wave (a) of [iv],
and this should create an overall three wave correction higher
back towards the upper trend channel line again.
Wave [iv] seems to be tracing out a flat correction,
this should have a 3,3,5 internal structure.
Tomorrow;
The smaller trend channel suggests a rise into about 54.80 again to complete wave [iv].
And then the price should turn lower again in wave [v] to complete wave ‘1’.
Watch for wave (a) to complete soon and then turn lower into waev (b) tomorrow.
[/vc_column_text][/vc_column][/vc_row]
[vc_row][vc_column][vc_separator border_width=”5″][/vc_column][/vc_row][vc_row][vc_column][vc_column_text]
US 10 yr Treasuries.
[/vc_column_text][/vc_column][/vc_row][vc_row][vc_column][vc_separator border_width=”5″][/vc_column][/vc_row][vc_row][vc_column width=”2/3″][vc_custom_heading text=”1 hr” use_theme_fonts=”yes”][vc_column_text]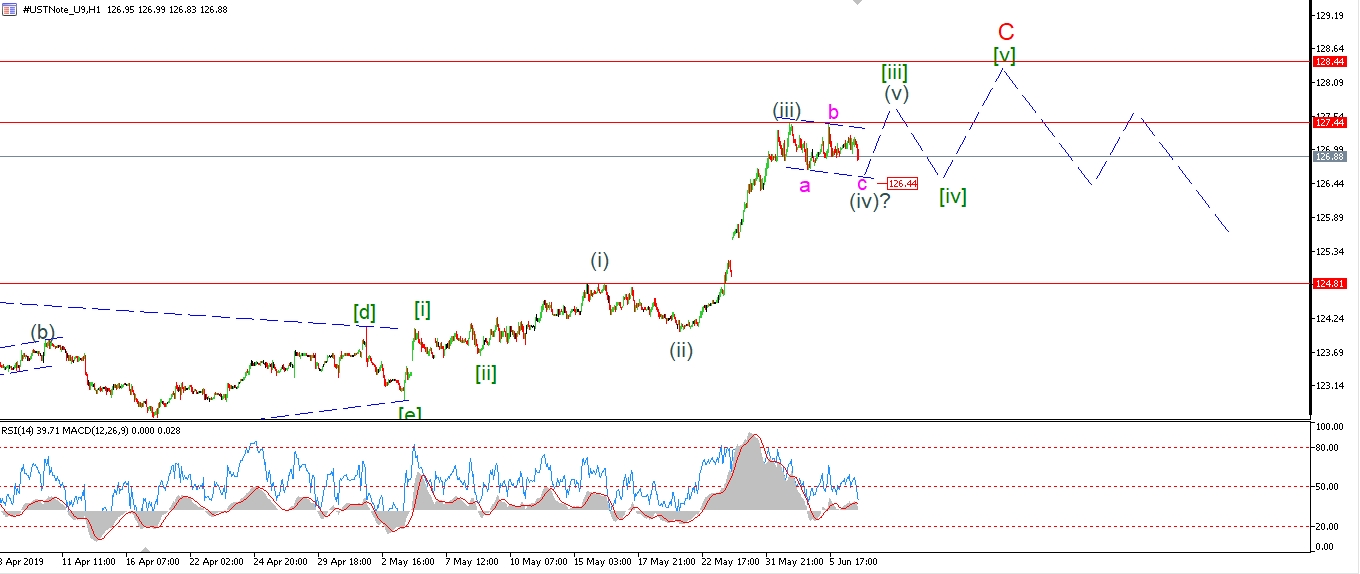 [/vc_column_text][/vc_column][vc_column width=”1/3″][vc_custom_heading text=”4 Hours” use_theme_fonts=”yes”][vc_column_text]
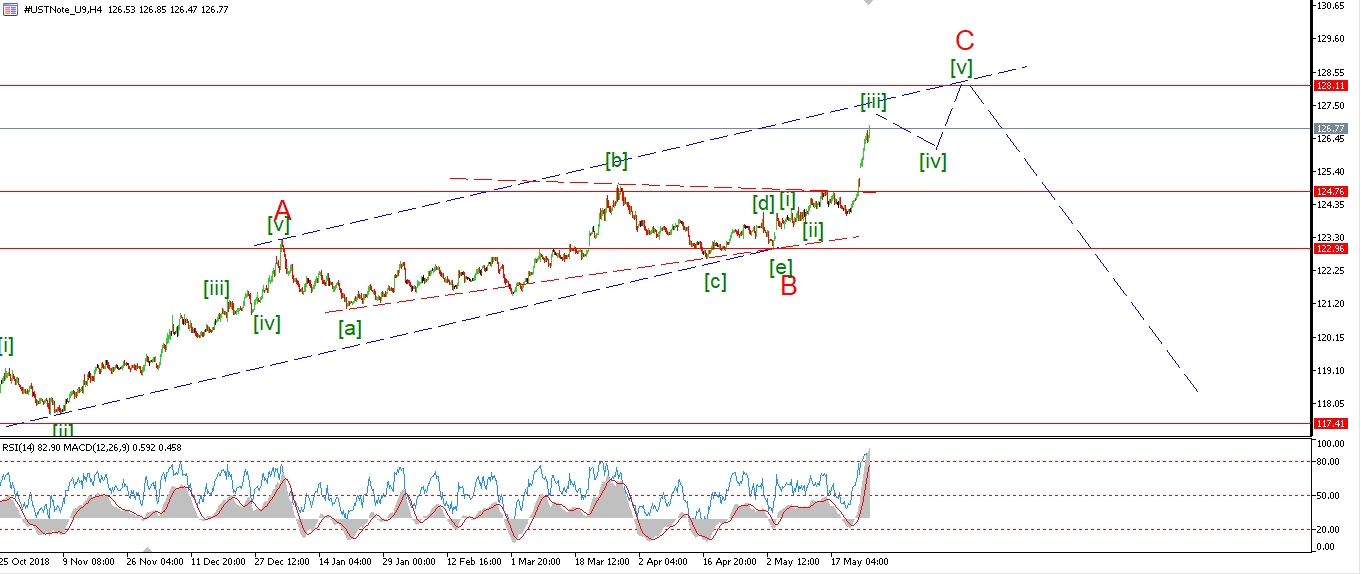 [/vc_column_text][vc_custom_heading text=”Daily” use_theme_fonts=”yes”][vc_column_text]
 [/vc_column_text][/vc_column][/vc_row]
[vc_row][vc_column][vc_column_text]
Price is continuing to correct in wave (iv) grey today.
The internal structure is complicated as it seems to be tracing out a double combination wave.
The price should drop into the lower support again in wave ‘c’ of (i) though.
With the initial target for wave ‘c’ at 126.40 or so.
Price should then turn higher again into wave (v) of [iii].
Tomorrow;
Watch for wave (iv) to complete at the target.
Wave (v) should then push back up above 127.40.
[/vc_column_text][/vc_column][/vc_row]
[vc_row][vc_column][vc_separator border_width=”5″][/vc_column][/vc_row][vc_row][vc_column][vc_column_text]
SILVER
[/vc_column_text][/vc_column][/vc_row][vc_row][vc_column][vc_separator border_width=”5″][/vc_column][/vc_row][vc_row][vc_column width=”2/3″][vc_custom_heading text=”1 hr” use_theme_fonts=”yes”][vc_column_text]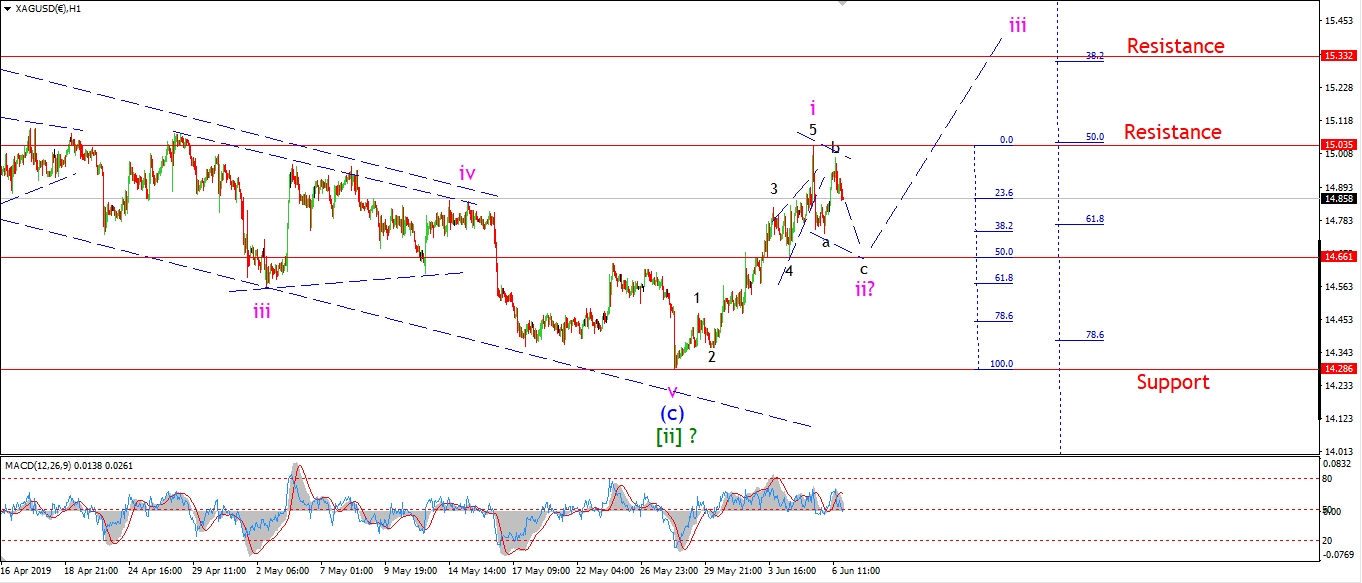 [/vc_column_text][/vc_column][vc_column width=”1/3″][vc_custom_heading text=”4 Hours” use_theme_fonts=”yes”][vc_column_text]
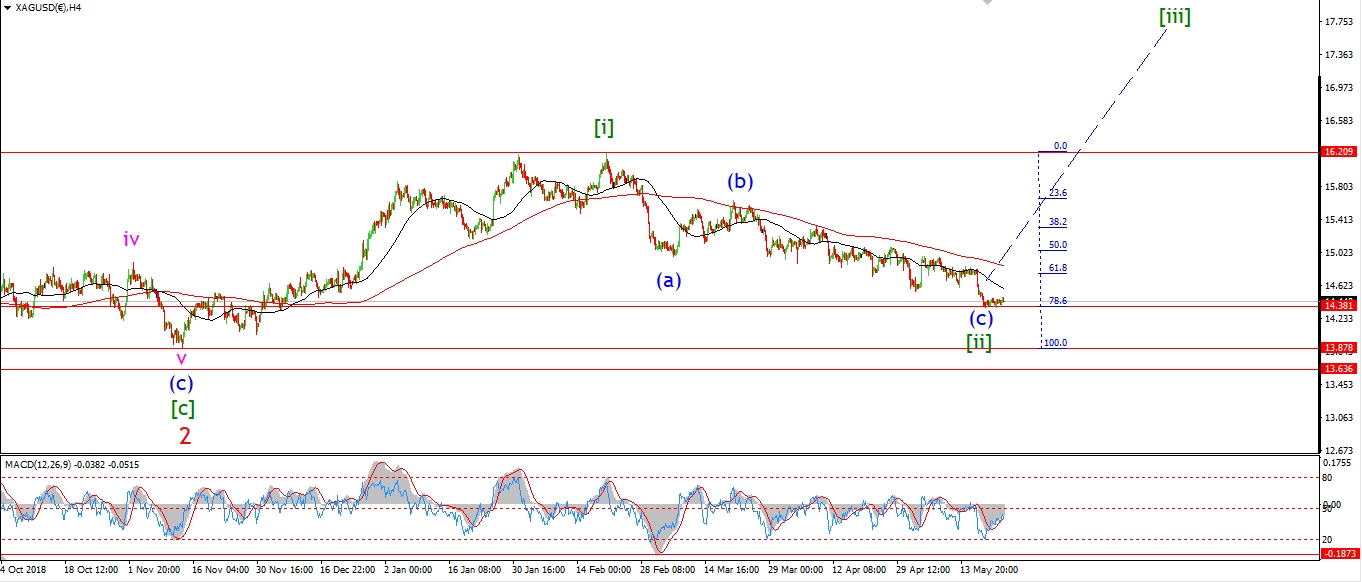 [/vc_column_text][vc_custom_heading text=”Daily” use_theme_fonts=”yes”][vc_column_text]
 [/vc_column_text][/vc_column][/vc_row]
[vc_row][vc_column][vc_column_text]
Silver has created a lower high in wave ‘b’ also today.
The price is again dropping this evening in wave ‘c’ of ‘ii’.
This decline is off a high in wave ‘i’ of (i).
As compared to Gold,
which is correcting in wave ‘iv’ of (i).
So the bullish wave structure in silver is a less developed compared to Gold so far.
Both metals should continue to rally from here as the trend change takes hold.
Tomorrow;
Watch for wave ‘c’ of ‘ii’ to carry the price down to about 14.66 to complete the correction.
This level corresponds with both the previous fourth wave and the 50% retracement level.
[/vc_column_text][/vc_column][/vc_row]
[vc_row][vc_column][vc_separator border_width=”5″][/vc_column][/vc_row][vc_row][vc_column][vc_column_text]
S&P 500.
[/vc_column_text][/vc_column][/vc_row][vc_row][vc_column][vc_separator border_width=”5″][/vc_column][/vc_row][vc_row][vc_column width=”2/3″][vc_custom_heading text=”1 hr” use_theme_fonts=”yes”][vc_column_text]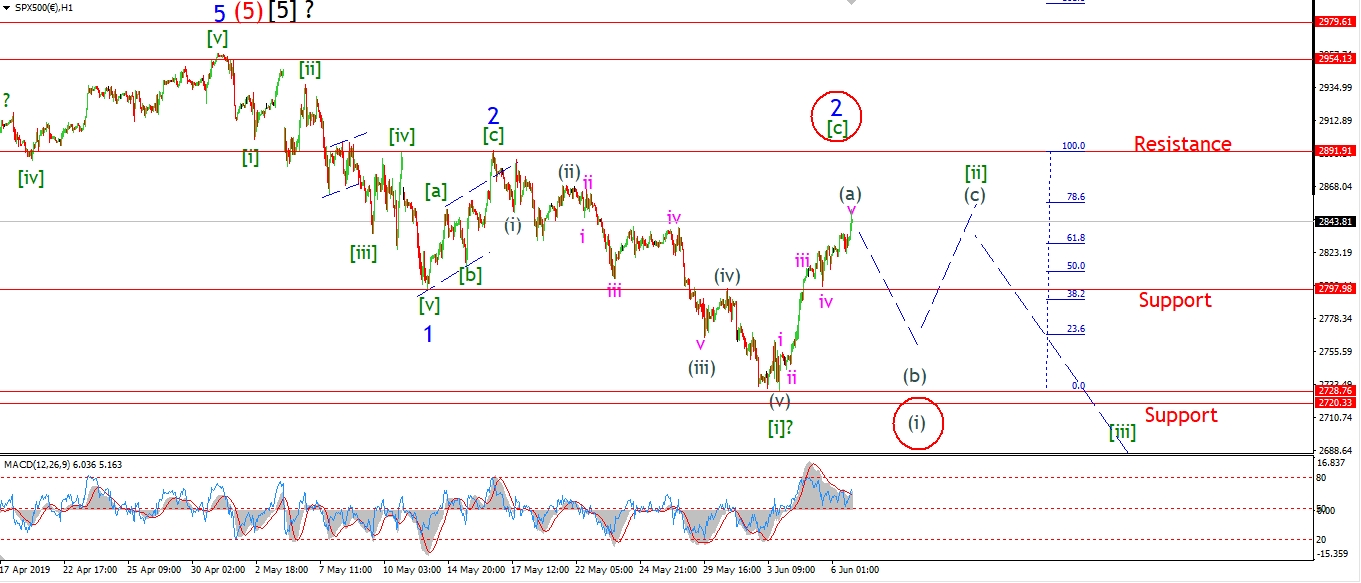 [/vc_column_text][/vc_column][vc_column width=”1/3″][vc_custom_heading text=”4 Hours” use_theme_fonts=”yes”][vc_column_text]
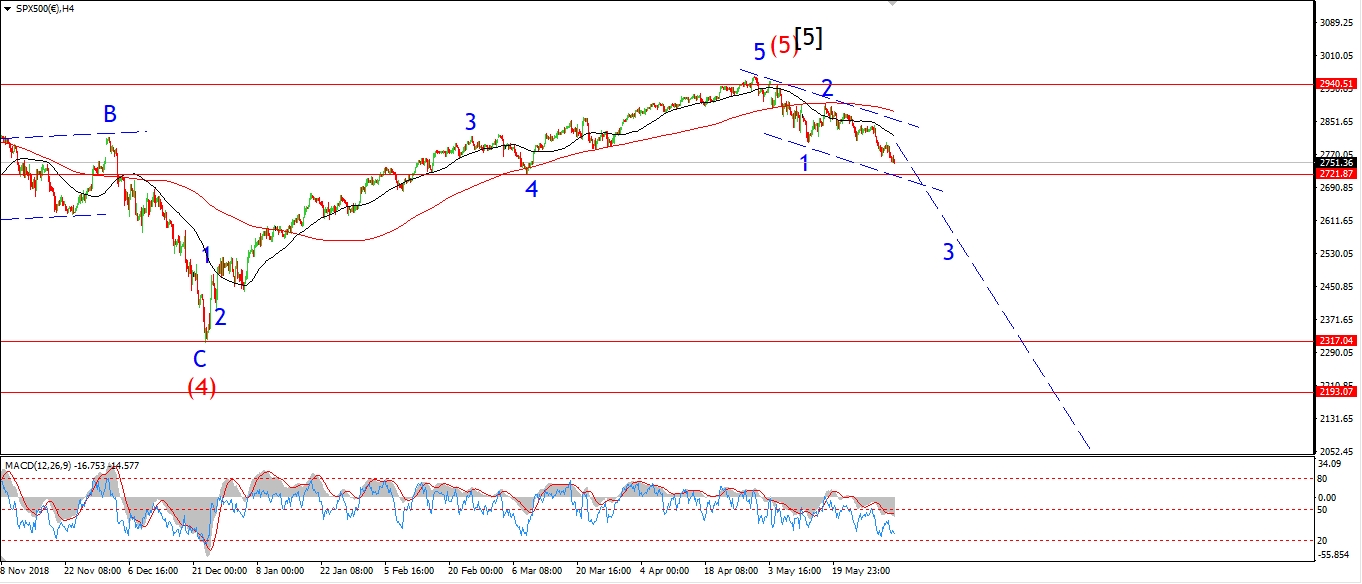 [/vc_column_text][vc_custom_heading text=”Daily” use_theme_fonts=”yes”][vc_column_text]
 [/vc_column_text][/vc_column][/vc_row]
[vc_row][vc_column][vc_column_text]
Traders are obviously euphoric again this week as you can tell from their actions!
They have bid prices back to extremes again on the back of dovish FED speak,
and now that the FED has shot the last of its ammo,
where can the price go now – but down!
The S&P is pushed higher throughout the day in wave (a) of [ii].
Or wave [c] of ‘2’,
depending on how you count the interim decline and rally phase.
I am beginning to lean in favor of the alternate count
which shows a possible running flat wave ‘2’ blue.
If this alternate count is correct,
then wave ‘3’ will be an absolutely killer selloff.
Tomorrow;
watch for this rally to halt with a sudden spike lower into wave (b) or wave (i).
A break of 2728 next week will trigger the alternate count.
[/vc_column_text][/vc_column][/vc_row]
[vc_row][vc_column][vc_separator border_width=”5″][/vc_column][/vc_row]