
[vc_row][vc_column][vc_separator border_width=”5″][/vc_column][/vc_row]
[vc_row][vc_column][vc_column_text]
Howdy folks.
[/vc_column_text][/vc_column][/vc_row]
[vc_row][vc_column][vc_separator border_width=”5″][/vc_column][/vc_row]
[vc_row][vc_column][vc_column_text]
EURUSD
[/vc_column_text][/vc_column][/vc_row]
[vc_row][vc_column][vc_separator border_width=”5″][/vc_column][/vc_row][vc_row][vc_column width=”2/3″][vc_custom_heading text=”1 hr” use_theme_fonts=”yes”][vc_column_text] [/vc_column_text][/vc_column][vc_column width=”1/3″][vc_custom_heading text=”4 Hours” use_theme_fonts=”yes”][vc_column_text]
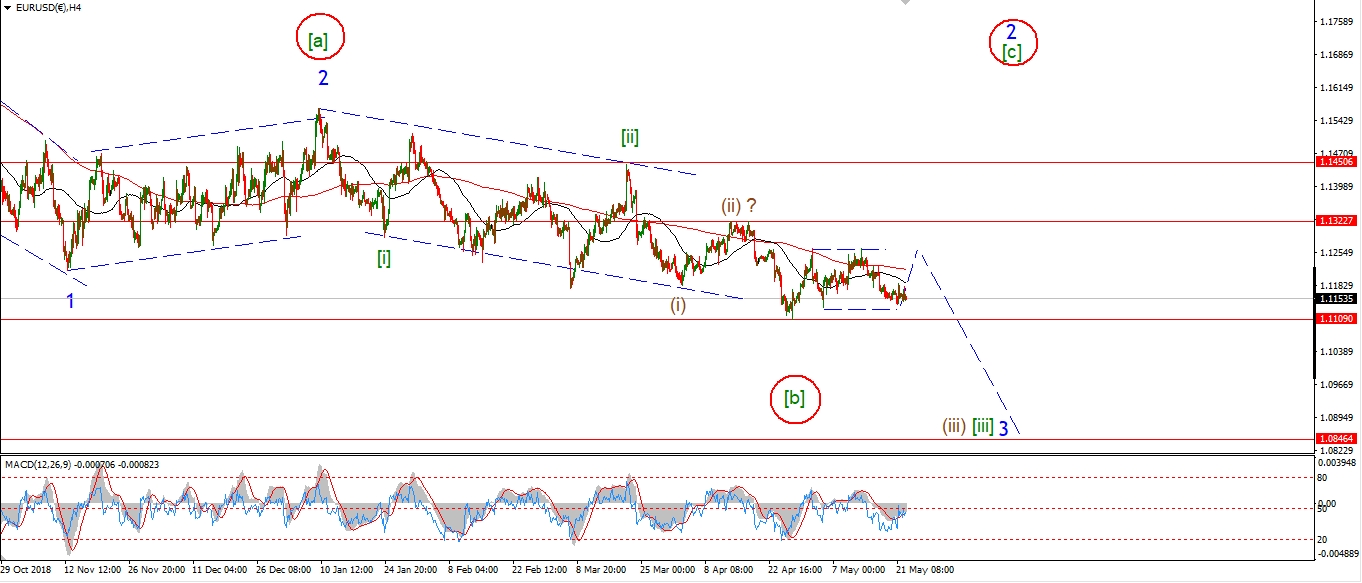 [/vc_column_text][vc_custom_heading text=”Daily” use_theme_fonts=”yes”][vc_column_text]
 [/vc_column_text][/vc_column][/vc_row]
[vc_row][vc_column][vc_column_text]
EURUSD has had an interesting day for sure.
the price did spike to a new high early in the european session
and then this evening it has been all downhill again!
The rally in wave ‘c’ of ‘ii’ is still a valid count despite the new high,
as the price never broke resistance at 1.1324.
The fact that EURUSD has sold off sharply below resistance is a good sign that the larger wave ‘iii’ is now beginning.
Wave ‘iii’ will be confirmed with a break of 1.1106 again.
Tomorrow;
Todays high at wave ‘ii’ of 1.1306 should hold as wave ‘iii’ down gets underway.
Watch for a continued selloff tomorrow in wave ‘1’ of ‘iii’.
[/vc_column_text][/vc_column][/vc_row]
[vc_row][vc_column][vc_separator border_width=”5″][/vc_column][/vc_row][vc_row][vc_column][vc_column_text]
GBPUSD
[/vc_column_text][/vc_column][/vc_row][vc_row][vc_column][vc_separator border_width=”5″][/vc_column][/vc_row][vc_row][vc_column width=”2/3″][vc_custom_heading text=”1 hr” use_theme_fonts=”yes”][vc_column_text] [/vc_column_text][/vc_column][vc_column width=”1/3″][vc_custom_heading text=”4 Hours” use_theme_fonts=”yes”][vc_column_text]
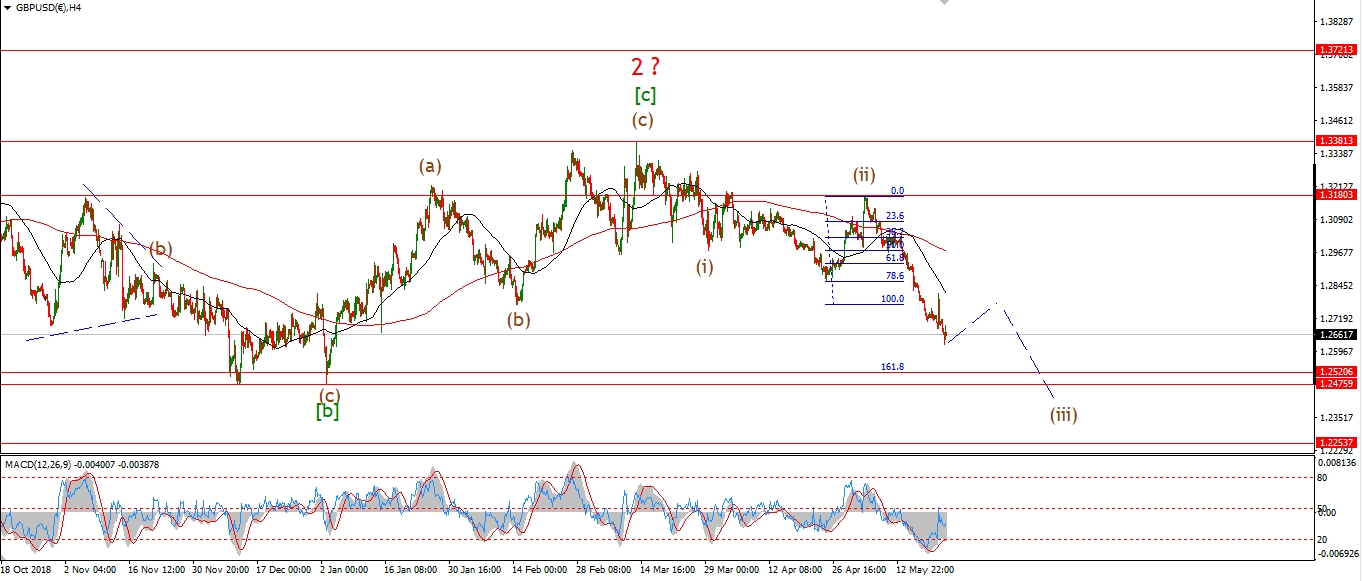 [/vc_column_text][vc_custom_heading text=”Daily” use_theme_fonts=”yes”][vc_column_text]
 [/vc_column_text][/vc_column][/vc_row]
[vc_row][vc_column][vc_column_text]
Cable continued rising early today in wave ‘c’ of ‘iv’.
the previous wave ‘a’ high at 1.2747 was not broken though.
So the triangle idea for wave ‘iv’ is still valid.
The price has now dropped off the session high at 1.2743 again this afternoon.
This decline is labelled as wave ‘d’ of ‘iv’.
And wave ‘d’ should find support at 1.2602 again.
Tomorrow;
Watch for wave ‘d’ of ‘iv’ to complete above 1.2560 at weave ‘b’.
If the price breaks below the wave ‘b’ low that will signal that wave ‘v’ pink has begun.
[/vc_column_text][/vc_column][/vc_row]
[vc_row][vc_column][vc_separator border_width=”5″][/vc_column][/vc_row][vc_row][vc_column][vc_column_text]
USDJPY
[/vc_column_text][/vc_column][/vc_row][vc_row][vc_column][vc_separator border_width=”5″][/vc_column][/vc_row][vc_row][vc_column width=”2/3″][vc_custom_heading text=”1 hr” use_theme_fonts=”yes”][vc_column_text] [/vc_column_text][/vc_column][vc_column width=”1/3″][vc_custom_heading text=”4 Hours” use_theme_fonts=”yes”][vc_column_text]
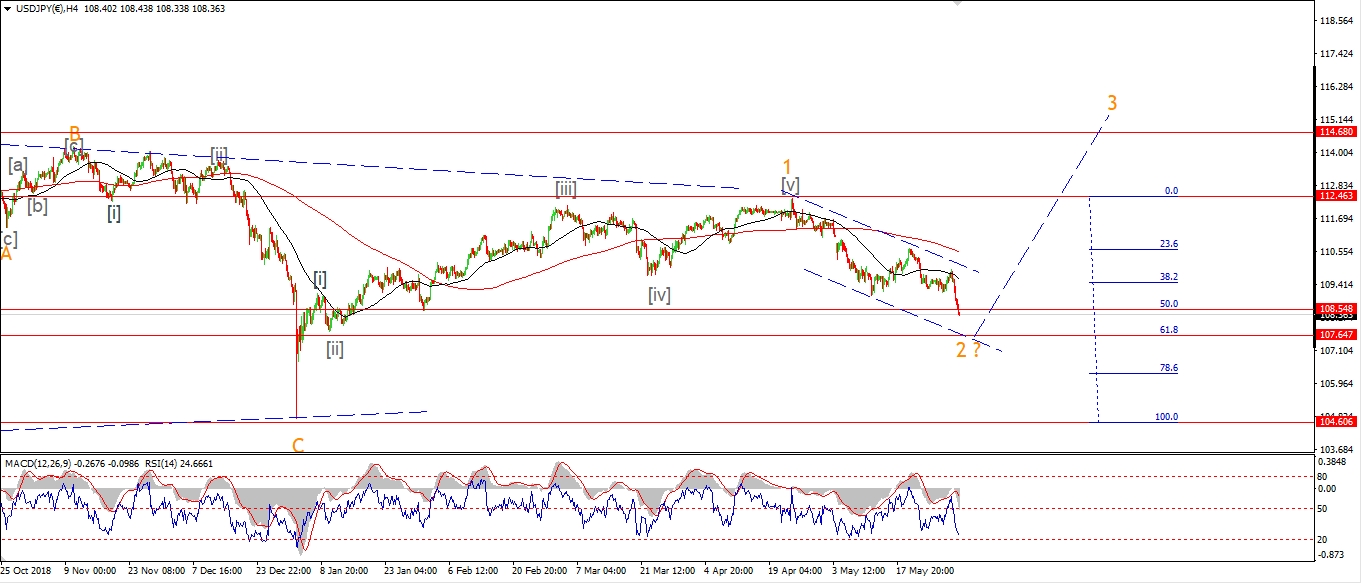 [/vc_column_text][vc_custom_heading text=”Daily” use_theme_fonts=”yes”][vc_column_text]
 [/vc_column_text][/vc_column][/vc_row]
[vc_row][vc_column][vc_column_text]
After todays whipsaw action, USDJPY is looking bullish again!
I have altered the wave count slightly to show a completed wave (iv) as a possible running flat correction.
The price dived lower out of that correction this morning,
we made a slight new low to complete wave (v) this afternoon,
And then the price spiked higher above the wave (iv) this evening.
This spike in price is occurring just above the suggested support level for wave [c].
So we have a possible turn higher right in the area where we might expect it to happen.
Things are getting interesting in USDJPY again.
Tomorrow;
Watch for a push above 109.00 again at the previous wave [a] low.
A five wave pattern higher will signal that wave ‘3’ up is getting started off these lows.
If the bottom is now in for wave ‘2’.
Then we should get a bullish signal in place by the end of next week.
[/vc_column_text][/vc_column][/vc_row]
[vc_row][vc_column][vc_separator border_width=”5″][/vc_column][/vc_row][vc_row][vc_column][vc_column_text]
DOW JONES INDUSTRIALS
[/vc_column_text][/vc_column][/vc_row][vc_row][vc_column][vc_separator border_width=”5″][/vc_column][/vc_row][vc_row][vc_column width=”2/3″][vc_custom_heading text=”1 hr” use_theme_fonts=”yes”][vc_column_text] [/vc_column_text][/vc_column][vc_column width=”1/3″][vc_custom_heading text=”4 Hours” use_theme_fonts=”yes”][vc_column_text]
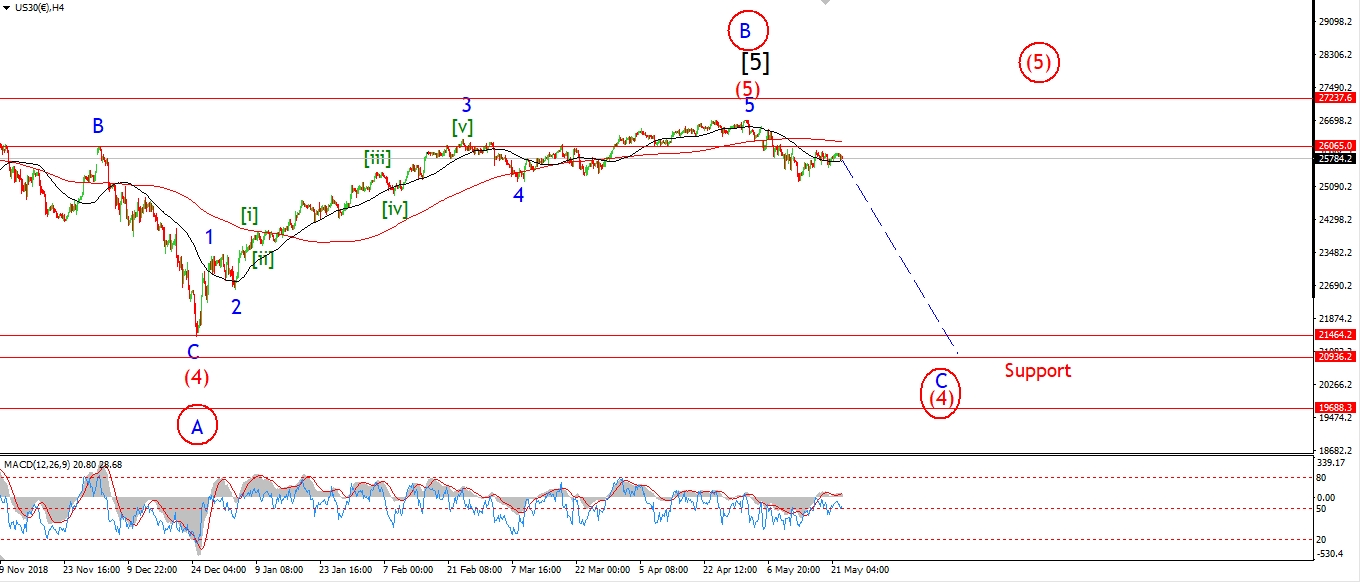 [/vc_column_text][vc_custom_heading text=”Daily” use_theme_fonts=”yes”][vc_column_text]
 [/vc_column_text][/vc_column][/vc_row]
[vc_row][vc_column][vc_column_text]
I have switched to the alternate count this evening for the DOW.
This involves a series of impulse patterns lower off the recent highs.
The price is in a corrective holding pattern in wave [ii] now.
And this should lead to a renewed selling phase as wave [iii] of ‘3’ gets underway next week.
The rally over the last two sessions seems to be halting this evening.
This initial move higher off the wave [i] low is in five waves,
So this is either wave (a) of [ii].
Or,
wave [c] of ‘2’ as shown in the new alternate count.
In either wave count,
this rally is corrective and terminal.
And should be followed by a large selloff.
Tomorrow;
Watch for a decline in wave (b) of [ii] to begin.
Wave (b) should hit the 24900 level again before completing.
[/vc_column_text][/vc_column][/vc_row]
[vc_row][vc_column][vc_separator border_width=”5″][/vc_column][/vc_row][vc_row][vc_column][vc_column_text]
GOLD
[/vc_column_text][/vc_column][/vc_row][vc_row][vc_column][vc_separator border_width=”5″][/vc_column][/vc_row][vc_row][vc_column width=”2/3″][vc_custom_heading text=”1 hr” use_theme_fonts=”yes”][vc_column_text] [/vc_column_text][/vc_column][vc_column width=”1/3″][vc_custom_heading text=”4 Hours” use_theme_fonts=”yes”][vc_column_text]
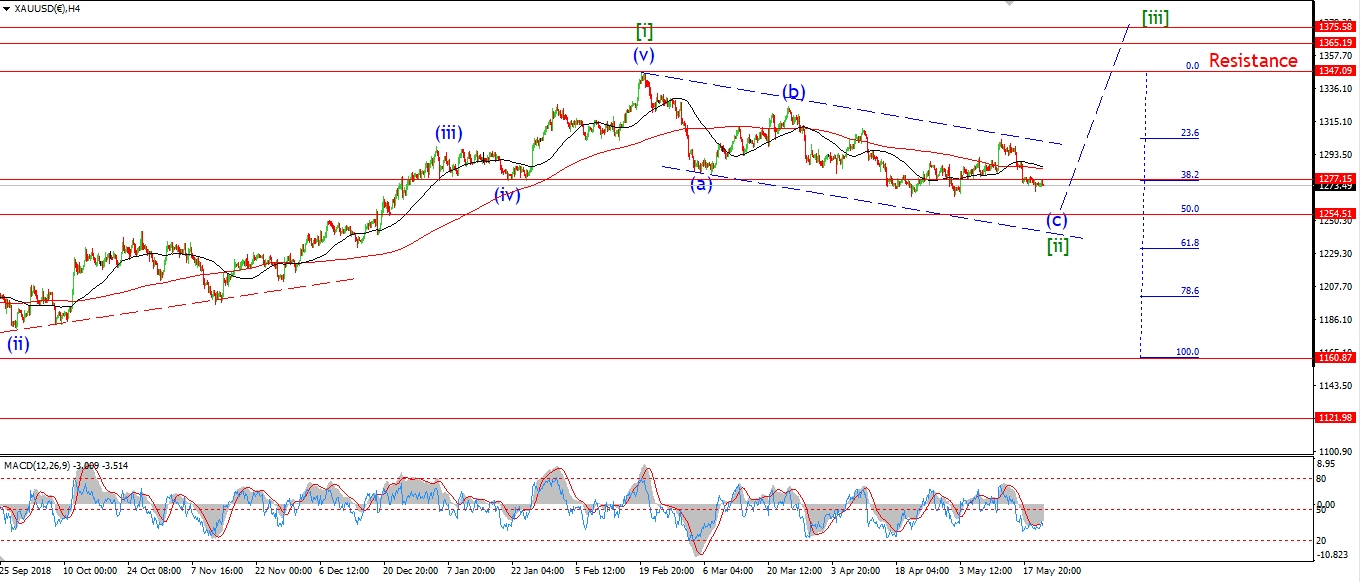 [/vc_column_text][vc_custom_heading text=”Daily” use_theme_fonts=”yes”][vc_column_text]
 [/vc_column_text][/vc_column][/vc_row]
[vc_row][vc_column][vc_column_text]
Gold spiked higher again this morning reaching above 1340 again for the first time since February.
The February high at wave [i] lies at 1347,
this level is acting as major resistance now to the current rally in wave [iii].
But once we break out above that level,
the larger bullish pattern will be confirmed.
It took 3 months for gold to complete wave [ii] with an $80 decline.
And so far in wave [iii],
it has taken about 10 days for the price to make up most of the loss!
That is the power of wave [iii] on display.
Tomorrow;
todays declines are labelled as the beginning of wave ‘iv’ pink.
This wave should correct lower in a three wave pattern.
Wave ‘iv’ should find support at about 1320 again.
And then we should prepare for another rally in wave ‘v’ of (i).
[/vc_column_text][/vc_column][/vc_row]
[vc_row][vc_column][vc_separator border_width=”5″][/vc_column][/vc_row][vc_row][vc_column][vc_column_text]
U.S CRUDE OIL
[/vc_column_text][/vc_column][/vc_row][vc_row][vc_column][vc_separator border_width=”5″][/vc_column][/vc_row][vc_row][vc_column width=”2/3″][vc_custom_heading text=”1 hr” use_theme_fonts=”yes”][vc_column_text]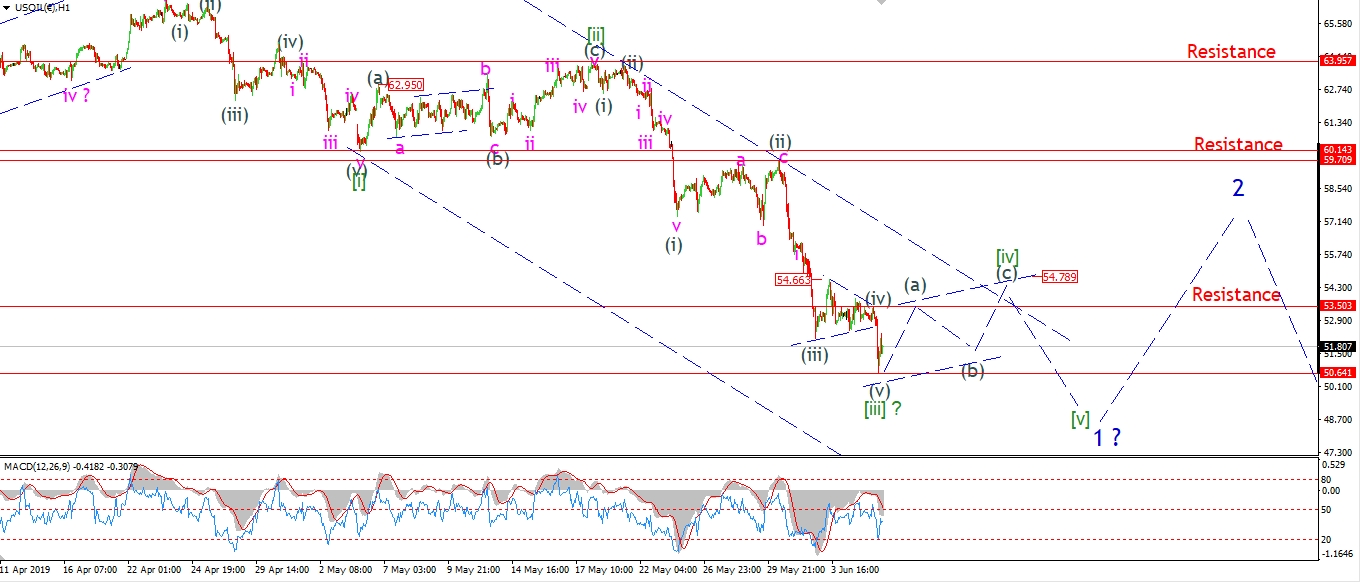 [/vc_column_text][/vc_column][vc_column width=”1/3″][vc_custom_heading text=”4 Hours” use_theme_fonts=”yes”][vc_column_text]
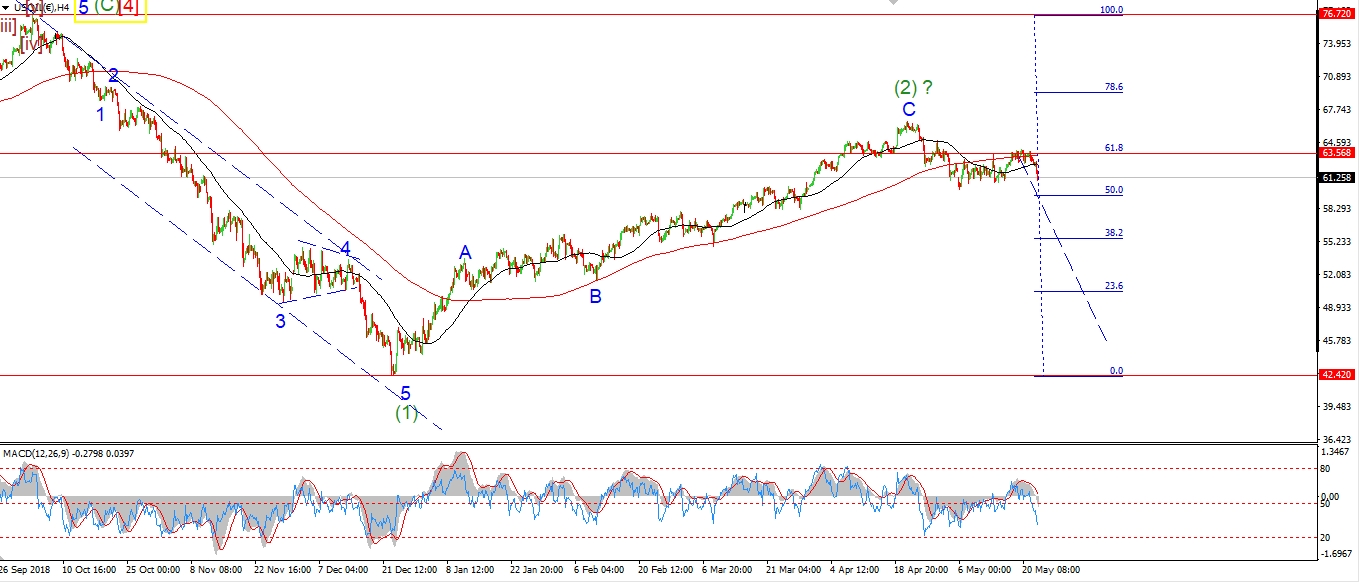 [/vc_column_text][vc_custom_heading text=”Daily” use_theme_fonts=”yes”][vc_column_text]
 [/vc_column_text][/vc_column][/vc_row]
[vc_row][vc_column][vc_column_text]
Crude was hit with further selling early today.
The price dropped below the previous low at 52.15 and ruled out the previous short term count.
I have switched to the alternate count this evening,
and todays lows are now viewed as the completion of wave [iii] green.
This new wave count allows for further declines in wave [v]
which should break below 50.64 level again to complete the larger wave ‘1’ down.
Once wave ‘1’ completes,
that will allow for a reasonable correction higher again in wave ‘2’ blue.
But I am getting ahead of myself now!
Tomorrow;
Wave [iv] green should begin soon and correct higher in three waves as shown.
Todays spike higher may even be the initial move of wave [iv].
Watch for wave (a) of [iv] to push up to initial resistance at 53.50.
[/vc_column_text][/vc_column][/vc_row]
[vc_row][vc_column][vc_separator border_width=”5″][/vc_column][/vc_row][vc_row][vc_column][vc_column_text]
US 10 yr Treasuries.
[/vc_column_text][/vc_column][/vc_row][vc_row][vc_column][vc_separator border_width=”5″][/vc_column][/vc_row][vc_row][vc_column width=”2/3″][vc_custom_heading text=”1 hr” use_theme_fonts=”yes”][vc_column_text] [/vc_column_text][/vc_column][vc_column width=”1/3″][vc_custom_heading text=”4 Hours” use_theme_fonts=”yes”][vc_column_text]
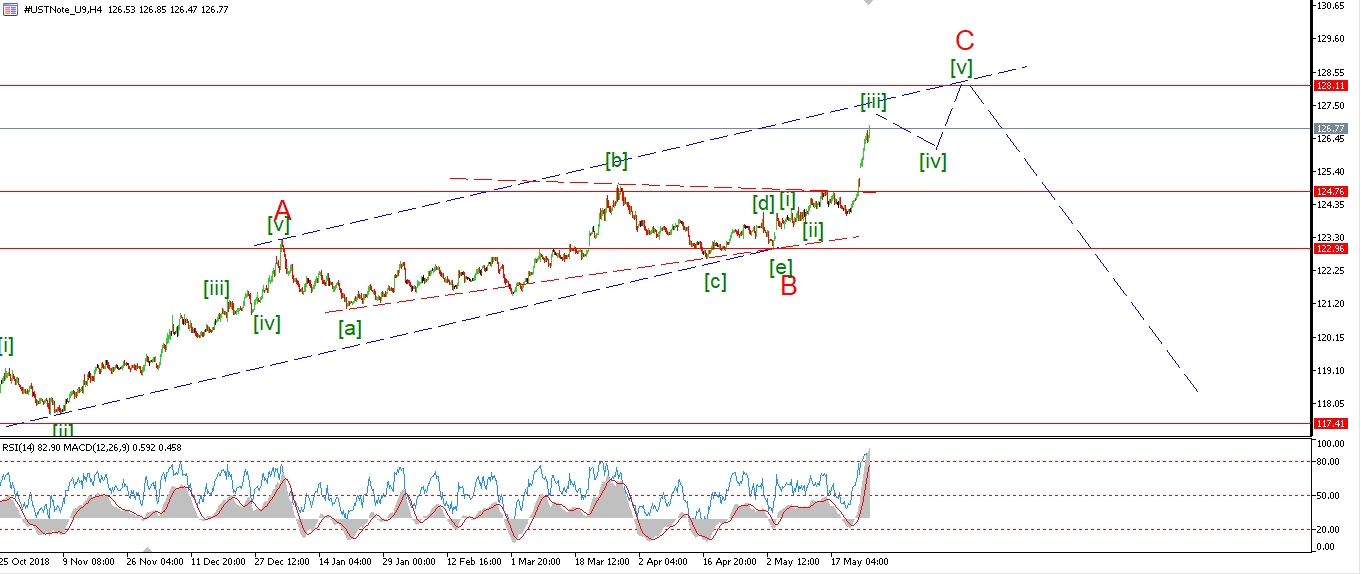 [/vc_column_text][vc_custom_heading text=”Daily” use_theme_fonts=”yes”][vc_column_text]
 [/vc_column_text][/vc_column][/vc_row]
[vc_row][vc_column][vc_column_text]
It looks like wave (iv) grey is creating a larger flat correction off the recent wave (iii) high.
This correction should trace out a 3,3,5 internal pattern.
Wave ‘c’ of (iv) should drop back into the lower trendline again tomorrow.
Once this pattern completes,
we should see a further rise in wave (v) to complete wave [iii] of ‘C’.
Tomorrow;
Watch for wave (iv) to close out with a drop into 126.50.
[/vc_column_text][/vc_column][/vc_row]
[vc_row][vc_column][vc_separator border_width=”5″][/vc_column][/vc_row][vc_row][vc_column][vc_column_text]
SILVER
[/vc_column_text][/vc_column][/vc_row][vc_row][vc_column][vc_separator border_width=”5″][/vc_column][/vc_row][vc_row][vc_column width=”2/3″][vc_custom_heading text=”1 hr” use_theme_fonts=”yes”][vc_column_text] [/vc_column_text][/vc_column][vc_column width=”1/3″][vc_custom_heading text=”4 Hours” use_theme_fonts=”yes”][vc_column_text]
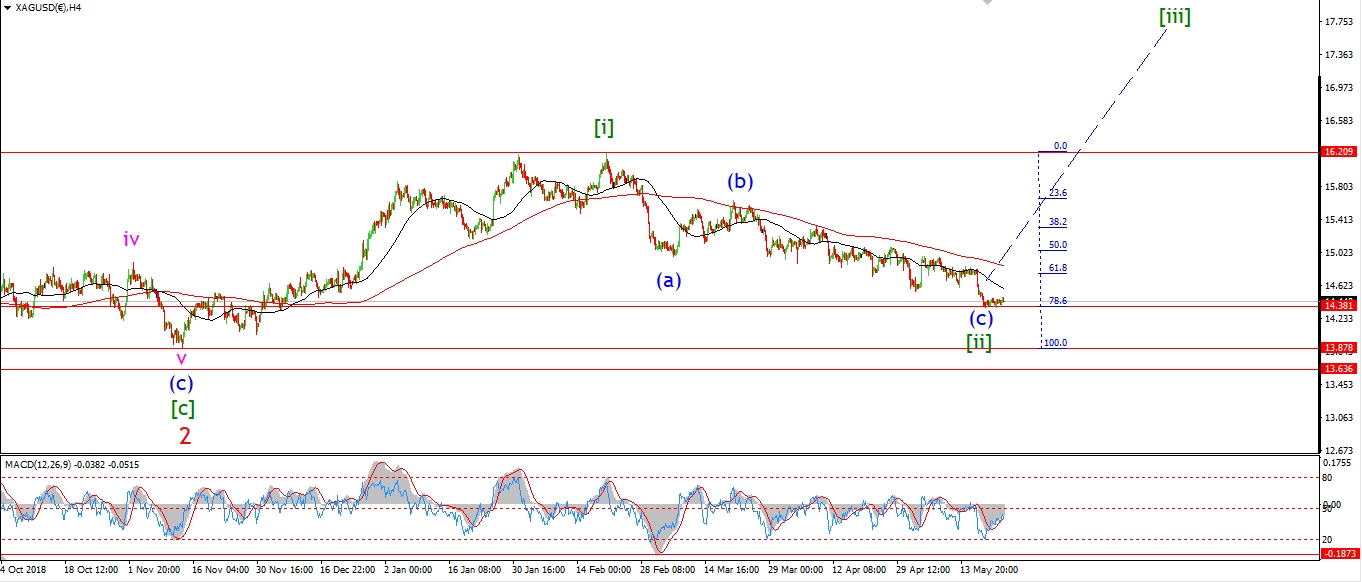 [/vc_column_text][vc_custom_heading text=”Daily” use_theme_fonts=”yes”][vc_column_text]
 [/vc_column_text][/vc_column][/vc_row]
[vc_row][vc_column][vc_column_text]
Silver broke above 15.00 again today with a spike higher to complete wave ‘i’ pink.
The final rise in wave ‘5’ of ‘i’ took the form of and ending diagonal.
Off the high the price dropped sharply to begin wave ‘ii’.
This evenings lows are labelled wave ‘a’ of ‘ii’
with wave ‘b’ and ‘c’ left to complete a three wave correction over the coming days.
Wave ‘ii’ should create a bullish higher low,
and a good opportunity to go long off the wave ‘ii’ low.
Tomorrow;
Watch for wave ‘b’ to rise back above 14.85 again and complete below 15.03.
[/vc_column_text][/vc_column][/vc_row]
[vc_row][vc_column][vc_separator border_width=”5″][/vc_column][/vc_row][vc_row][vc_column][vc_column_text]
S&P 500.
[/vc_column_text][/vc_column][/vc_row][vc_row][vc_column][vc_separator border_width=”5″][/vc_column][/vc_row][vc_row][vc_column width=”2/3″][vc_custom_heading text=”1 hr” use_theme_fonts=”yes”][vc_column_text] [/vc_column_text][/vc_column][vc_column width=”1/3″][vc_custom_heading text=”4 Hours” use_theme_fonts=”yes”][vc_column_text]
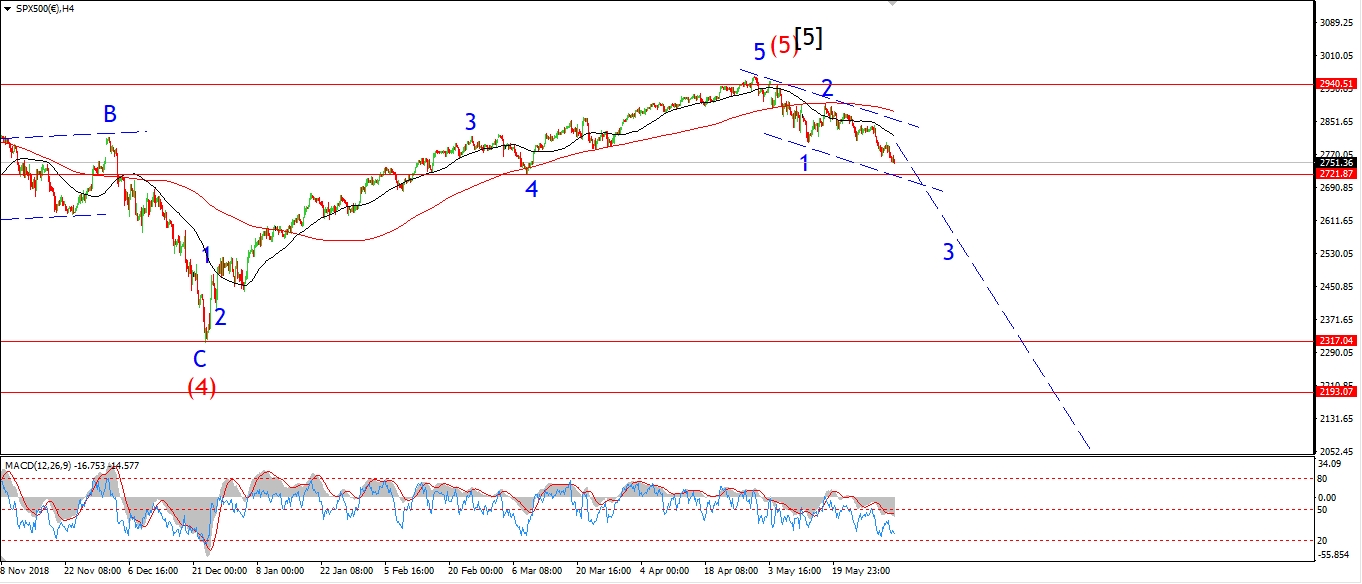 [/vc_column_text][vc_custom_heading text=”Daily” use_theme_fonts=”yes”][vc_column_text]
 [/vc_column_text][/vc_column][/vc_row]
[vc_row][vc_column][vc_column_text]
I have switched to a similar alternate count in the S&P this evening.
The Rally off the lows has invalidated the idea of a wave [iv] recovery,
and now this rally is viewed as wave (a) of [ii].
The new alternate count is a little less likely,
but the sharp rally this week does fit the character of a [c] wave.
Wave [c] in the alternate count would complete a larger running flat wave ‘2’ blue.
Both wave counts call for this rally to end below 2891.
And both wave counts call for a larger decline phase to begin in wave ‘3’ soon.
Tomorrow;
The current count I have shown tonight is part of a three wave recovery in wave [ii] green.
The rally in wave (a) has almost hit the 61.8% retracement level
of the decline in wave [i] green.
So this rally should now give way to a drop in at least wave (b) of [ii].
But possibly even the beginning of wave ‘3’ down,
as shown by the alternate count.
Watch for wave (b) to begin tomorrow.
[/vc_column_text][/vc_column][/vc_row]
[vc_row][vc_column][vc_separator border_width=”5″][/vc_column][/vc_row]