[vc_row][vc_column][vc_separator border_width=”5″][/vc_column][/vc_row]
[vc_row][vc_column][vc_column_text]
Good evening all.
[/vc_column_text][/vc_column][/vc_row]
[vc_row][vc_column][vc_separator border_width=”5″][/vc_column][/vc_row]
[vc_row][vc_column][vc_column_text]
EURUSD
[/vc_column_text][/vc_column][/vc_row]
[vc_row][vc_column][vc_separator border_width=”5″][/vc_column][/vc_row][vc_row][vc_column width=”2/3″][vc_custom_heading text=”1 hr” use_theme_fonts=”yes”][vc_column_text] [/vc_column_text][/vc_column][vc_column width=”1/3″][vc_custom_heading text=”4 Hours” use_theme_fonts=”yes”][vc_column_text]
 [/vc_column_text][vc_custom_heading text=”Daily” use_theme_fonts=”yes”][vc_column_text]
 [/vc_column_text][/vc_column][/vc_row]
[vc_row][vc_column][vc_column_text]
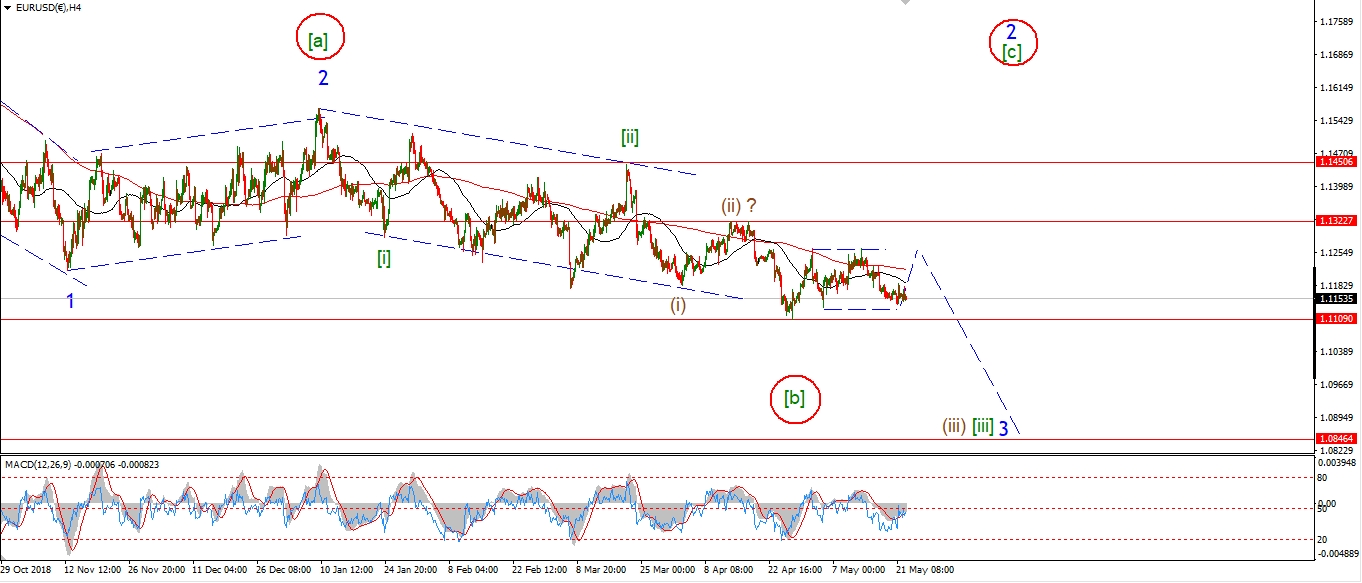
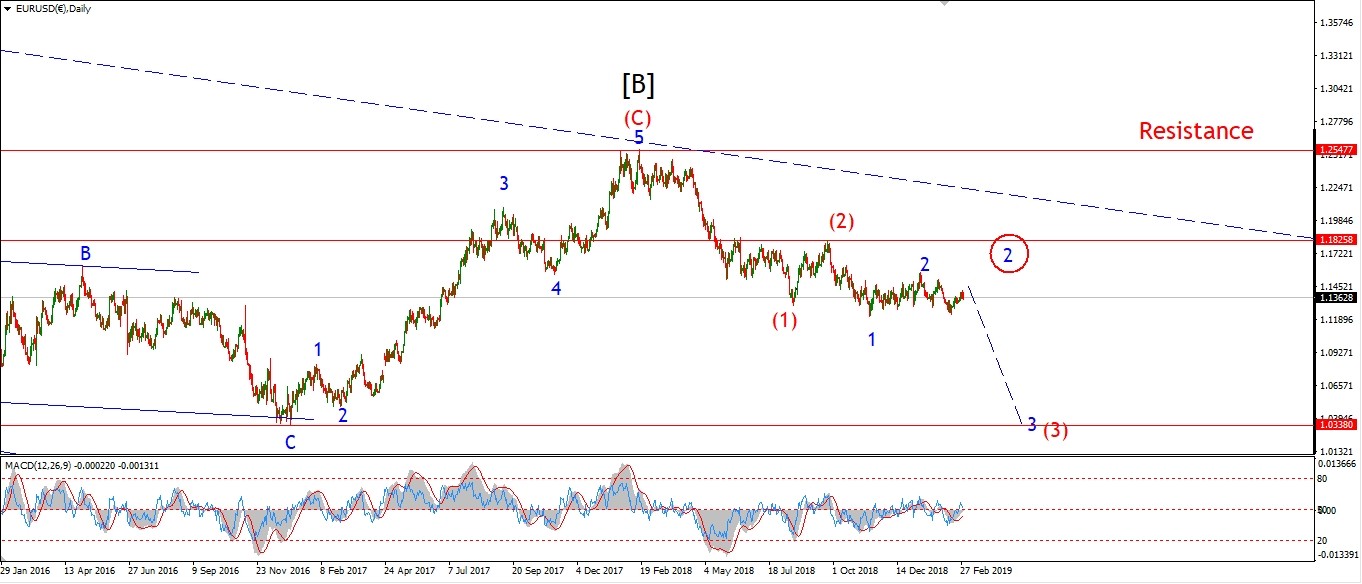
EURUSD popped above 1.1264 today and has backed off that high so far.
The decline off wave ‘c’ is not yet in five waves,
which would indicate that a turn down into wave ‘iii’ has begun.
But that structure could develop quite easily,
so it is worth being wary now, as wave ‘iii’ down could begin pretty soon.
The first action to look for to indicate a turn into wave ‘iii’,
is a five wave decline and a corrective lower high off 1.1277 as shown on the short term chart.
Tomorrow;
Watch for wave ‘c’ of ‘ii’ to hold below 1.1324.
If the price moves impulsively off todays highs that will signal wave ‘iii’ down has begun.
[/vc_column_text][/vc_column][/vc_row]
[vc_row][vc_column][vc_separator border_width=”5″][/vc_column][/vc_row][vc_row][vc_column][vc_column_text]
GBPUSD
[/vc_column_text][/vc_column][/vc_row][vc_row][vc_column][vc_separator border_width=”5″][/vc_column][/vc_row][vc_row][vc_column width=”2/3″][vc_custom_heading text=”1 hr” use_theme_fonts=”yes”][vc_column_text] [/vc_column_text][/vc_column][vc_column width=”1/3″][vc_custom_heading text=”4 Hours” use_theme_fonts=”yes”][vc_column_text]
 [/vc_column_text][vc_custom_heading text=”Daily” use_theme_fonts=”yes”][vc_column_text]
 [/vc_column_text][/vc_column][/vc_row]
[vc_row][vc_column][vc_column_text]
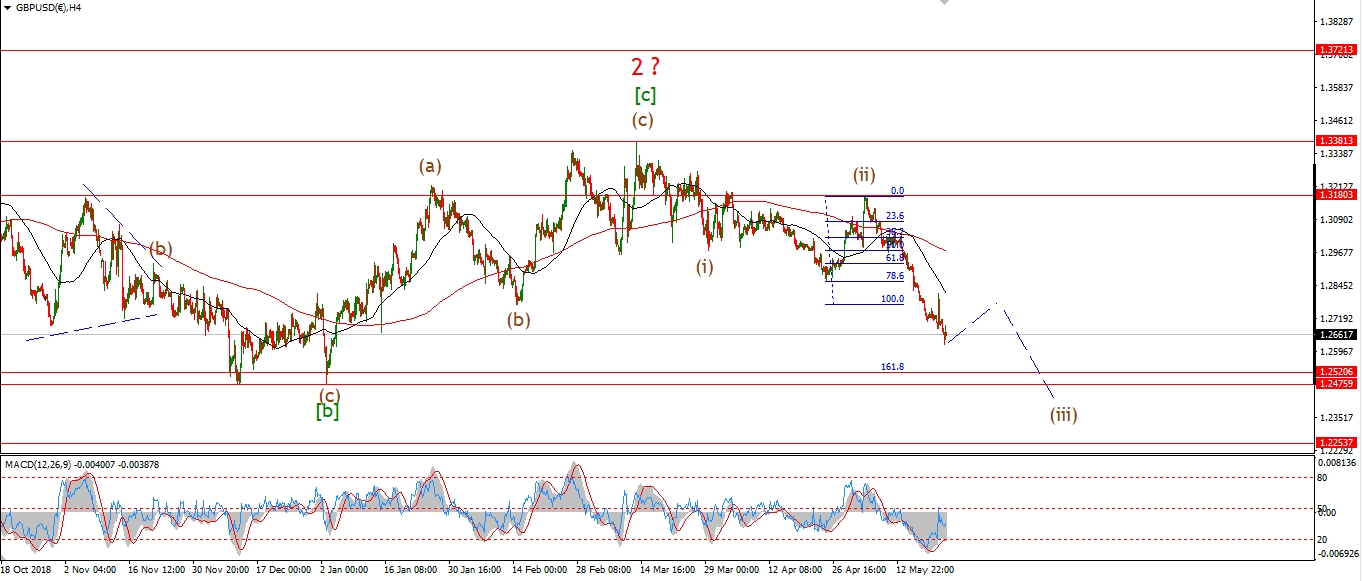
I have elaborated on the wave ‘iv’ triangle idea this evening.
The rise off wave ‘b’ is very corrective looking,
as the internal bars continually overlap without much net gain in price.
The price range has also continued to contract as you would expect in a triangle.
IF this is a triangle in wave ‘iv’,
then the high at wave ‘a’ should hold at 1.2747.
A break of that level will invalidate the triangle idea.
Once wave ‘iv’ completes in what ever form it will take,
then we can expect wave ‘v’ to carry price lower again ba k towards 1.2400.
Tomorrow;
Watch for wave ‘c’ to complete below 1.2747.
Wave ‘d’ and ‘e’ should then contract further to complete wave ‘iv’.
[/vc_column_text][/vc_column][/vc_row]
[vc_row][vc_column][vc_separator border_width=”5″][/vc_column][/vc_row][vc_row][vc_column][vc_column_text]
USDJPY
[/vc_column_text][/vc_column][/vc_row][vc_row][vc_column][vc_separator border_width=”5″][/vc_column][/vc_row][vc_row][vc_column width=”2/3″][vc_custom_heading text=”1 hr” use_theme_fonts=”yes”][vc_column_text] [/vc_column_text][/vc_column][vc_column width=”1/3″][vc_custom_heading text=”4 Hours” use_theme_fonts=”yes”][vc_column_text]
 [/vc_column_text][vc_custom_heading text=”Daily” use_theme_fonts=”yes”][vc_column_text]
 [/vc_column_text][/vc_column][/vc_row]
[vc_row][vc_column][vc_column_text]
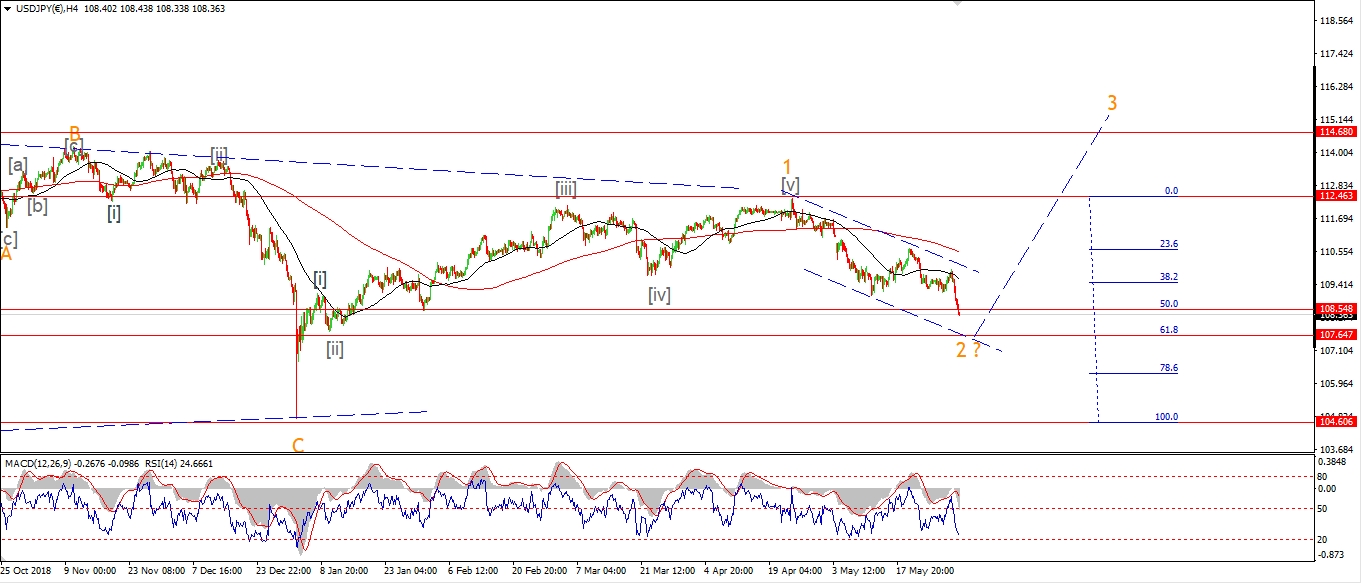
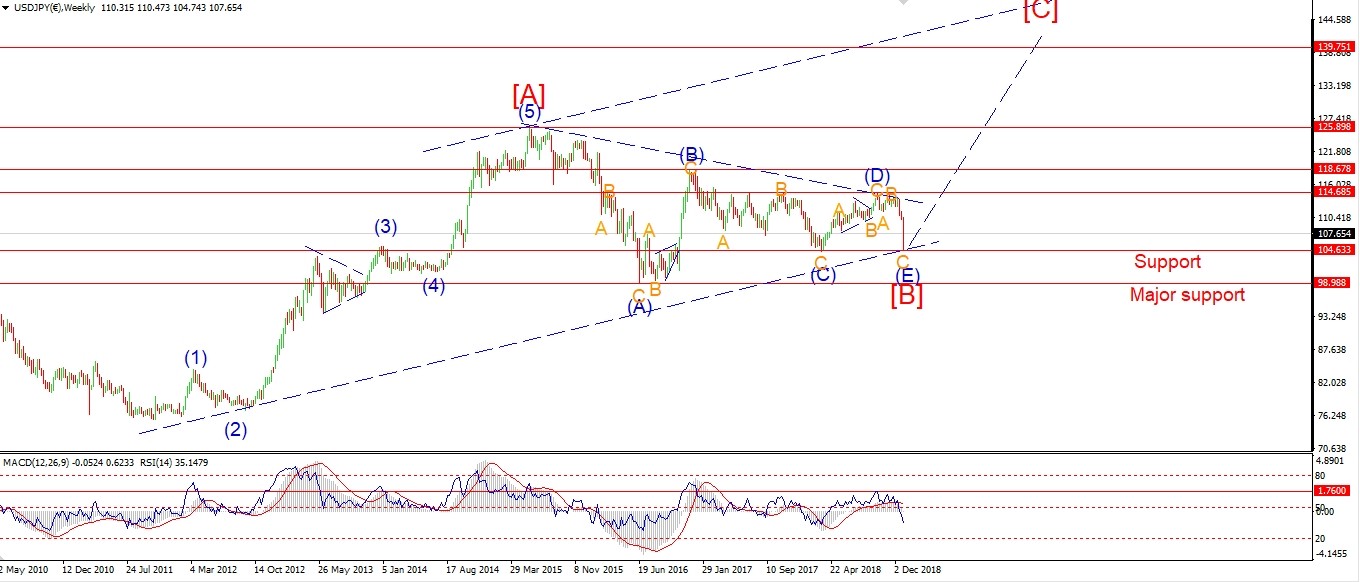
Wave (iv) may be complete this evening as a running flat correction.
The price did rise off the overnight lows today,
only to create a lower high labelled wave ‘c’ of (iv).
The decline this evening should prove to be wave ‘v’ of (v) and complete at about 107.27.
This decline should also prove to be the last in leg down in wave [c] of ‘2’.
Once the target is reached in wave [c],
I will then be looking higher again to begin wave ‘3’ up.
Tomorrow;
Watch for wave (v) to push lower into support at 107.27.
We may even get the initial spike higher to begin wave (i) tomorrow.
[/vc_column_text][/vc_column][/vc_row]
[vc_row][vc_column][vc_separator border_width=”5″][/vc_column][/vc_row][vc_row][vc_column][vc_column_text]
DOW JONES INDUSTRIALS
[/vc_column_text][/vc_column][/vc_row][vc_row][vc_column][vc_separator border_width=”5″][/vc_column][/vc_row][vc_row][vc_column width=”2/3″][vc_custom_heading text=”1 hr” use_theme_fonts=”yes”][vc_column_text] [/vc_column_text][/vc_column][vc_column width=”1/3″][vc_custom_heading text=”4 Hours” use_theme_fonts=”yes”][vc_column_text]
 [/vc_column_text][vc_custom_heading text=”Daily” use_theme_fonts=”yes”][vc_column_text]
 [/vc_column_text][/vc_column][/vc_row]
[vc_row][vc_column][vc_column_text]
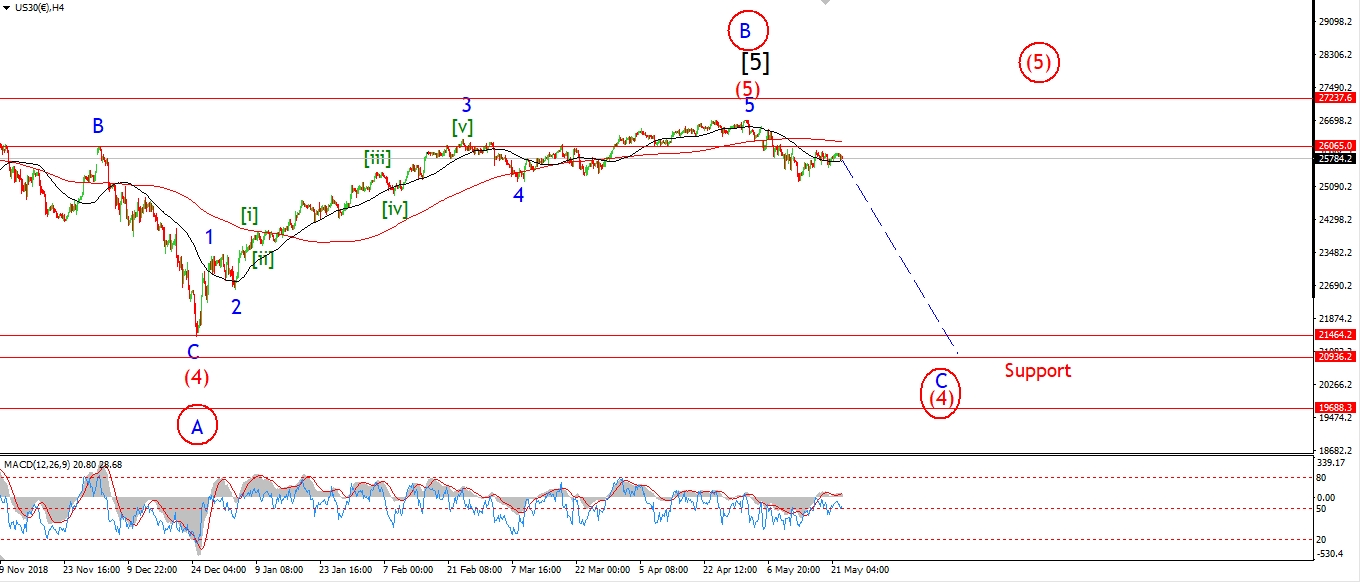
Wave ‘c’ of (iv) carried higher than I expected today.
And wave (iv) is back at resistance formed by the previous wave [i] and wave ‘iv’.
Although this is a sizable rally,
the action is still within the range for the current wave count.
And wave (v) of [iii] is expected to carry the price lower again tomorrow.
I have shown a viable alternate count this evening also.
This involves a series of 1,2, waves off the high.
Where this evenings highs are labelled wave [ii].
And another major decline phase is expected in wave [iii] of ‘3’.
If the next decline forms another extending wave pattern,
I will switch to this alternate count.
Tomorrow;
Watch for wave (iv) of [iii] to complete at these highs.
A decline back below 25000 again will signal that wave (v) of [iii] has begun.
[/vc_column_text][/vc_column][/vc_row]
[vc_row][vc_column][vc_separator border_width=”5″][/vc_column][/vc_row][vc_row][vc_column][vc_column_text]
GOLD
[/vc_column_text][/vc_column][/vc_row][vc_row][vc_column][vc_separator border_width=”5″][/vc_column][/vc_row][vc_row][vc_column width=”2/3″][vc_custom_heading text=”1 hr” use_theme_fonts=”yes”][vc_column_text] [/vc_column_text][/vc_column][vc_column width=”1/3″][vc_custom_heading text=”4 Hours” use_theme_fonts=”yes”][vc_column_text]
 [/vc_column_text][vc_custom_heading text=”Daily” use_theme_fonts=”yes”][vc_column_text]
 [/vc_column_text][/vc_column][/vc_row]
[vc_row][vc_column][vc_column_text]
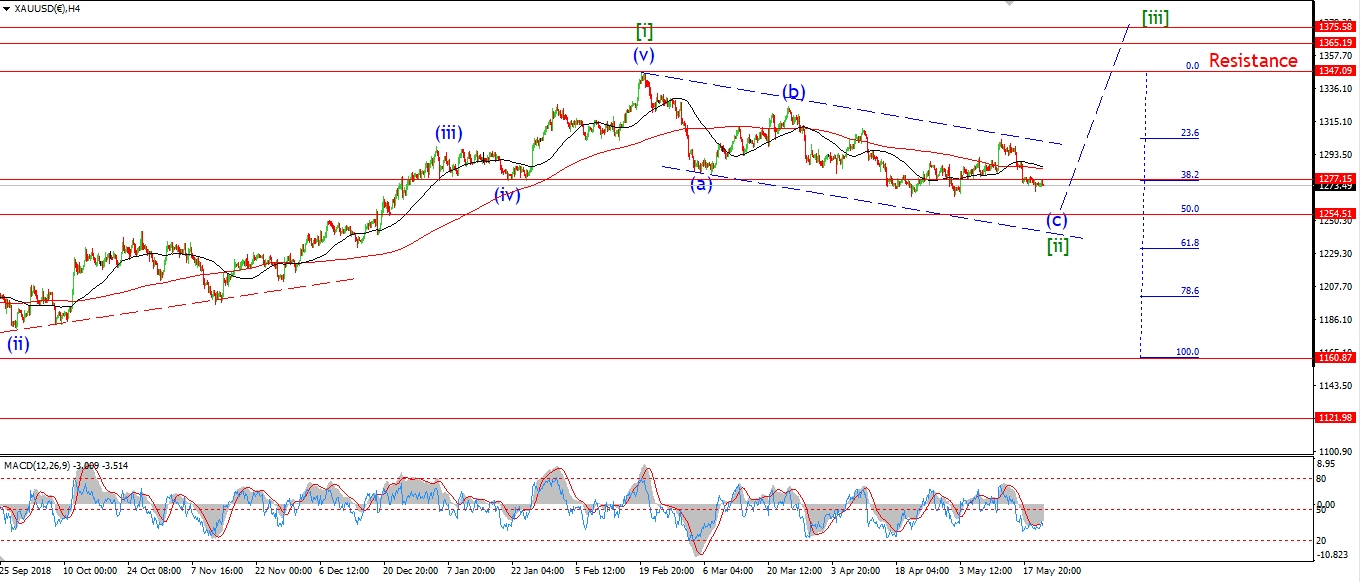
Gold has corrected sideways for most of the session today.
The price is holding above that support/resistance line at 1324 this evening.
I have labelled the high as wave ‘3’ of ‘iii’,
and this corrective action now occurring in wave ‘4’ of ‘iii’.
It is too early to say if wave ‘4’ of ‘iii’ is complete yet,
but I do expect wave ‘4’ to hold above 1310 once it is complete.
And then price should rally again in wave ‘5’ to complete the larger wave ‘iii’.
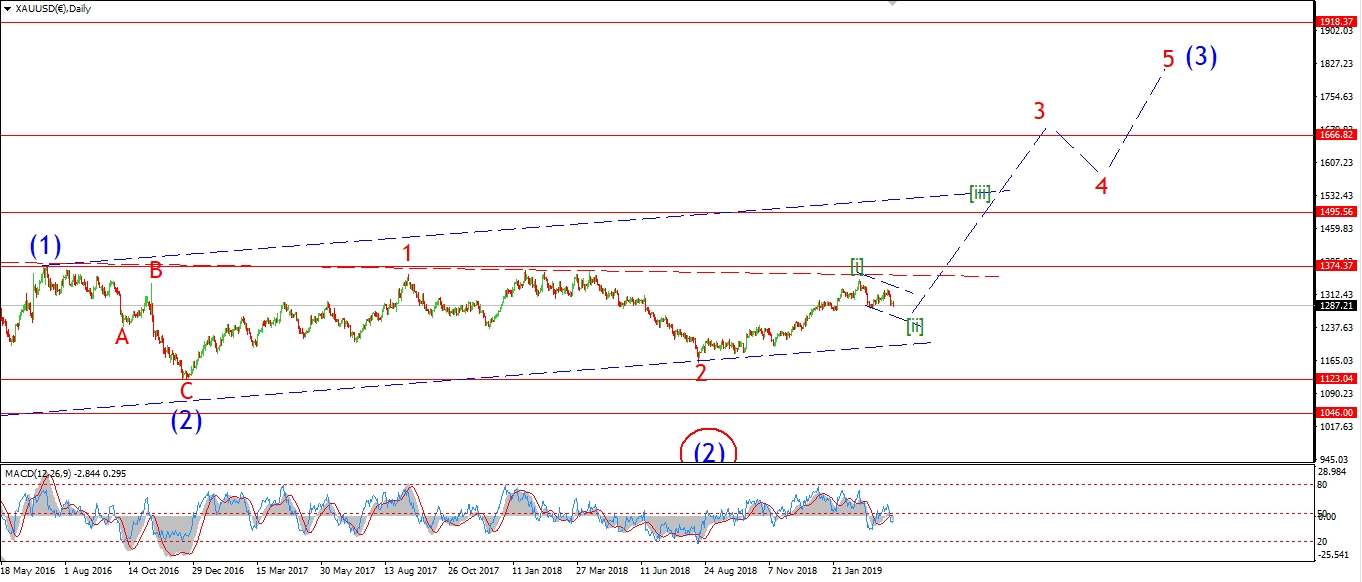
This action is all reinforcing the bullish count right now.
And the recent rally should prove to be just the beginning of a long bull run in Gold.
It is interesting to note that a few bullish sessions
has recovered most of the declines off the February highs.
This is another hint at the power of the wave ‘3’ rally to come.
One step at a time though!
Tomorrow;
Watch for wave ‘4’ to complete above 1310.
A push towards 1340 would complete wave ‘5’ of ‘iii’.
[/vc_column_text][/vc_column][/vc_row]
[vc_row][vc_column][vc_separator border_width=”5″][/vc_column][/vc_row][vc_row][vc_column][vc_column_text]
U.S CRUDE OIL
[/vc_column_text][/vc_column][/vc_row][vc_row][vc_column][vc_separator border_width=”5″][/vc_column][/vc_row][vc_row][vc_column width=”2/3″][vc_custom_heading text=”1 hr” use_theme_fonts=”yes”][vc_column_text] [/vc_column_text][/vc_column][vc_column width=”1/3″][vc_custom_heading text=”4 Hours” use_theme_fonts=”yes”][vc_column_text]
 [/vc_column_text][vc_custom_heading text=”Daily” use_theme_fonts=”yes”][vc_column_text]
 [/vc_column_text][/vc_column][/vc_row]
[vc_row][vc_column][vc_column_text]
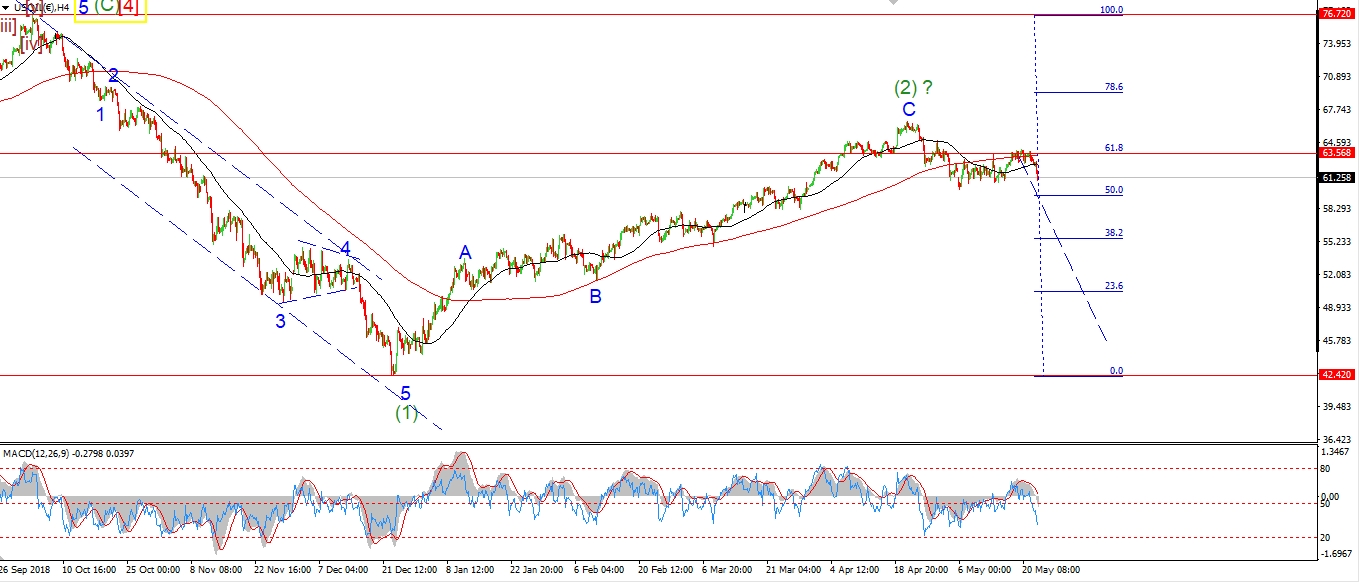
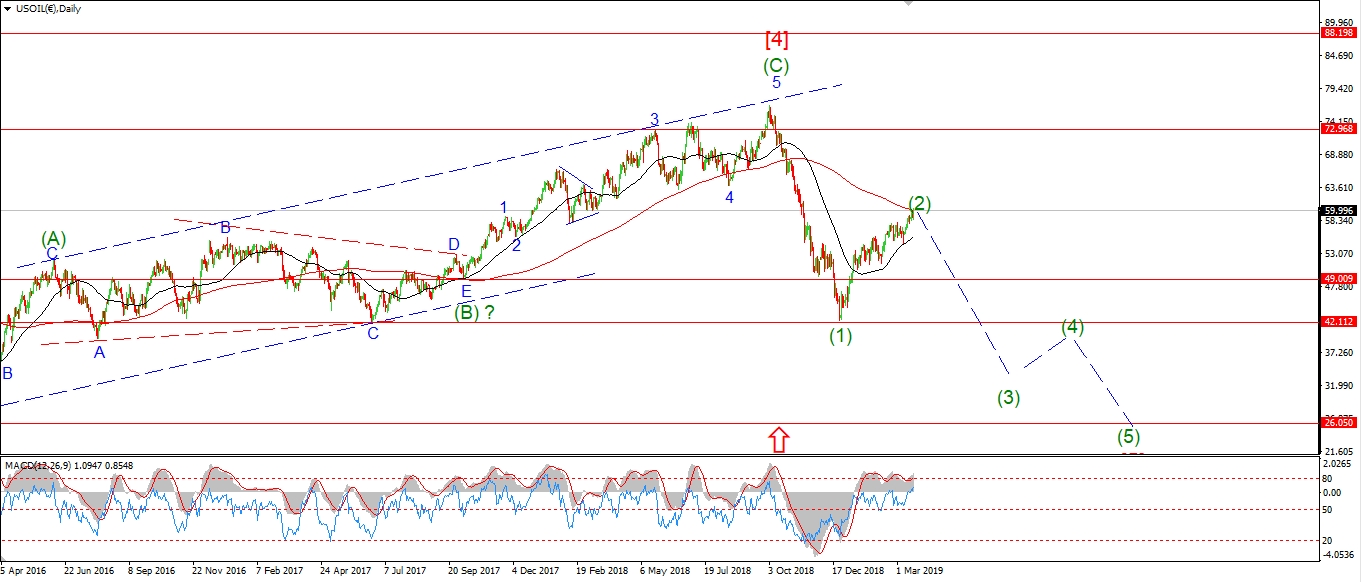
Crude seems pinned to the wave [iii] lows over the last few days.
As there is a real fear beginning to build in the market now.
Recession warnings are coming week after week,
and the general bullish case for crude is falling apart at the seams.
The price has recovered slightly off the wave (b) low today to begin wave (c).
I do expect wave (c) to rally above 54.66 at a minimum.
And this will complete a clear three wave correction in wave [iv] green.
Once this correction does complete,
wave [v] of ‘1’ should then carry the price back down towards the 50.00 handle again.
Then we will have a clear five wave pattern in place off the April highs.
Tomorrow;
Watch for Wave (c) to fill the trend channel and complete wave [iv] green.
[/vc_column_text][/vc_column][/vc_row]
[vc_row][vc_column][vc_separator border_width=”5″][/vc_column][/vc_row][vc_row][vc_column][vc_column_text]
US 10 yr Treasuries.
[/vc_column_text][/vc_column][/vc_row][vc_row][vc_column][vc_separator border_width=”5″][/vc_column][/vc_row][vc_row][vc_column width=”2/3″][vc_custom_heading text=”1 hr” use_theme_fonts=”yes”][vc_column_text] [/vc_column_text][/vc_column][vc_column width=”1/3″][vc_custom_heading text=”4 Hours” use_theme_fonts=”yes”][vc_column_text]
 [/vc_column_text][vc_custom_heading text=”Daily” use_theme_fonts=”yes”][vc_column_text]
 [/vc_column_text][/vc_column][/vc_row]
[vc_row][vc_column][vc_column_text]
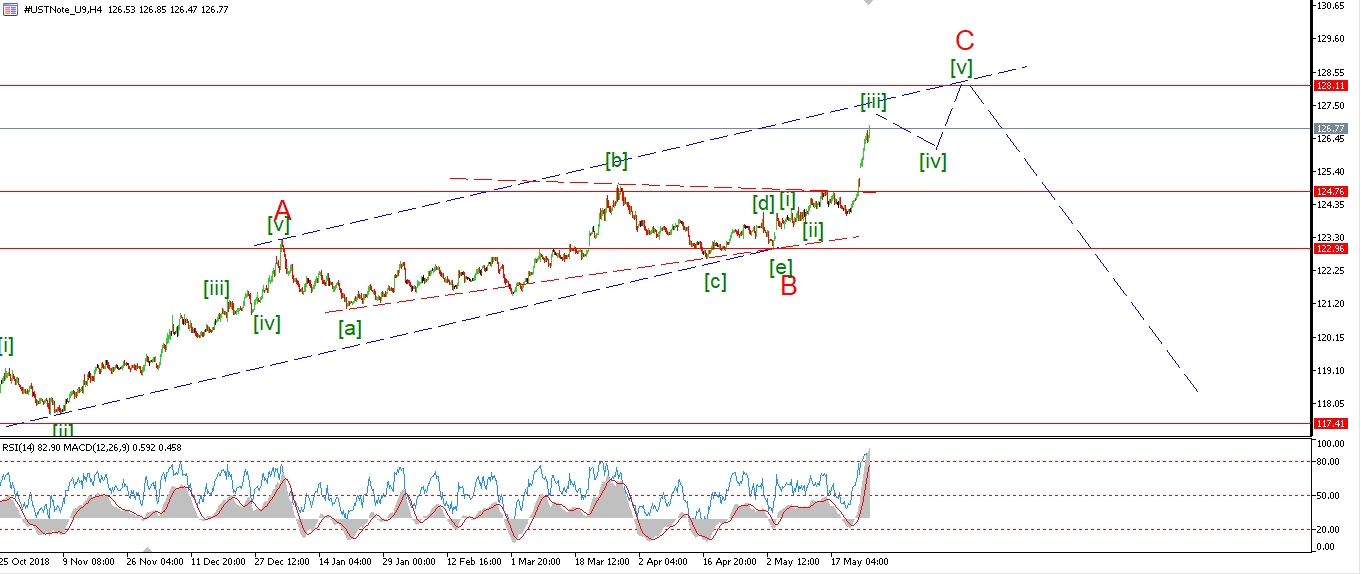
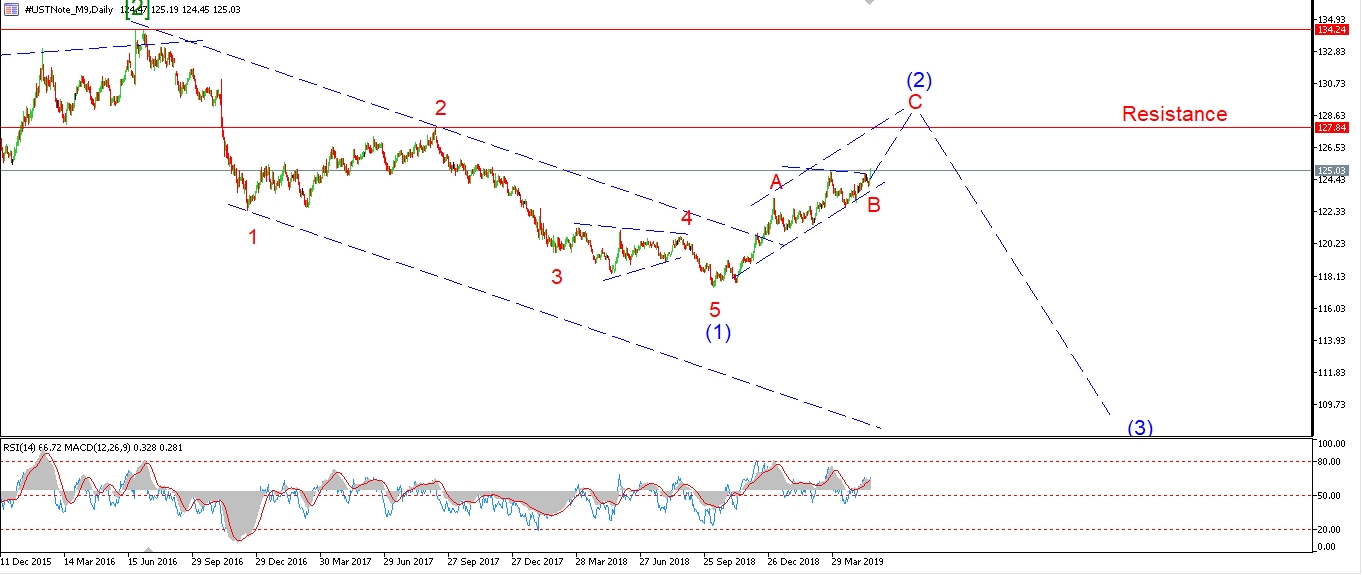
Wave (iv) dropped again today to a slight new low below wave ‘a’ pink.
This decline is labelled wave ‘c’ of (iv),
and the correction has now completed a three wave pattern.
Wave (iv) is still relatively small when compared to wave (ii),
so the corrective action may continue to create a larger structure over the coming days.
The price is up off the lows of the session now,
so if we see a rally above 127.44 again, that will signal wave (v) has begun.
Tomorrow;
watch for a sign that wave (iv) has completed with a break of 127.44.
Even if wave (iv) has completed the rally in wave (v) will be short lived.
As we are likely to enter a larger correction in wave [iv] green starting next week.
[/vc_column_text][/vc_column][/vc_row]
[vc_row][vc_column][vc_separator border_width=”5″][/vc_column][/vc_row][vc_row][vc_column][vc_column_text]
SILVER
[/vc_column_text][/vc_column][/vc_row][vc_row][vc_column][vc_separator border_width=”5″][/vc_column][/vc_row][vc_row][vc_column width=”2/3″][vc_custom_heading text=”1 hr” use_theme_fonts=”yes”][vc_column_text] [/vc_column_text][/vc_column][vc_column width=”1/3″][vc_custom_heading text=”4 Hours” use_theme_fonts=”yes”][vc_column_text]
 [/vc_column_text][vc_custom_heading text=”Daily” use_theme_fonts=”yes”][vc_column_text]
 [/vc_column_text][/vc_column][/vc_row]
[vc_row][vc_column][vc_column_text]
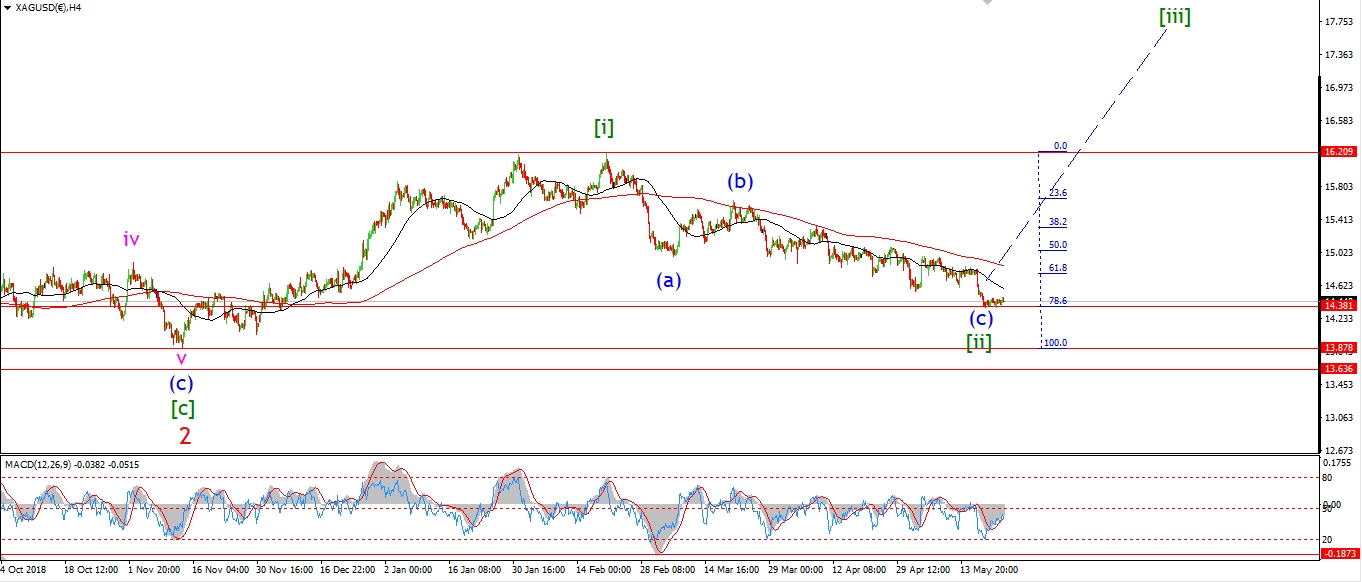
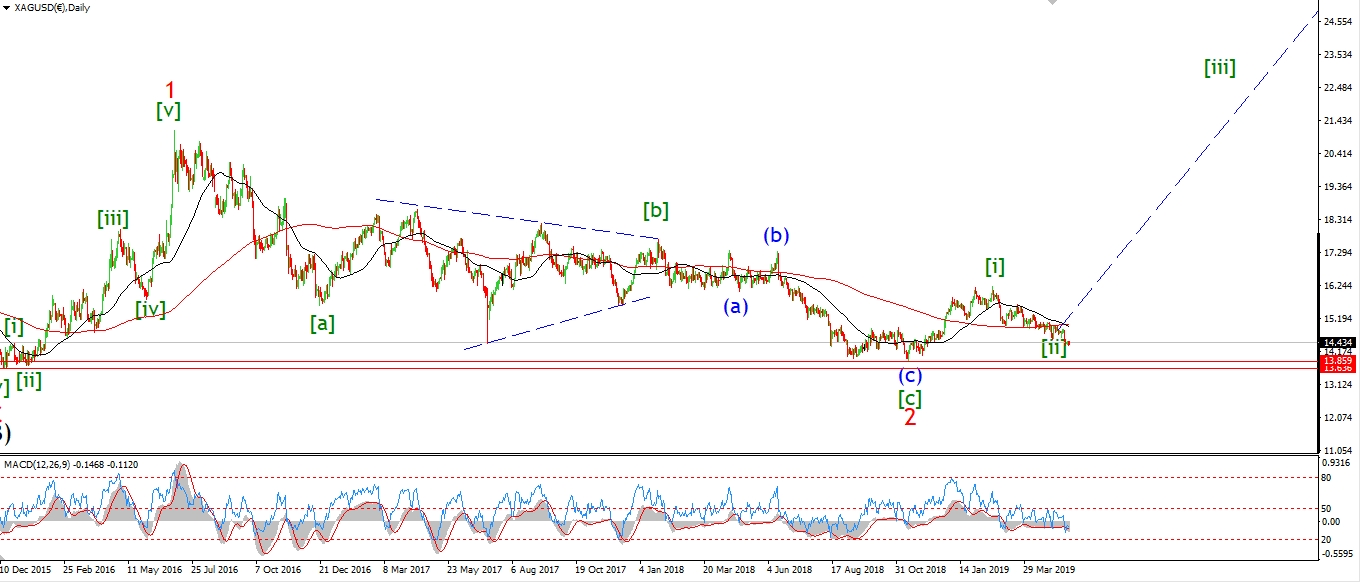
Silver has rallied off the session low to push to a slight new high this evening.
The rally today is viewed as wave ‘5’ of ‘i’.
Price is now close to breaking above that initial resistance level
formed by the previous wave ‘iv’ triangle at 14.85.
A break above this level will be a strong signal that the corrective phase is now over in silver.
And then I will look for a bullish higher low to form in wave ‘ii’.
And that action will complete a bullish signal for silver in the coming week.
Tomorrow;
Watch for wave ‘i’ to push above 14.85 to complete.
A corrective decline in wave ‘ii’ should then begin.
[/vc_column_text][/vc_column][/vc_row]
[vc_row][vc_column][vc_separator border_width=”5″][/vc_column][/vc_row][vc_row][vc_column][vc_column_text]
S&P 500.
[/vc_column_text][/vc_column][/vc_row][vc_row][vc_column][vc_separator border_width=”5″][/vc_column][/vc_row][vc_row][vc_column width=”2/3″][vc_custom_heading text=”1 hr” use_theme_fonts=”yes”][vc_column_text] [/vc_column_text][/vc_column][vc_column width=”1/3″][vc_custom_heading text=”4 Hours” use_theme_fonts=”yes”][vc_column_text]
 [/vc_column_text][vc_custom_heading text=”Daily” use_theme_fonts=”yes”][vc_column_text]
 [/vc_column_text][/vc_column][/vc_row]
[vc_row][vc_column][vc_column_text]
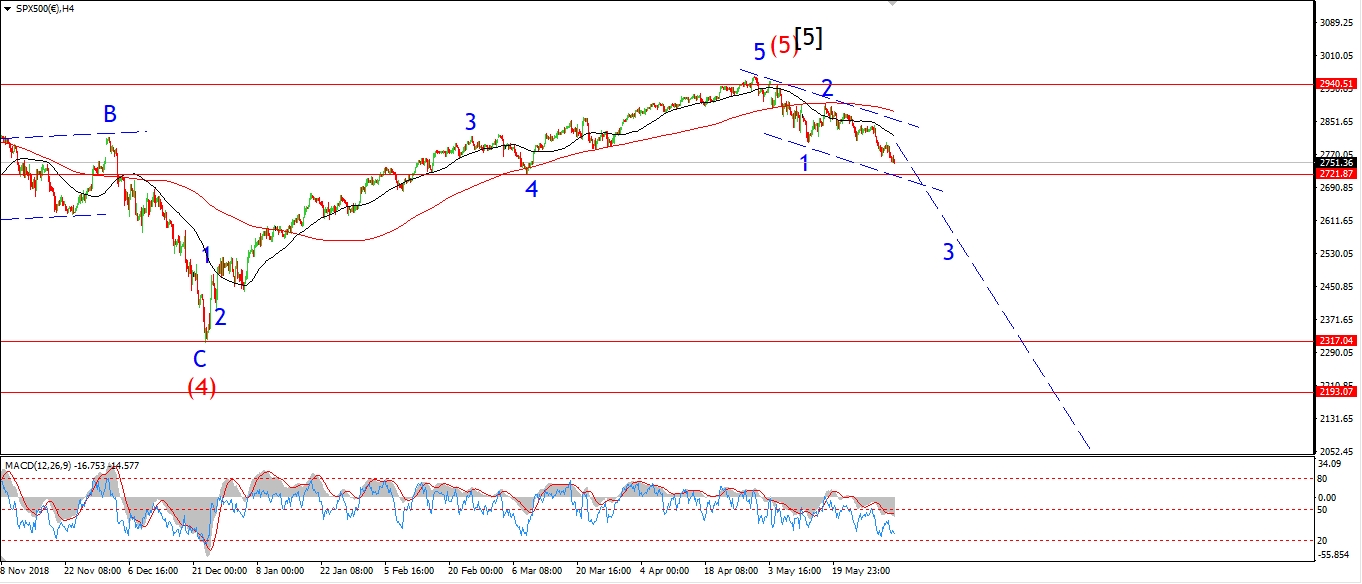
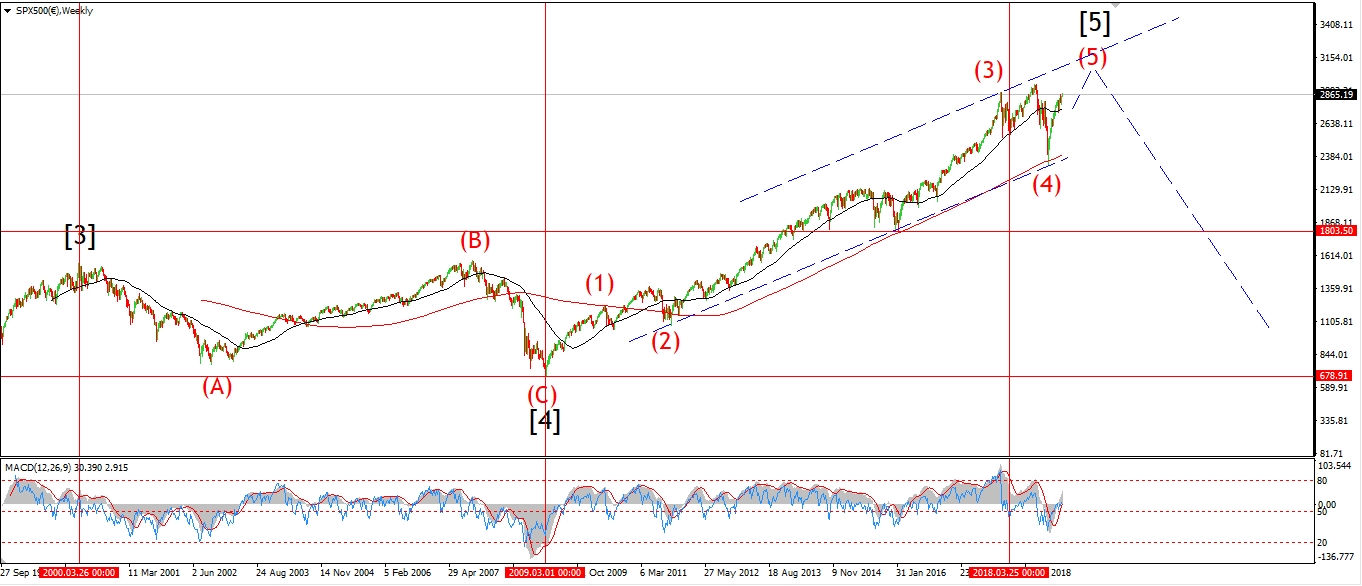
I have shown the same alternate count this evening for the S&P as in the DOW.
The decline of the highs can be viewed as a larger impulse wave still only developing.
If the alternate count is correct,
then wave [iii] of ‘3’ is only around the corner.
And this scenario has serious bearish potential.
The rally today is viewed as wave ‘c’ of (iv) with a decline in wave (v) still expected this week
Today’s rally has reached the previous fourth wave resistance level.
And the reached back to the upper trend channel line again.
Both of these levels should offer resistance to the rally in wave (iv).
Tomorrow;
Watch for wave (iv) to close out and drop back into the trend channel again.
A small lower high off the wave (iv) top will signal wave (v) has begun.
[/vc_column_text][/vc_column][/vc_row]
[vc_row][vc_column][vc_separator border_width=”5″][/vc_column][/vc_row]