
[vc_row][vc_column][vc_separator border_width=”5″][/vc_column][/vc_row]
[vc_row][vc_column][vc_column_text]
Hi folks,
welcome to a new week.
[/vc_column_text][/vc_column][/vc_row]
[vc_row][vc_column][vc_separator border_width=”5″][/vc_column][/vc_row]
[vc_row][vc_column][vc_column_text]
EURUSD
[/vc_column_text][/vc_column][/vc_row]
[vc_row][vc_column][vc_separator border_width=”5″][/vc_column][/vc_row][vc_row][vc_column width=”2/3″][vc_custom_heading text=”1 hr” use_theme_fonts=”yes”][vc_column_text]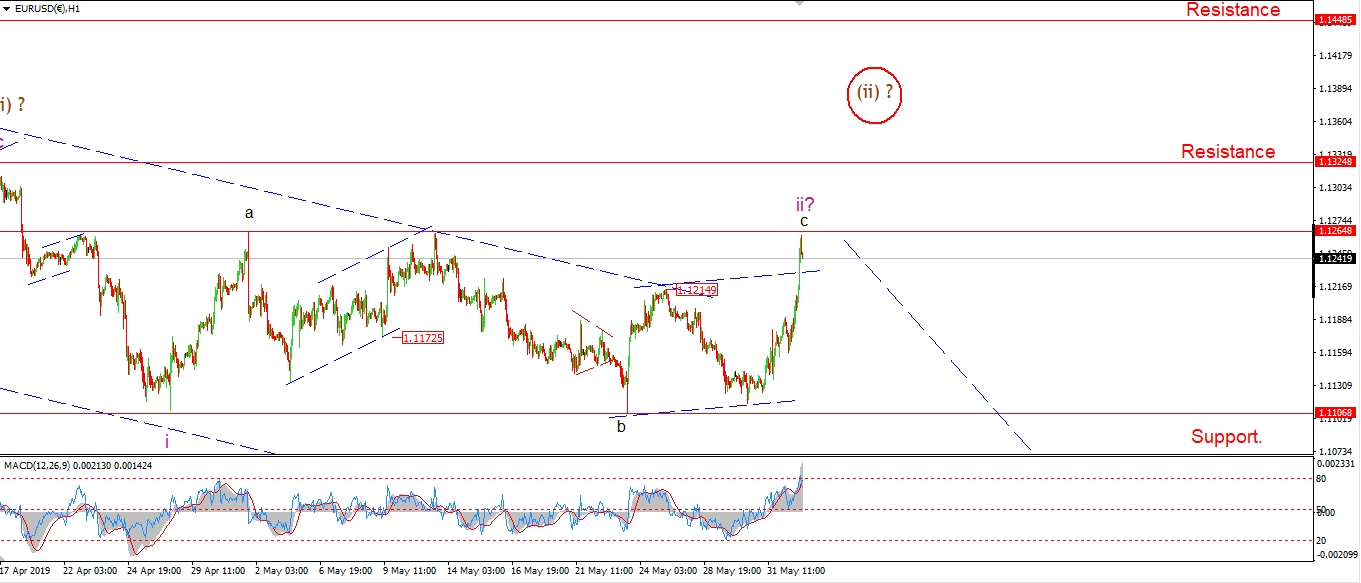 [/vc_column_text][/vc_column][vc_column width=”1/3″][vc_custom_heading text=”4 Hours” use_theme_fonts=”yes”][vc_column_text]
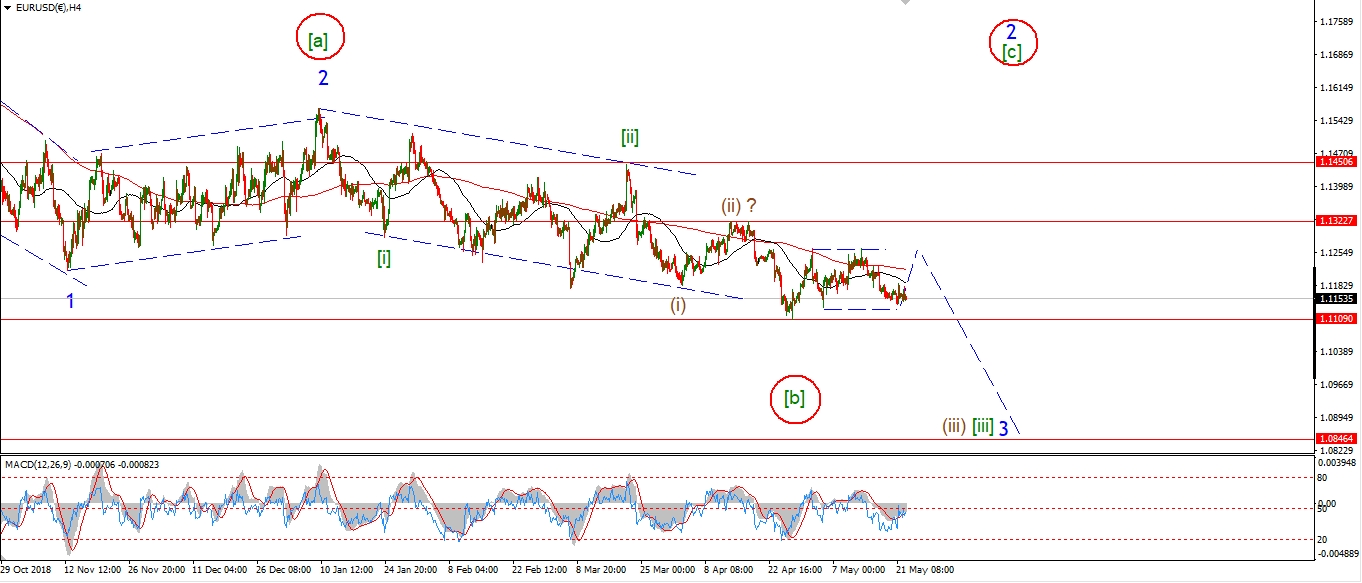 [/vc_column_text][vc_custom_heading text=”Daily” use_theme_fonts=”yes”][vc_column_text]
 [/vc_column_text][/vc_column][/vc_row]
[vc_row][vc_column][vc_column_text]
Wave ‘c’ of ‘ii’ finally came in today.
The rally has ruled out the previous alternate count showing a lower degree second wave rally.
But the next alternate count for wave (ii) at one higher degree
is now back in the picture.
This alternate count will be triggered if we get a break of 1.1324.
Tomorrow;
The current wave count is on track to complete wave ‘ii’ at 1.1265 early tomorrow.
If we see a reaction lower off that level,
and a decline back below 1.1215,
that will signal wave ‘ii’ is complete and wave ‘iii’ down is beginning.
[/vc_column_text][/vc_column][/vc_row]
[vc_row][vc_column][vc_separator border_width=”5″][/vc_column][/vc_row][vc_row][vc_column][vc_column_text]
GBPUSD
[/vc_column_text][/vc_column][/vc_row][vc_row][vc_column][vc_separator border_width=”5″][/vc_column][/vc_row][vc_row][vc_column width=”2/3″][vc_custom_heading text=”1 hr” use_theme_fonts=”yes”][vc_column_text]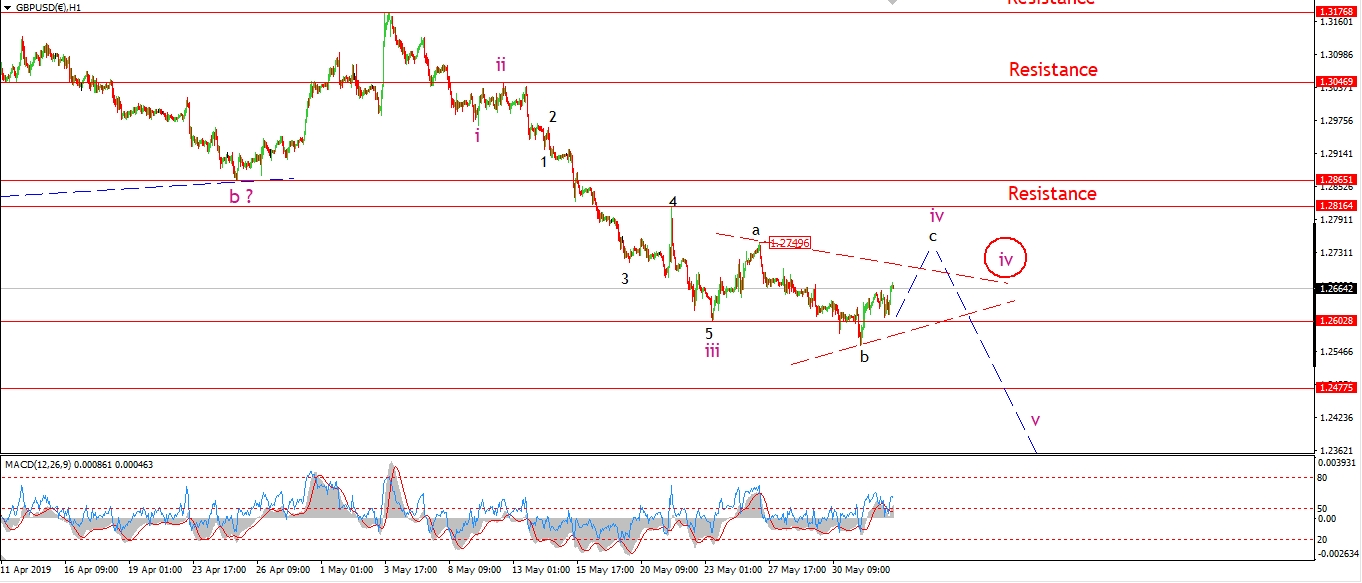 [/vc_column_text][/vc_column][vc_column width=”1/3″][vc_custom_heading text=”4 Hours” use_theme_fonts=”yes”][vc_column_text]
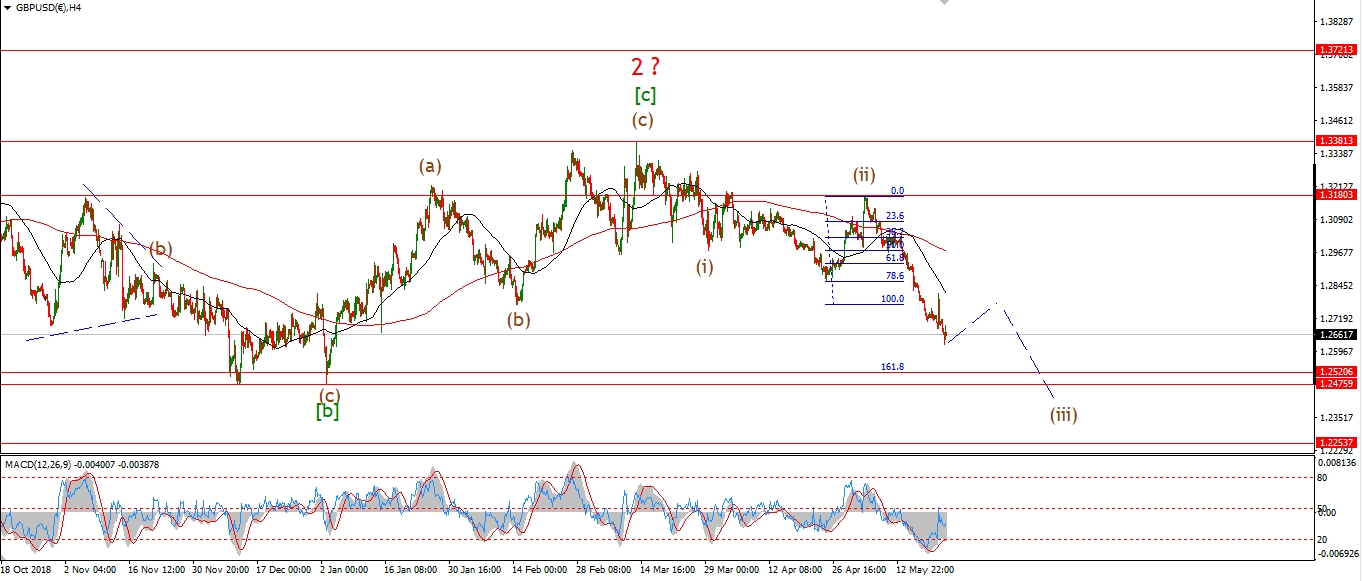 [/vc_column_text][vc_custom_heading text=”Daily” use_theme_fonts=”yes”][vc_column_text]
 [/vc_column_text][/vc_column][/vc_row]
[vc_row][vc_column][vc_column_text]
Cable is rising also today in wave ‘c’ of ‘iv’.
The rally is far less pronounced in cable,
and the rise is in three waves so far.
This could be a sign that wave ‘iv’ is tracing out a triangle.
If that is the case,
then the range contraction will continue for the coming few sessions as shown on the short term chart.
A break above 1.2749 will confirm the expanded flat correction scenario which is the main wave count.
Tomorrow;
Watch for wave ‘c’ of ‘iv’ to complete above 1.2750.
[/vc_column_text][/vc_column][/vc_row]
[vc_row][vc_column][vc_separator border_width=”5″][/vc_column][/vc_row][vc_row][vc_column][vc_column_text]
USDJPY
[/vc_column_text][/vc_column][/vc_row][vc_row][vc_column][vc_separator border_width=”5″][/vc_column][/vc_row][vc_row][vc_column width=”2/3″][vc_custom_heading text=”1 hr” use_theme_fonts=”yes”][vc_column_text]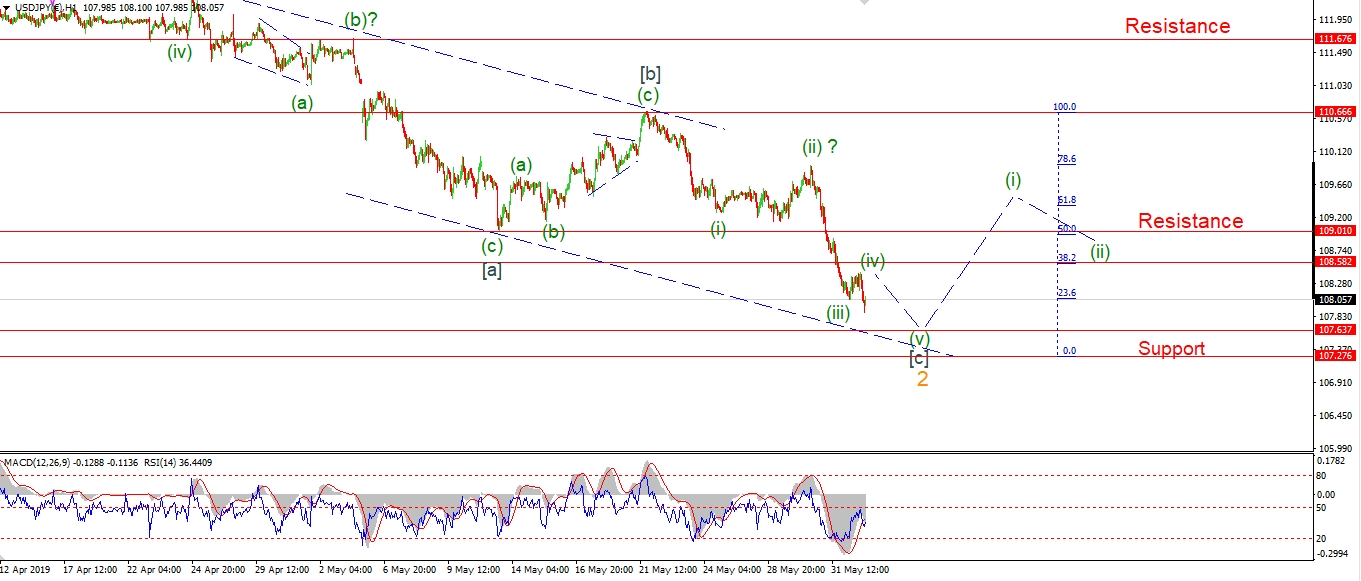 [/vc_column_text][/vc_column][vc_column width=”1/3″][vc_custom_heading text=”4 Hours” use_theme_fonts=”yes”][vc_column_text]
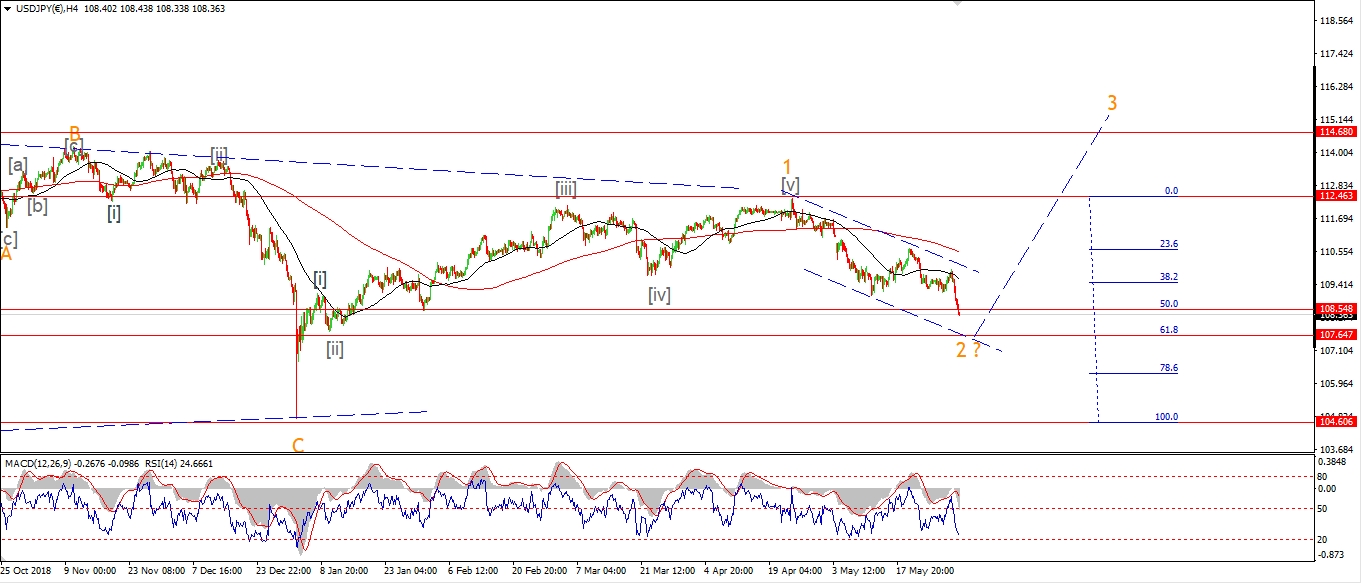 [/vc_column_text][vc_custom_heading text=”Daily” use_theme_fonts=”yes”][vc_column_text]
 [/vc_column_text][/vc_column][/vc_row]
[vc_row][vc_column][vc_column_text]
USDJPY rose slightly overnight in a corrective manner.
The move higher is relatively small in wave (iv) when compared to wave (ii).
So wave (iv) may still develop into a larger structure.
If so, the same resistance levels should hold the correction.
For the moment I am going with the idea that wave (iv) is complete.
That suggests that wave (v) of [c] is now underway.
the price is approaching the target area of wave [c] between 107.63 and 107.27.
Tomorrow;
Watch for wave (v) of [c] to hit the target area and complete the three wave correction in wave ‘2’.
If this wave count is correct,
then we should see wave ‘3’ up begin this week.
[/vc_column_text][/vc_column][/vc_row]
[vc_row][vc_column][vc_separator border_width=”5″][/vc_column][/vc_row][vc_row][vc_column][vc_column_text]
DOW JONES INDUSTRIALS
[/vc_column_text][/vc_column][/vc_row][vc_row][vc_column][vc_separator border_width=”5″][/vc_column][/vc_row][vc_row][vc_column width=”2/3″][vc_custom_heading text=”1 hr” use_theme_fonts=”yes”][vc_column_text]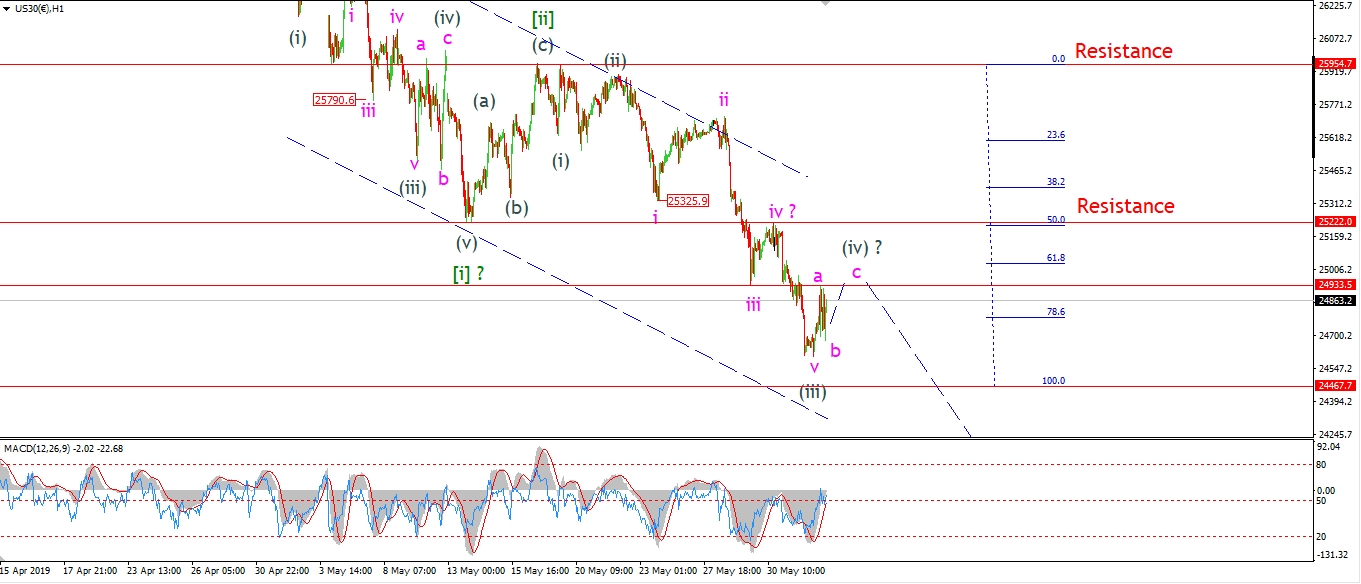 [/vc_column_text][/vc_column][vc_column width=”1/3″][vc_custom_heading text=”4 Hours” use_theme_fonts=”yes”][vc_column_text]
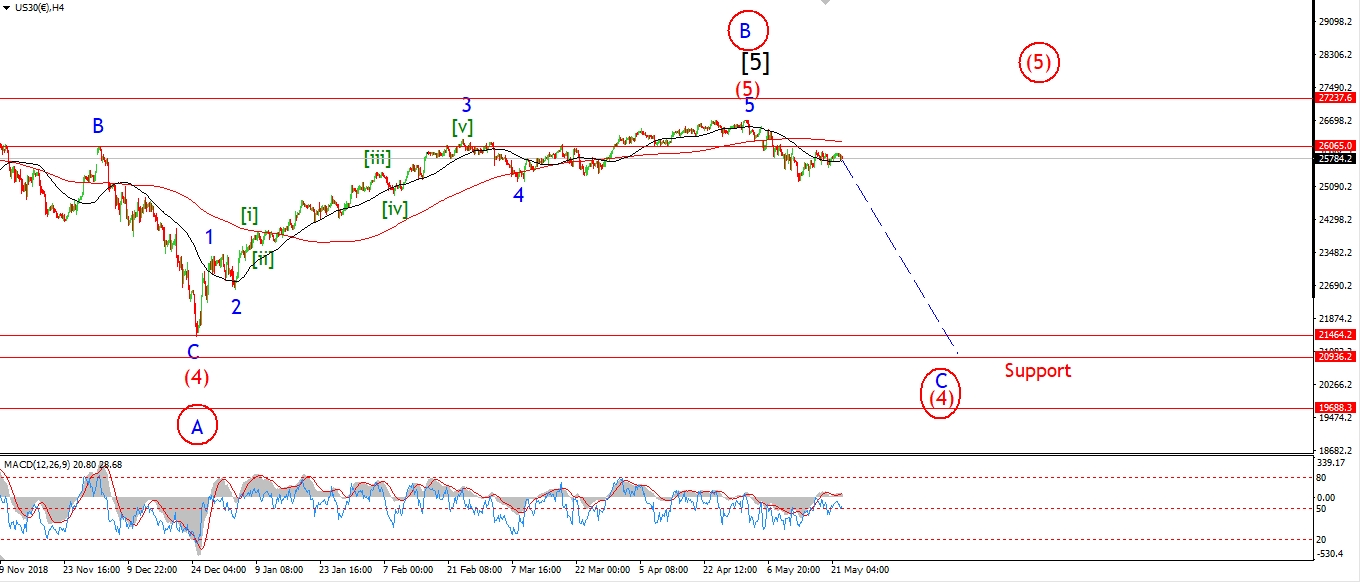 [/vc_column_text][vc_custom_heading text=”Daily” use_theme_fonts=”yes”][vc_column_text]
 [/vc_column_text][/vc_column][/vc_row]
[vc_row][vc_column][vc_column_text]
This week I will be concentrating on building that larger five wave decline off the highs.
We need a further correction in wave [iv]
and one more sharp pike lower in wave [v] to complete that larger bearish pattern.
The DOW rallied this morning and hit the initial target area for wave (iv) at 24933,
This level marks the low of wave ‘iii’,
and has acted as resistance so far.
The price is now back down off that level to create a higher low above wave (iii).
I have labelled todays rally as wave ‘a’ of (iv).
Wave ‘b’ could be complete at this evenings lows.
And then wave ‘c’ should rally back above 24933 again to complete a three wave correction.
The main resistance level lies at the previous wave [i] low of 25222.
Ideally,
wave (iv) should complete below this level.
Tomorrow;
Watch for wave ‘c’ of (iv) to complete with a break of 24933,
and then wave (v) of [iii] to begin.
the minimum target for wave [iii] lies at 24467.
[/vc_column_text][/vc_column][/vc_row]
[vc_row][vc_column][vc_separator border_width=”5″][/vc_column][/vc_row][vc_row][vc_column][vc_column_text]
GOLD
[/vc_column_text][/vc_column][/vc_row][vc_row][vc_column][vc_separator border_width=”5″][/vc_column][/vc_row][vc_row][vc_column width=”2/3″][vc_custom_heading text=”1 hr” use_theme_fonts=”yes”][vc_column_text]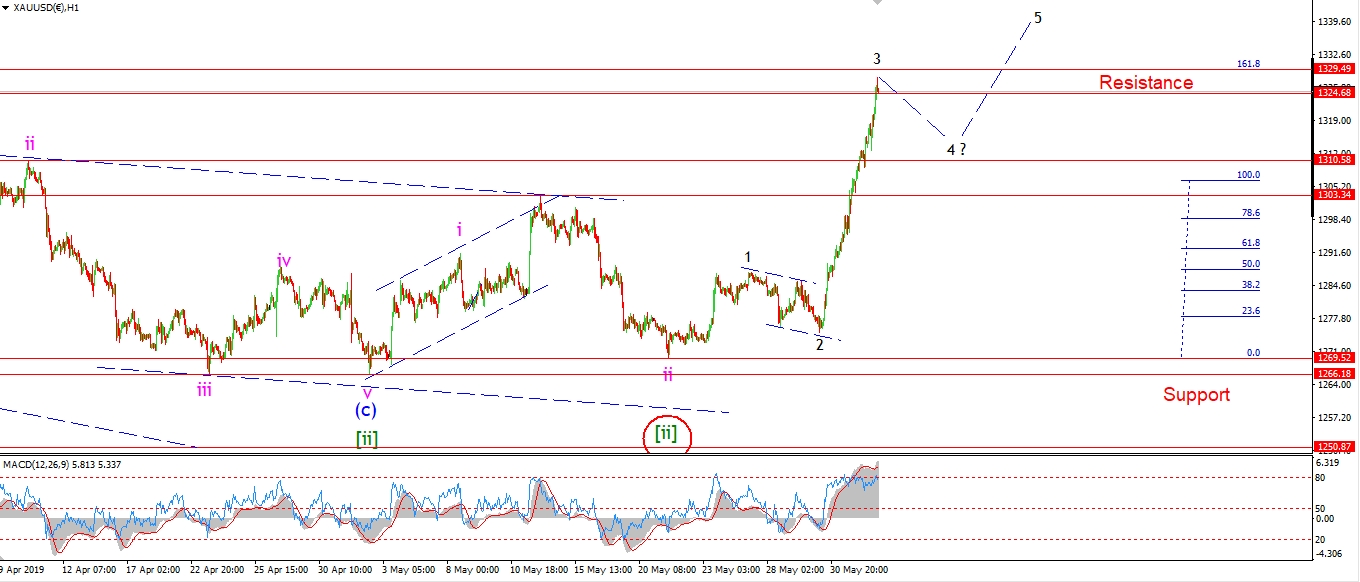 [/vc_column_text][/vc_column][vc_column width=”1/3″][vc_custom_heading text=”4 Hours” use_theme_fonts=”yes”][vc_column_text]
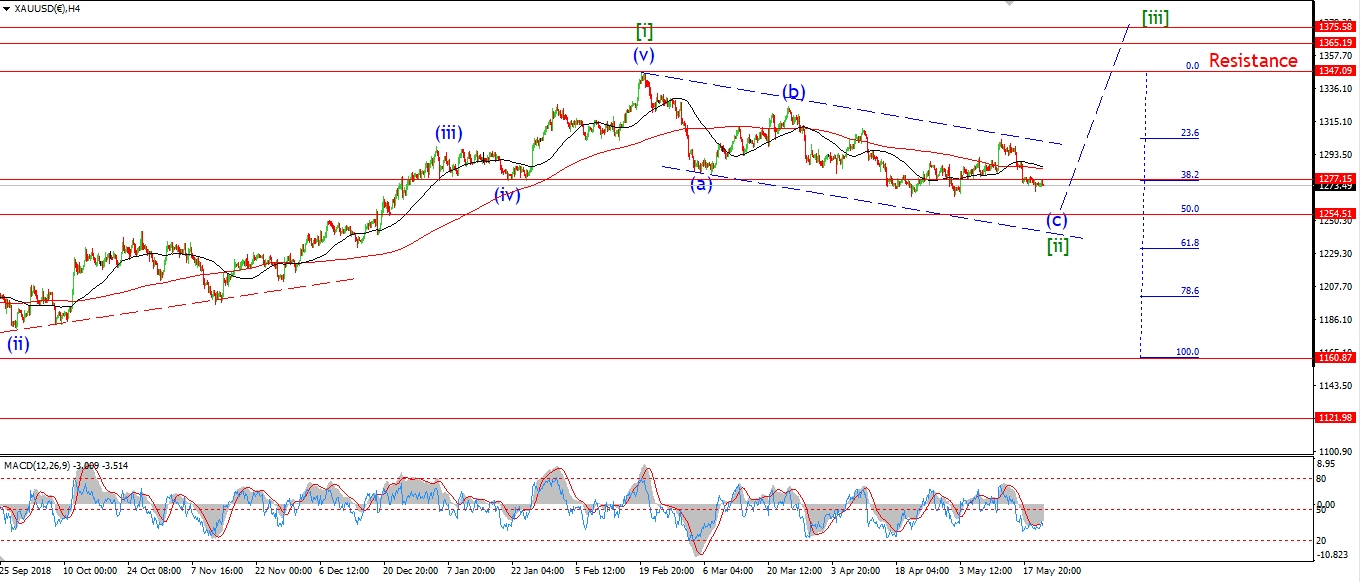 [/vc_column_text][vc_custom_heading text=”Daily” use_theme_fonts=”yes”][vc_column_text]
 [/vc_column_text][/vc_column][/vc_row]
[vc_row][vc_column][vc_column_text]
The rally continued in Gold today as part of wave ‘iii’ of (i).
The price has already broken above the main resistance level at 1324.
This level marks the high of the previous wave (b)
within the recent correction wave [ii].
And as I have maintained for the last while,
a break of this level is seen as a signal that a larger bullish phase is now underway.
This larger rally should carry us higher to above 1600 in wave ‘3’ red.
The larger wave count is best viewed on the daily chart.
Tomorrow;
I have altered the wave count slightly this evening.
The rally over the last couple of days is now viewed as wave ‘3’ of ‘iii’.
Rather than wave ‘3’ of ‘i’.
Watch for wave ‘iii’ to remin in force into wednesday and break above 1329 in wave ‘5’ of ‘iii’.
Wave ‘4’ of ‘iii’ is likely to correct slightly tomorrow.
[/vc_column_text][/vc_column][/vc_row]
[vc_row][vc_column][vc_separator border_width=”5″][/vc_column][/vc_row][vc_row][vc_column][vc_column_text]
U.S CRUDE OIL
[/vc_column_text][/vc_column][/vc_row][vc_row][vc_column][vc_separator border_width=”5″][/vc_column][/vc_row][vc_row][vc_column width=”2/3″][vc_custom_heading text=”1 hr” use_theme_fonts=”yes”][vc_column_text]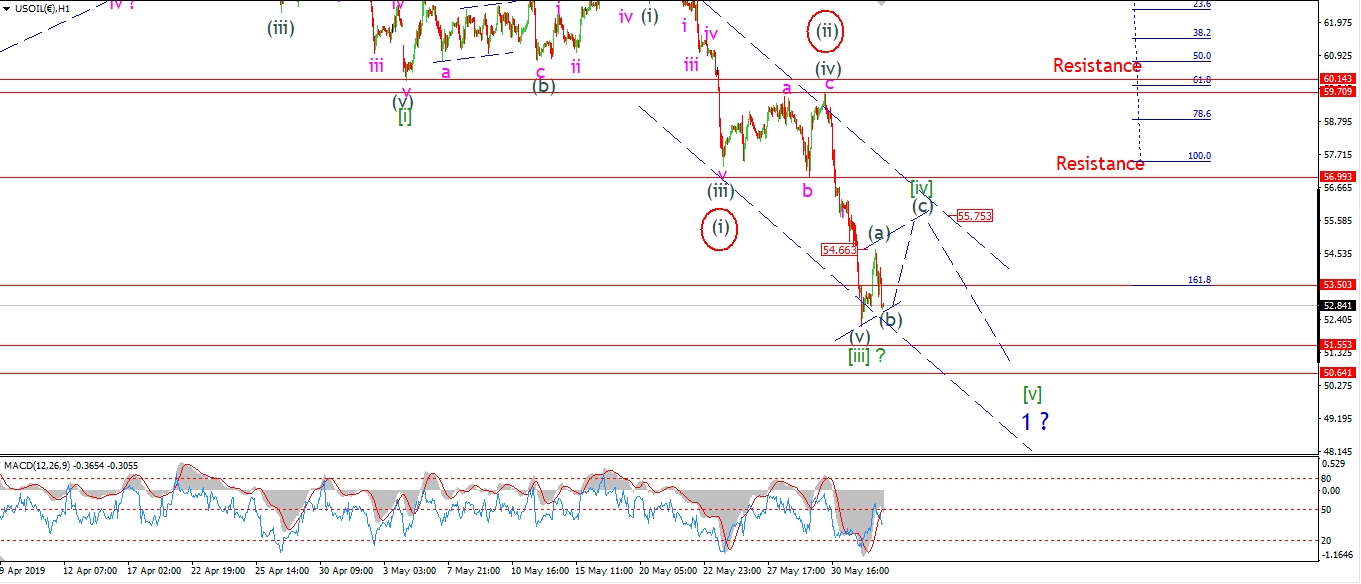 [/vc_column_text][/vc_column][vc_column width=”1/3″][vc_custom_heading text=”4 Hours” use_theme_fonts=”yes”][vc_column_text]
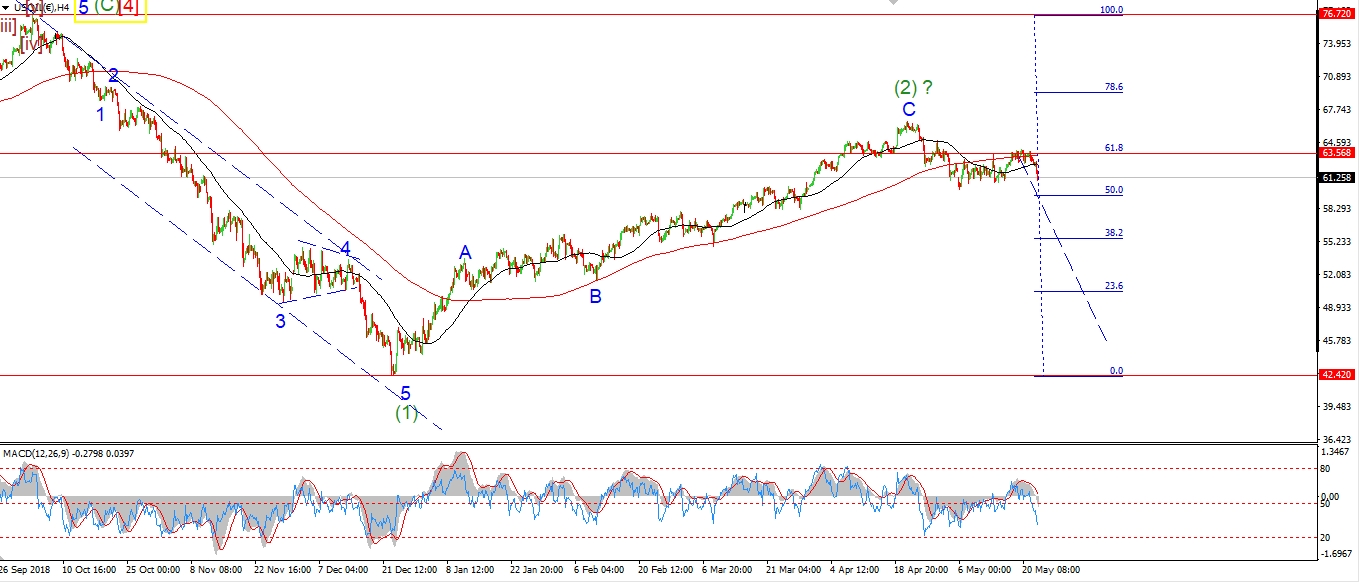 [/vc_column_text][vc_custom_heading text=”Daily” use_theme_fonts=”yes”][vc_column_text]
 [/vc_column_text][/vc_column][/vc_row]
[vc_row][vc_column][vc_column_text]
Crude rallied in three waves early in the session and then fell back below 53.00 again this evening.
This action is labelled waves (a) and (b) of [iv],
Wave (c) of [iv] should rally again tomorrow,
and break the wave (a) high at 54.66 again to complete wave [iv].
At that point I expect a further bout of selling to come in and take the price lower in wave [v].
Tomorrow;
Watch for a rally in wave (c) to fill the trend channel again and complete a three wave correction.
Ideally wave [iv] will hold below resistance at 56.99.
[/vc_column_text][/vc_column][/vc_row]
[vc_row][vc_column][vc_separator border_width=”5″][/vc_column][/vc_row][vc_row][vc_column][vc_column_text]
US 10 yr Treasuries.
[/vc_column_text][/vc_column][/vc_row][vc_row][vc_column][vc_separator border_width=”5″][/vc_column][/vc_row][vc_row][vc_column width=”2/3″][vc_custom_heading text=”1 hr” use_theme_fonts=”yes”][vc_column_text]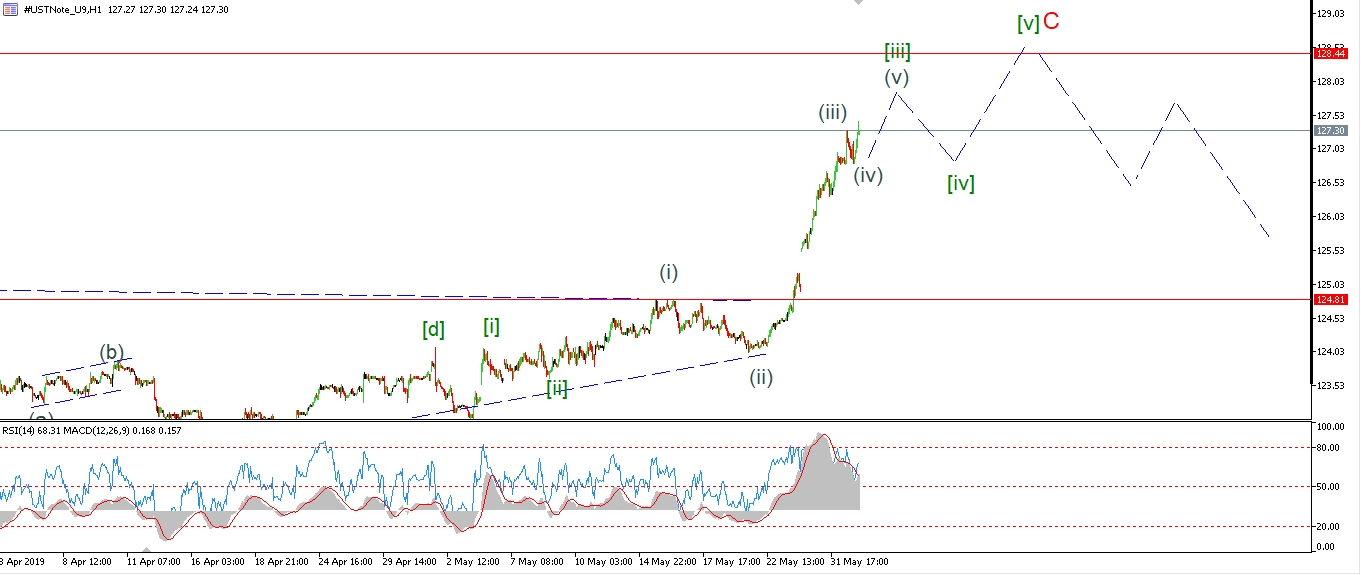 [/vc_column_text][/vc_column][vc_column width=”1/3″][vc_custom_heading text=”4 Hours” use_theme_fonts=”yes”][vc_column_text]
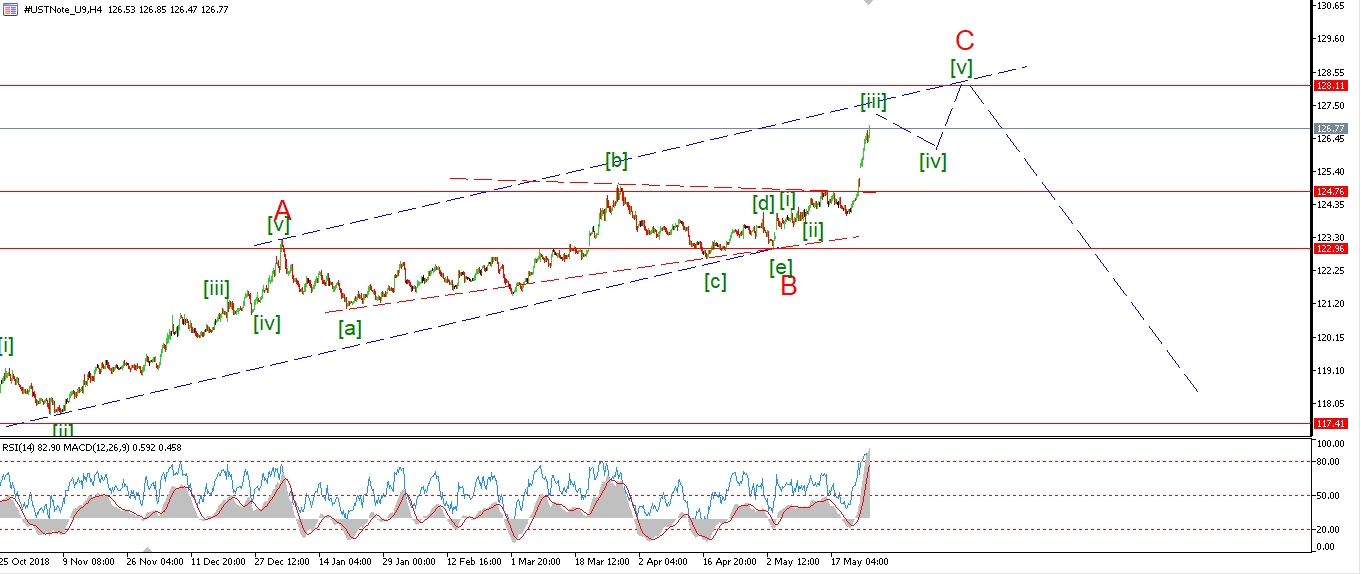 [/vc_column_text][vc_custom_heading text=”Daily” use_theme_fonts=”yes”][vc_column_text]
 [/vc_column_text][/vc_column][/vc_row]
[vc_row][vc_column][vc_column_text]
Wave [iii] green will likely draw to a close this week.
The price should subdivide again and create a larger wave (iv) grey tomorrow,
before running higher in wave (v) of [iii] later in the week.
Once wave [iii] completes,
wave [iv] will then be ready to cause a larger correction
and price should fall back towards the 126.50 level again.
This action is all part of a three wave correction higher in wave (2).
And this whole rally will be retraced when wave (3) down gets going.
Tomorrow;
Watch for wave (iv) to complete and wave (v) to begin the push towards 128.00 again.
[/vc_column_text][/vc_column][/vc_row]
[vc_row][vc_column][vc_separator border_width=”5″][/vc_column][/vc_row][vc_row][vc_column][vc_column_text]
SILVER
[/vc_column_text][/vc_column][/vc_row][vc_row][vc_column][vc_separator border_width=”5″][/vc_column][/vc_row][vc_row][vc_column width=”2/3″][vc_custom_heading text=”1 hr” use_theme_fonts=”yes”][vc_column_text] [/vc_column_text][/vc_column][vc_column width=”1/3″][vc_custom_heading text=”4 Hours” use_theme_fonts=”yes”][vc_column_text]
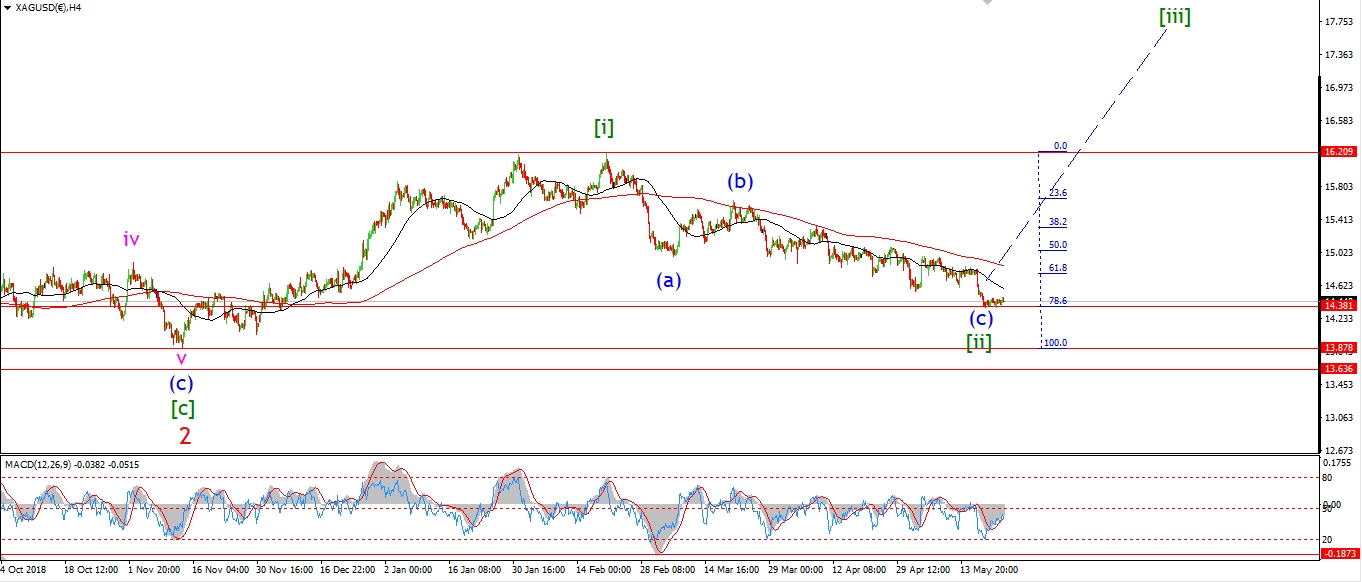 [/vc_column_text][vc_custom_heading text=”Daily” use_theme_fonts=”yes”][vc_column_text]
 [/vc_column_text][/vc_column][/vc_row]
[vc_row][vc_column][vc_column_text]
Wave ‘i’ has not pushed above the initial resistance at just 14.85 yet.
A break of that previous wave ‘iv’ level would build confidence in the bullish count.
And then we can look for a three wave correction off that high in wave ‘ii’,
to create a higher low at about 14.63 as shown.
This action will complete a bullish impulse wave off the lows at wave [ii].
And the price will then be ready for a rally in wave ‘iii’ of (i).
Wave ‘iii’ should hit 15.33 at a minimum over the coming week.
Tomorrow;
Watch for wave ‘i’ to continue and break resistance at 14.85 before correcting in wave ‘ii’.
[/vc_column_text][/vc_column][/vc_row]
[vc_row][vc_column][vc_separator border_width=”5″][/vc_column][/vc_row][vc_row][vc_column][vc_column_text]
S&P 500.
[/vc_column_text][/vc_column][/vc_row][vc_row][vc_column][vc_separator border_width=”5″][/vc_column][/vc_row][vc_row][vc_column width=”2/3″][vc_custom_heading text=”1 hr” use_theme_fonts=”yes”][vc_column_text]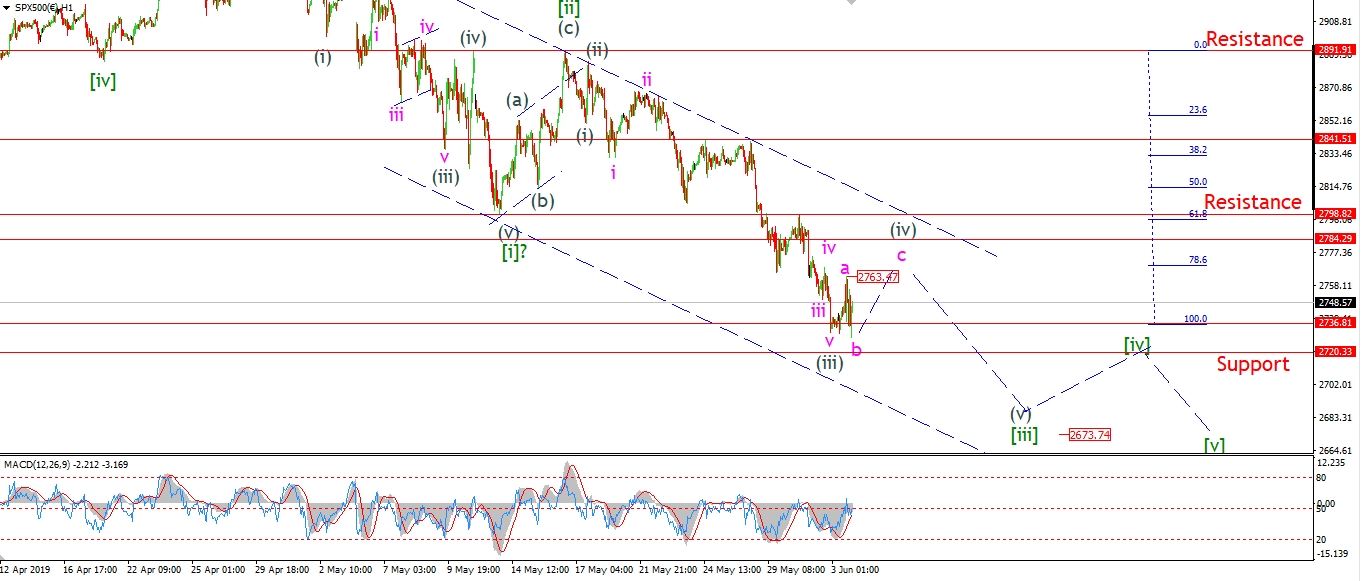 [/vc_column_text][/vc_column][vc_column width=”1/3″][vc_custom_heading text=”4 Hours” use_theme_fonts=”yes”][vc_column_text]
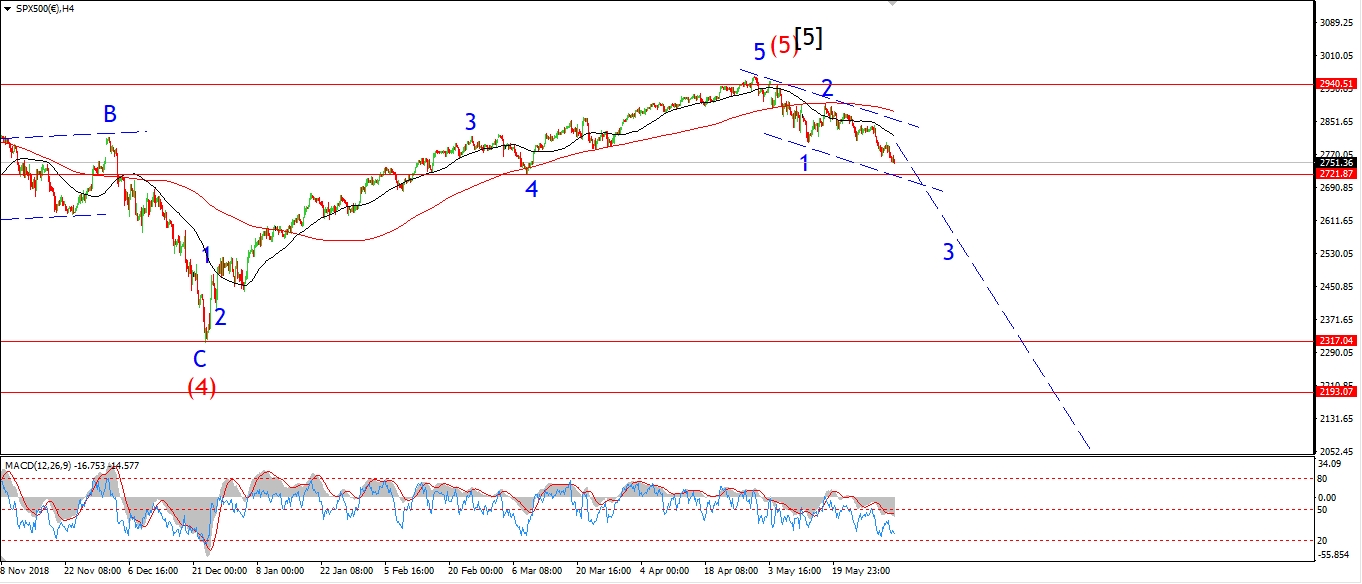 [/vc_column_text][vc_custom_heading text=”Daily” use_theme_fonts=”yes”][vc_column_text]
 [/vc_column_text][/vc_column][/vc_row]
[vc_row][vc_column][vc_column_text]
The S&P has made a new low this evening which has broken Fridays wave (iii) low.
Todays decline is labelled wave ‘b’ of (iv),
as part of an expanded flat correction in wave (iv).
Wave ‘c’ should push above 2763 again tomorrow to complete a clear three wave pattern in wave (iv).
Wave (iv) should complete within the larger declining trend channel.
At that point we can look lower again in wave (v) to complete the correction in wave [iii].
The price has reached the minimum target for wave [iii] green with a break of 2736 today.
This is where wave [i] and [iii] reach equality.
But I would prefer if wave [iii] stretch towards the 162% extension level at 2640.
Tomorrow;
Watch for wave ‘c’ of (iv) to complete with a break of 2763.
[/vc_column_text][/vc_column][/vc_row]
[vc_row][vc_column][vc_separator border_width=”5″][/vc_column][/vc_row]