
[vc_row][vc_column][vc_separator border_width=”5″][/vc_column][/vc_row]
[vc_row][vc_column][vc_column_text]
Hi everyone.
[/vc_column_text][/vc_column][/vc_row]
[vc_row][vc_column][vc_separator border_width=”5″][/vc_column][/vc_row]
[vc_row][vc_column][vc_column_text]
EURUSD
[/vc_column_text][/vc_column][/vc_row]
[vc_row][vc_column][vc_separator border_width=”5″][/vc_column][/vc_row][vc_row][vc_column width=”2/3″][vc_custom_heading text=”1 hr” use_theme_fonts=”yes”][vc_column_text]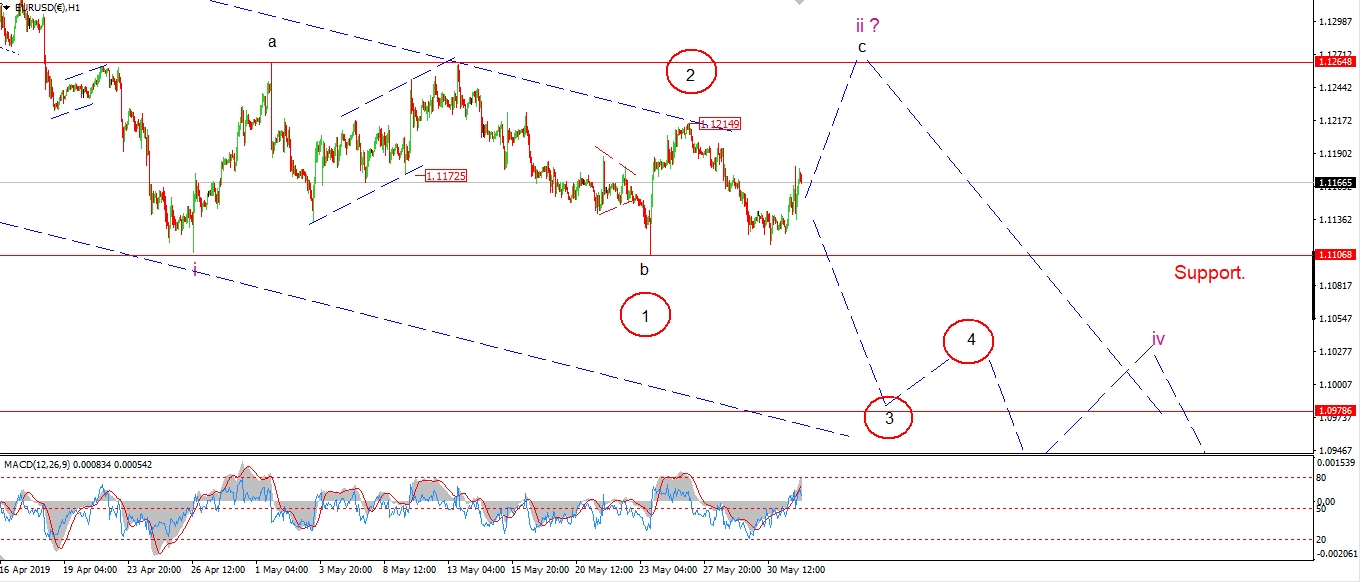 [/vc_column_text][/vc_column][vc_column width=”1/3″][vc_custom_heading text=”4 Hours” use_theme_fonts=”yes”][vc_column_text]
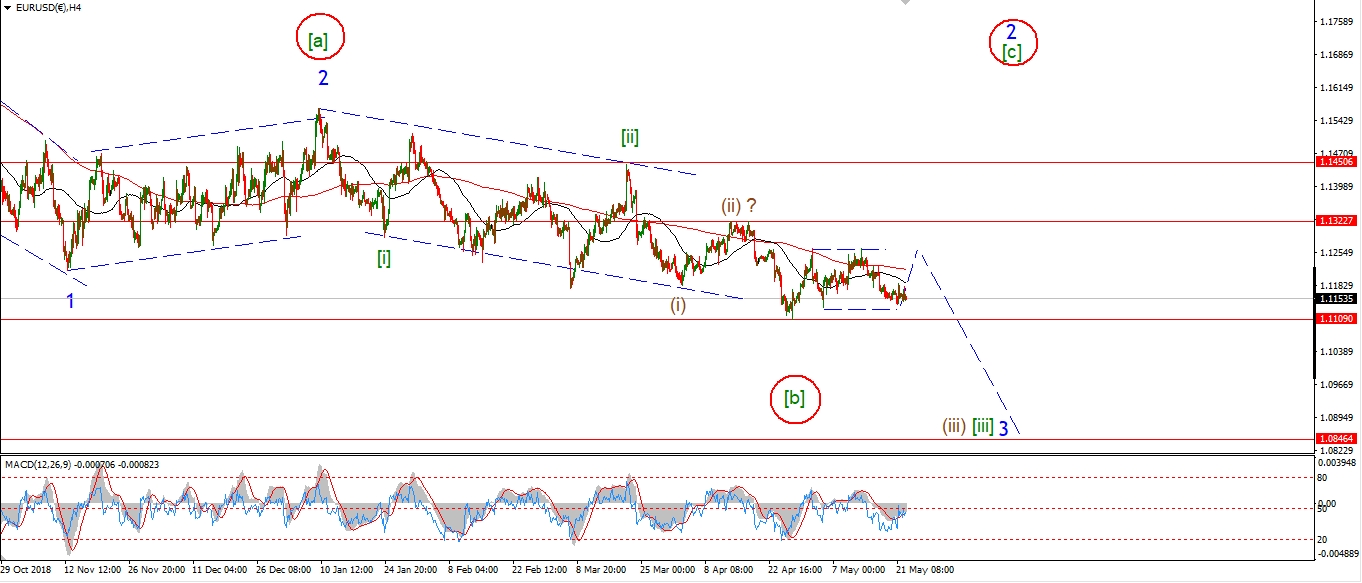 [/vc_column_text][vc_custom_heading text=”Daily” use_theme_fonts=”yes”][vc_column_text]
 [/vc_column_text][/vc_column][/vc_row]
[vc_row][vc_column][vc_column_text]
The rise off Thursdays low is in keeping with the idea of a ‘c’ wave rally,
but the structure is not yet impulsive off the lows.
on top of that,
we still don’t have a break of 1.1214 to confirm wave ‘c’.
So the alternate count for wave ‘iii’ cannot be ruled out just yet.
Only a break of 1.1214 will invalidate the alternate count and we can then focus on completing wave ‘ii’ pink.
Monday;
Watch for wave ‘c’ to break 1.1214 and complete a combination correction in wave ‘ii’.
Wave ‘iii’ down should begin next week in either scenario.
A break of initial support at 1.1106 will confirm wave ‘iii’.
[/vc_column_text][/vc_column][/vc_row]
[vc_row][vc_column][vc_separator border_width=”5″][/vc_column][/vc_row][vc_row][vc_column][vc_column_text]
GBPUSD
[/vc_column_text][/vc_column][/vc_row][vc_row][vc_column][vc_separator border_width=”5″][/vc_column][/vc_row][vc_row][vc_column width=”2/3″][vc_custom_heading text=”1 hr” use_theme_fonts=”yes”][vc_column_text]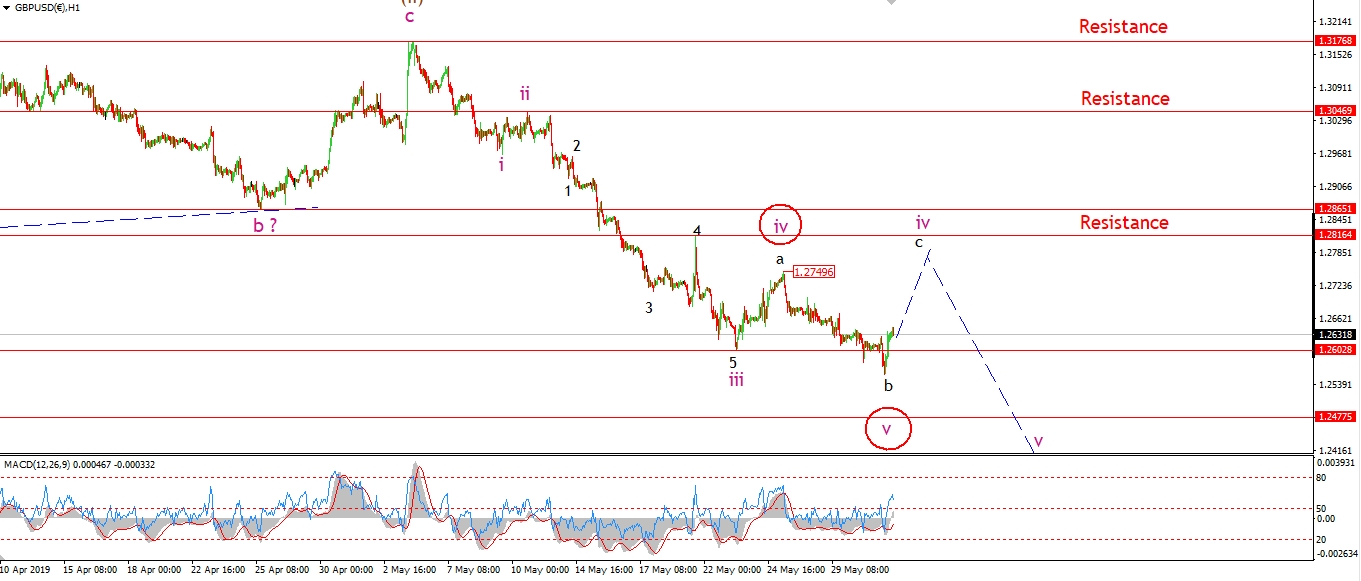 [/vc_column_text][/vc_column][vc_column width=”1/3″][vc_custom_heading text=”4 Hours” use_theme_fonts=”yes”][vc_column_text]
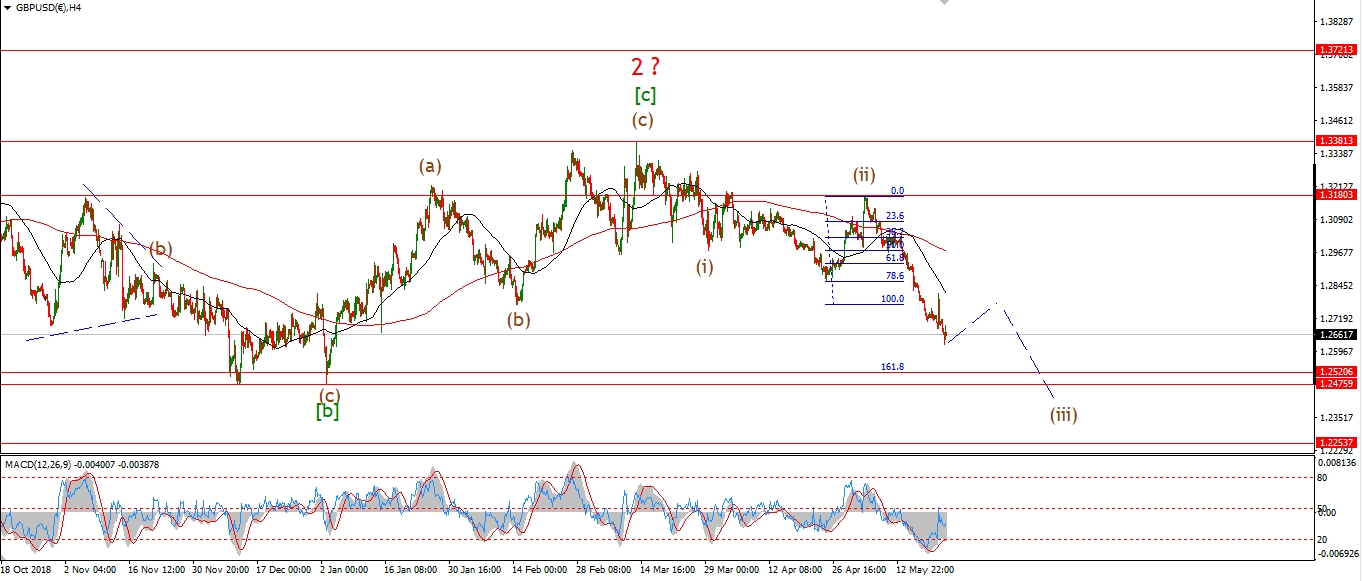 [/vc_column_text][vc_custom_heading text=”Daily” use_theme_fonts=”yes”][vc_column_text]
 [/vc_column_text][/vc_column][/vc_row]
[vc_row][vc_column][vc_column_text]
The expanded flat idea for wave ‘iv’ is still the main count this evening.
The price has rebounded above the wave ‘iii’ low at 1.2602 again,
and wave ‘c’ of ‘iv’ should now be underway.
The initial target for wave ‘c’ lies at the wave ‘a’ high of 1.2750.
Monday;
Wave ‘iv’ should be near completion by Monday evening.
A failure below resistance at 1.2816,
and a spike lower,
should signal that wave ‘v’ of (iii) has begun.
[/vc_column_text][/vc_column][/vc_row]
[vc_row][vc_column][vc_separator border_width=”5″][/vc_column][/vc_row][vc_row][vc_column][vc_column_text]
USDJPY
[/vc_column_text][/vc_column][/vc_row][vc_row][vc_column][vc_separator border_width=”5″][/vc_column][/vc_row][vc_row][vc_column width=”2/3″][vc_custom_heading text=”1 hr” use_theme_fonts=”yes”][vc_column_text]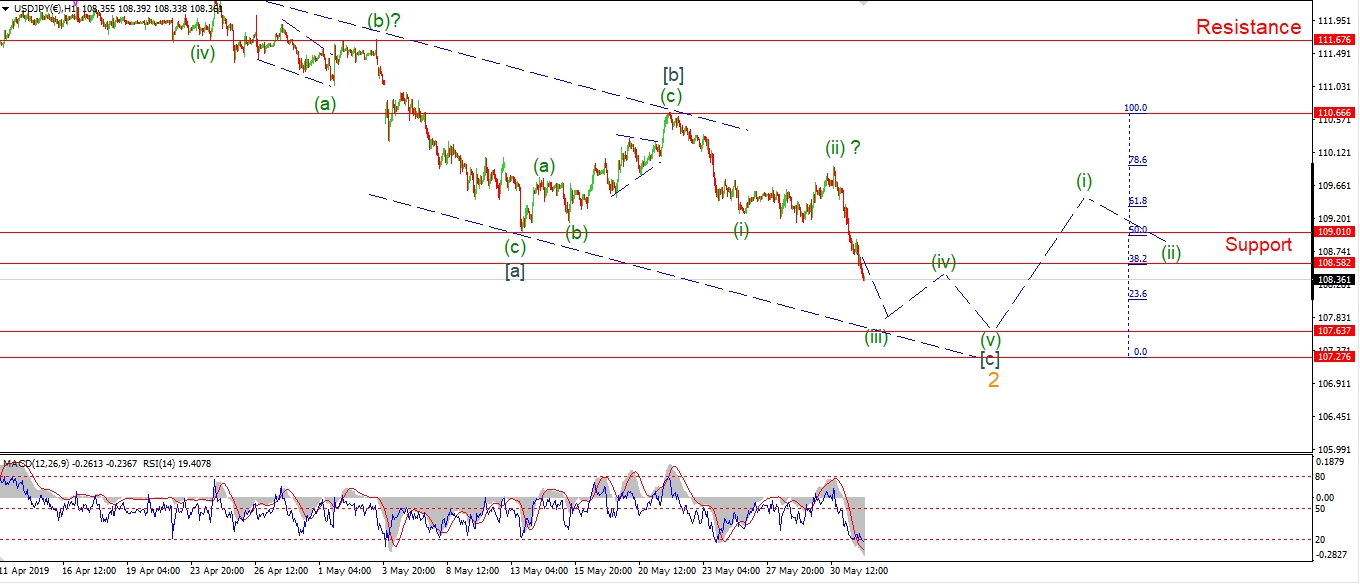 [/vc_column_text][/vc_column][vc_column width=”1/3″][vc_custom_heading text=”4 Hours” use_theme_fonts=”yes”][vc_column_text]
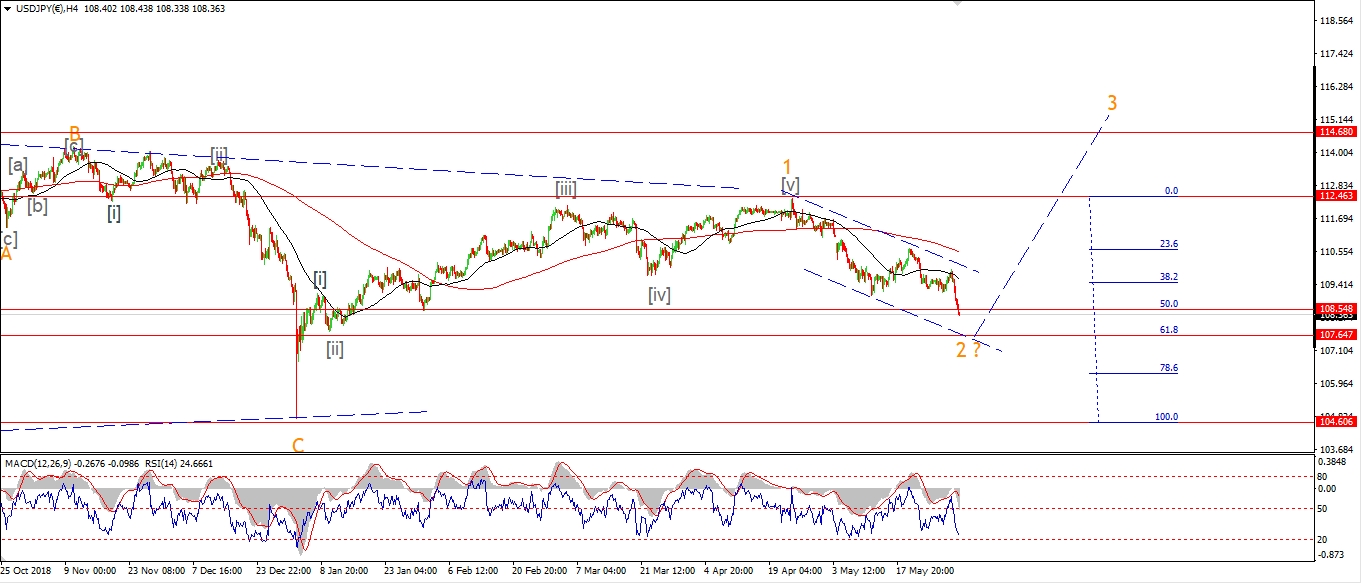 [/vc_column_text][vc_custom_heading text=”Daily” use_theme_fonts=”yes”][vc_column_text]
 [/vc_column_text][/vc_column][/vc_row]
[vc_row][vc_column][vc_column_text]
USDJPY has triggered the alternate count this evening
by breaking support at 109.01 early this morning.
The price has moved sharply lower in a clear five wave pattern today.
This decline is viewed as wave (iii) of [c] of ‘2’.
And the price has even met the 50% retracement target at 108.54 today.
The lower 62% retracement is now more likely for wave ‘2’ to complete.
This level lies at 107.63.
And wave [c] will meet equality with wave [a] at 107.27.
Monday;
Now we have a cluster of targets for the end of wave [c].
Watch for wave [c] to close out next week.
That will complete the larger wave ‘2’ correction,
And then we can look higher in wave (i) again.
[/vc_column_text][/vc_column][/vc_row]
[vc_row][vc_column][vc_separator border_width=”5″][/vc_column][/vc_row][vc_row][vc_column][vc_column_text]
DOW JONES INDUSTRIALS
[/vc_column_text][/vc_column][/vc_row][vc_row][vc_column][vc_separator border_width=”5″][/vc_column][/vc_row][vc_row][vc_column width=”2/3″][vc_custom_heading text=”1 hr” use_theme_fonts=”yes”][vc_column_text]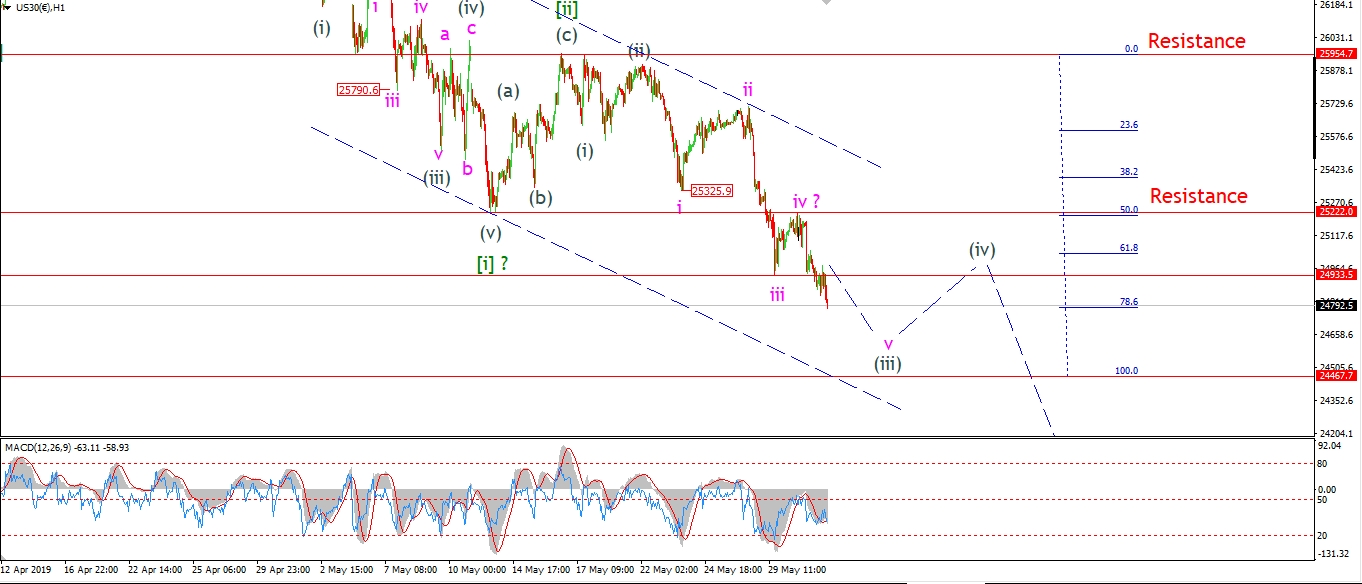 [/vc_column_text][/vc_column][vc_column width=”1/3″][vc_custom_heading text=”4 Hours” use_theme_fonts=”yes”][vc_column_text]
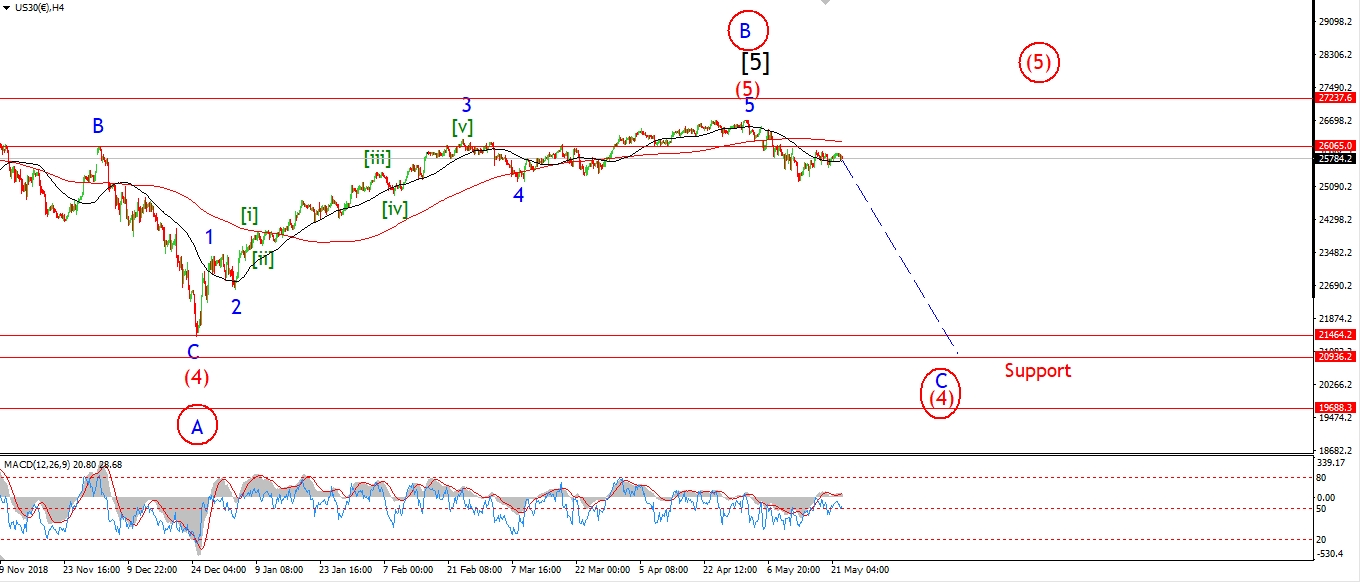 [/vc_column_text][vc_custom_heading text=”Daily” use_theme_fonts=”yes”][vc_column_text]
 [/vc_column_text][/vc_column][/vc_row]
[vc_row][vc_column][vc_column_text]
The market is now back below the wave ‘iii’ low this evening and we are closing on the lows.
Wave [iii] down is getting going now and should continue lower next week.
Wave [c] reaches equality with wave [a] at 24467,
but the more fitting target for a third wave decline lies at 23547,
this is where wave [iii] will hit the 162% extension of wave [i].
So,
for the moment that is the level I will work towards.
Monday;
Wave (iii) should continue lower in wave ‘v’ of (iii).
the wave ‘iv’ high at 25222 should hold as wave (iii) completes.
[/vc_column_text][/vc_column][/vc_row]
[vc_row][vc_column][vc_separator border_width=”5″][/vc_column][/vc_row][vc_row][vc_column][vc_column_text]
GOLD
[/vc_column_text][/vc_column][/vc_row][vc_row][vc_column][vc_separator border_width=”5″][/vc_column][/vc_row][vc_row][vc_column width=”2/3″][vc_custom_heading text=”1 hr” use_theme_fonts=”yes”][vc_column_text]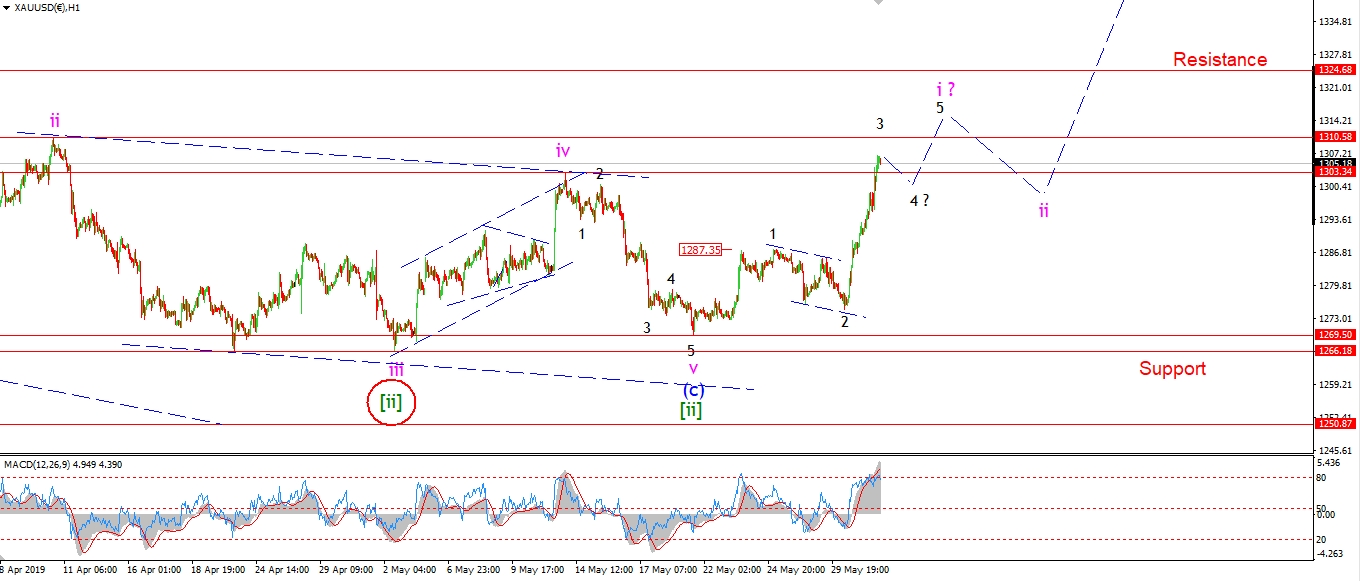 [/vc_column_text][/vc_column][vc_column width=”1/3″][vc_custom_heading text=”4 Hours” use_theme_fonts=”yes”][vc_column_text]
 [/vc_column_text][vc_custom_heading text=”Daily” use_theme_fonts=”yes”][vc_column_text]
 [/vc_column_text][/vc_column][/vc_row]
[vc_row][vc_column][vc_column_text]
Finally we have an impulsive move in Gold!
Today’s trade brought the type of rally that I have been looking for to signal a change in trend.
the price is now back above 1300 again in wave ‘3’ of ‘i’.
And Gold should continue higher early next week to complete a five wave structure higher off 1269.
And if all goes to plan next week,
we should have a clear impulse pattern complete at the end of wave ‘ii’ pink.
This bullish pattern will be the best sign yet that Gold has finally bottomed for the long term.
And we can focus on a larger rally in wave [iii] up.
[/vc_column_text][/vc_column][/vc_row]
[vc_row][vc_column][vc_separator border_width=”5″][/vc_column][/vc_row][vc_row][vc_column][vc_column_text]
U.S CRUDE OIL
[/vc_column_text][/vc_column][/vc_row][vc_row][vc_column][vc_separator border_width=”5″][/vc_column][/vc_row][vc_row][vc_column width=”2/3″][vc_custom_heading text=”1 hr” use_theme_fonts=”yes”][vc_column_text]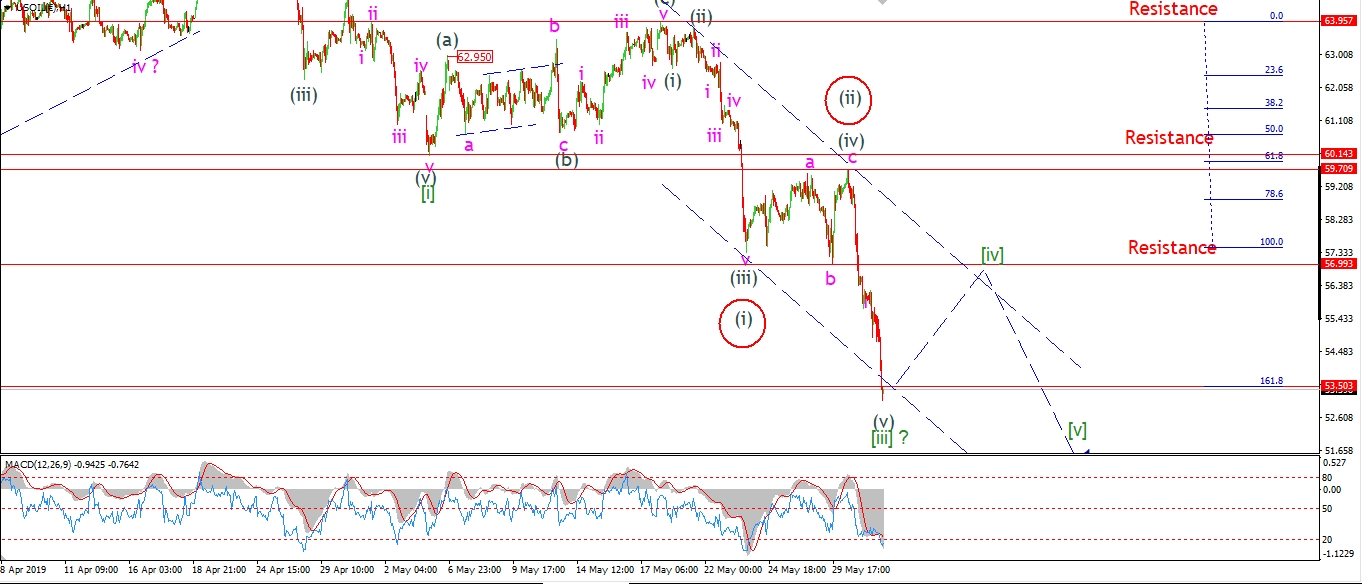 [/vc_column_text][/vc_column][vc_column width=”1/3″][vc_custom_heading text=”4 Hours” use_theme_fonts=”yes”][vc_column_text]
 [/vc_column_text][vc_custom_heading text=”Daily” use_theme_fonts=”yes”][vc_column_text]
 [/vc_column_text][/vc_column][/vc_row]
[vc_row][vc_column][vc_column_text]
Wave [iii] baby!
Crude has lost a 1000 points in 10 days trading.
That’s a heck of a loss for any market,
But especially crude oil,
and this crash is even more glaring,
when we are supposed to have the best economy in history!
Something tells me the core is rotten and about to crumble!
I have labeled the structure as a drop in wave [iii].
And the decline in the last two days is either wave (iii) of [iii],
or, wave (v) of [iii].
Each interpretation is valid at the moment.
As we close this evening,
Wave [iii] has hit the 162% Fibonacci extension of wave [i].
This was the target for wave [iii],
so we should see a low form early next week
and wave [iv] should then correct higher in three waves for a few days.
Monday;
Watch for wave [iii] to complete and wave [iv] begin.
The initial target for wave [iv] lies at 56.99,
where wave [iii] should offer resistance.
[/vc_column_text][/vc_column][/vc_row]
[vc_row][vc_column][vc_separator border_width=”5″][/vc_column][/vc_row][vc_row][vc_column][vc_column_text]
US 10 yr Treasuries.
[/vc_column_text][/vc_column][/vc_row][vc_row][vc_column][vc_separator border_width=”5″][/vc_column][/vc_row][vc_row][vc_column width=”2/3″][vc_custom_heading text=”1 hr” use_theme_fonts=”yes”][vc_column_text]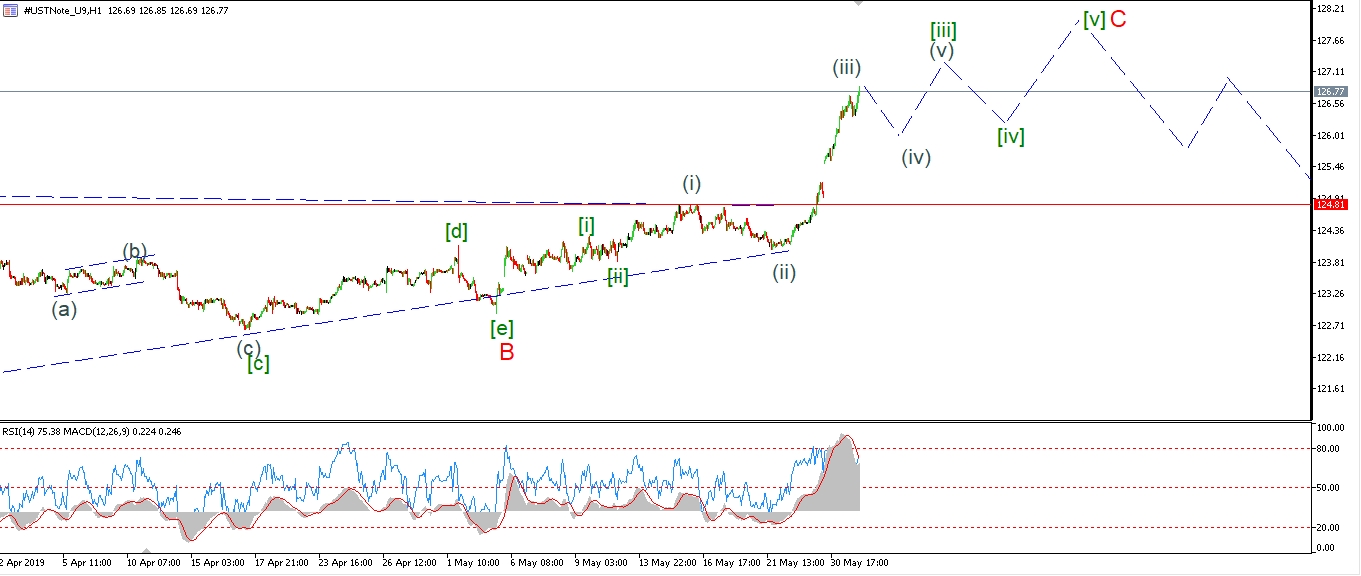 [/vc_column_text][/vc_column][vc_column width=”1/3″][vc_custom_heading text=”4 Hours” use_theme_fonts=”yes”][vc_column_text]
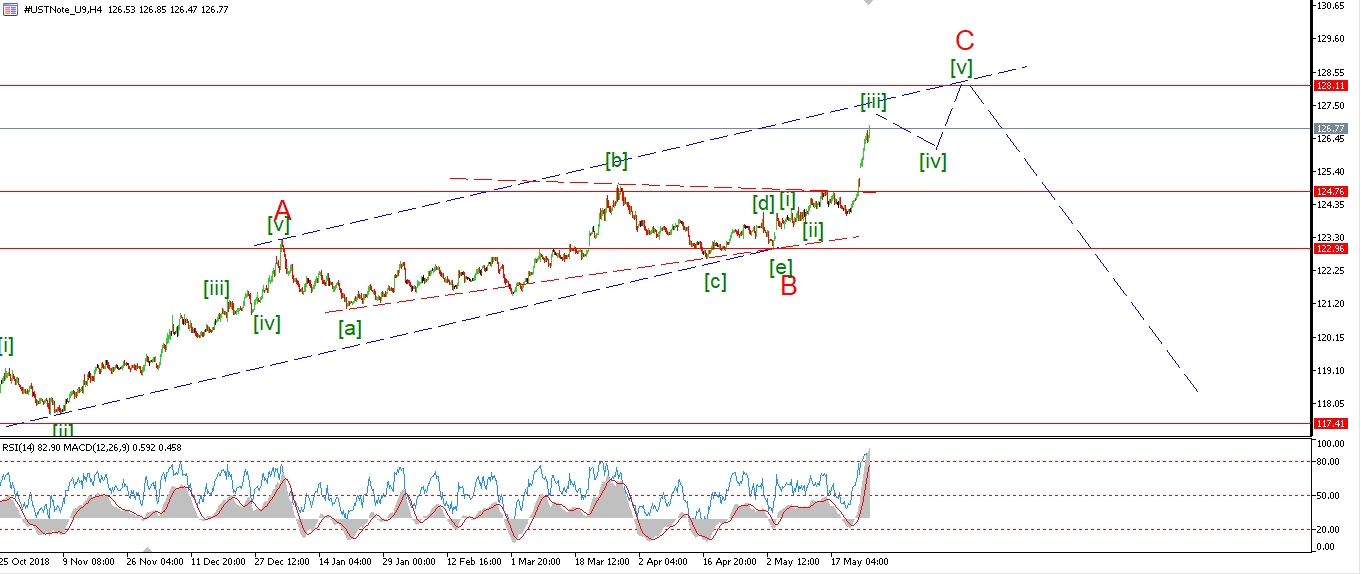 [/vc_column_text][vc_custom_heading text=”Daily” use_theme_fonts=”yes”][vc_column_text]
 [/vc_column_text][/vc_column][/vc_row]
[vc_row][vc_column][vc_column_text]
Bonds are benefiting big time from the market selloff.
And today especially as wave [iii] continues higher.
I have labelled the structure slightly differently this evening.
The wave ‘B’ triangle is re-positioned to the previous low.
And off that low,
We have a series of 1,2, waves which brought about this weeks rapid rally in wave (iii) of [iii].
The price should continue higher over the coming week towards that wave ‘C’ target of 128.00.
And when that target is in place,
I will be looking for a major turn lower to begin in the 10YR,
and the wider bond market in general.
Monday;
Watch for wave(iv) of [iii] to begin with a correction back towards 126.00 again.
[/vc_column_text][/vc_column][/vc_row]
[vc_row][vc_column][vc_separator border_width=”5″][/vc_column][/vc_row][vc_row][vc_column][vc_column_text]
SILVER
[/vc_column_text][/vc_column][/vc_row][vc_row][vc_column][vc_separator border_width=”5″][/vc_column][/vc_row][vc_row][vc_column width=”2/3″][vc_custom_heading text=”1 hr” use_theme_fonts=”yes”][vc_column_text]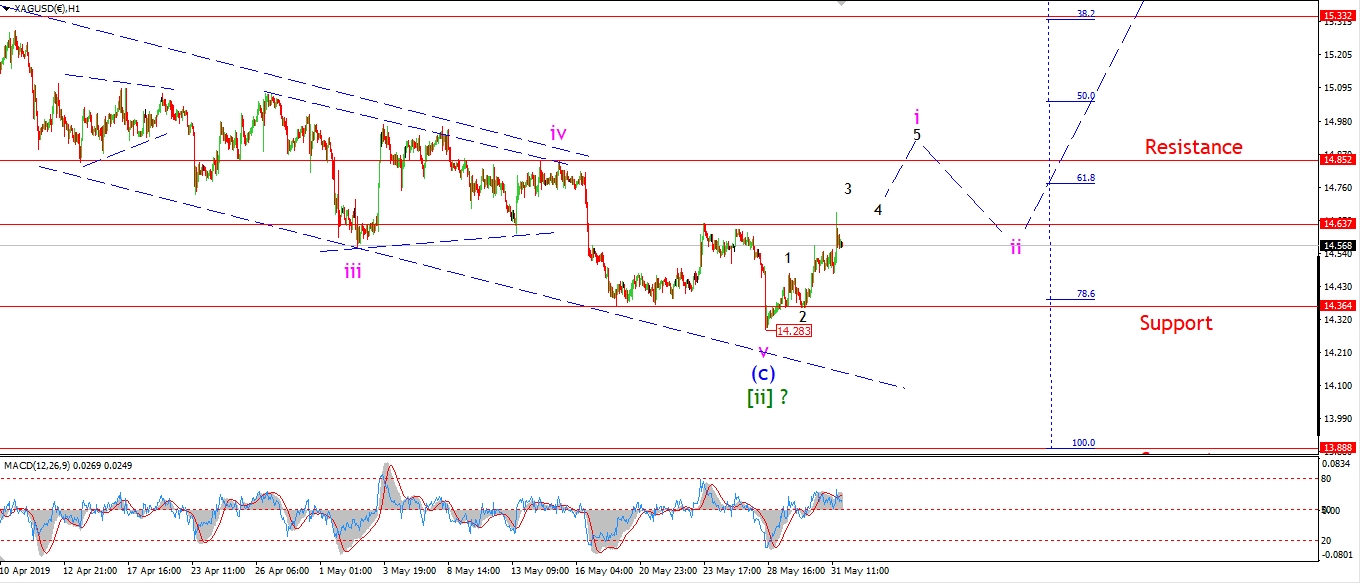 [/vc_column_text][/vc_column][vc_column width=”1/3″][vc_custom_heading text=”4 Hours” use_theme_fonts=”yes”][vc_column_text]
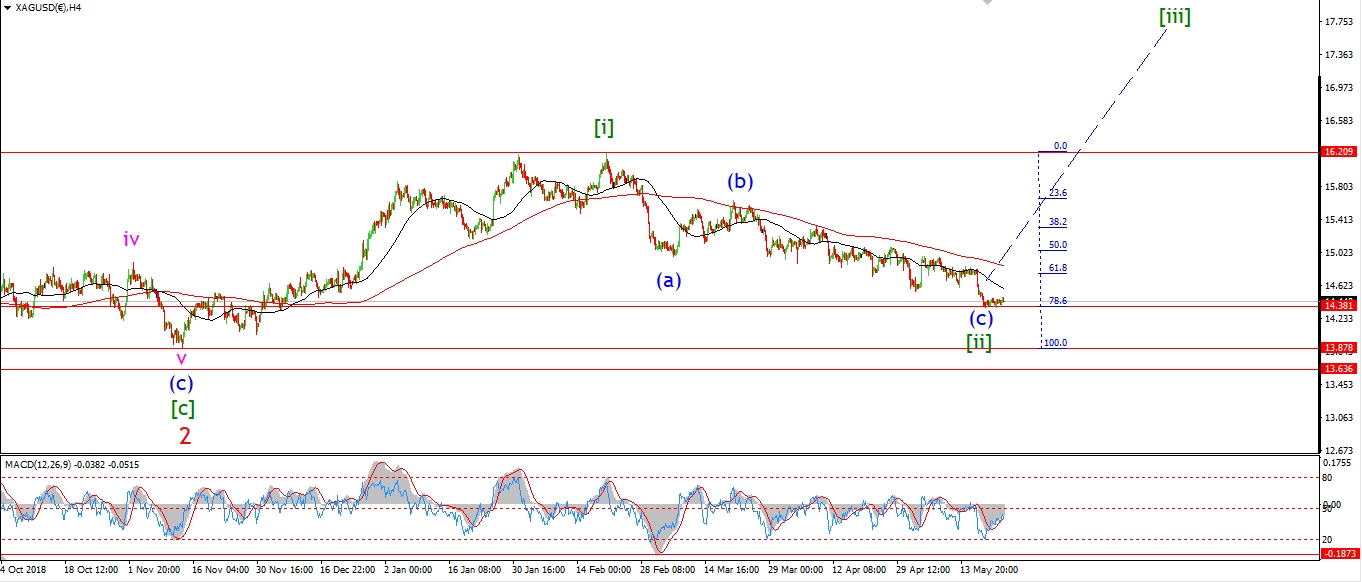 [/vc_column_text][vc_custom_heading text=”Daily” use_theme_fonts=”yes”][vc_column_text]
 [/vc_column_text][/vc_column][/vc_row]
[vc_row][vc_column][vc_column_text]
Silver spiked higher again today,
and even brought a brief break of 14.63 before dropping this evening.
We are on target for a bullish impulse wave higher to develop next week.
If we get a further rally above 14.85 in a five wave form,
then I will be much more confident about calling the turn in place.
Monday;
Watch for wave ‘i’ to continue higher and complete above 14.85.
[/vc_column_text][/vc_column][/vc_row]
[vc_row][vc_column][vc_separator border_width=”5″][/vc_column][/vc_row][vc_row][vc_column][vc_column_text]
S&P 500.
[/vc_column_text][/vc_column][/vc_row][vc_row][vc_column][vc_separator border_width=”5″][/vc_column][/vc_row][vc_row][vc_column width=”2/3″][vc_custom_heading text=”1 hr” use_theme_fonts=”yes”][vc_column_text]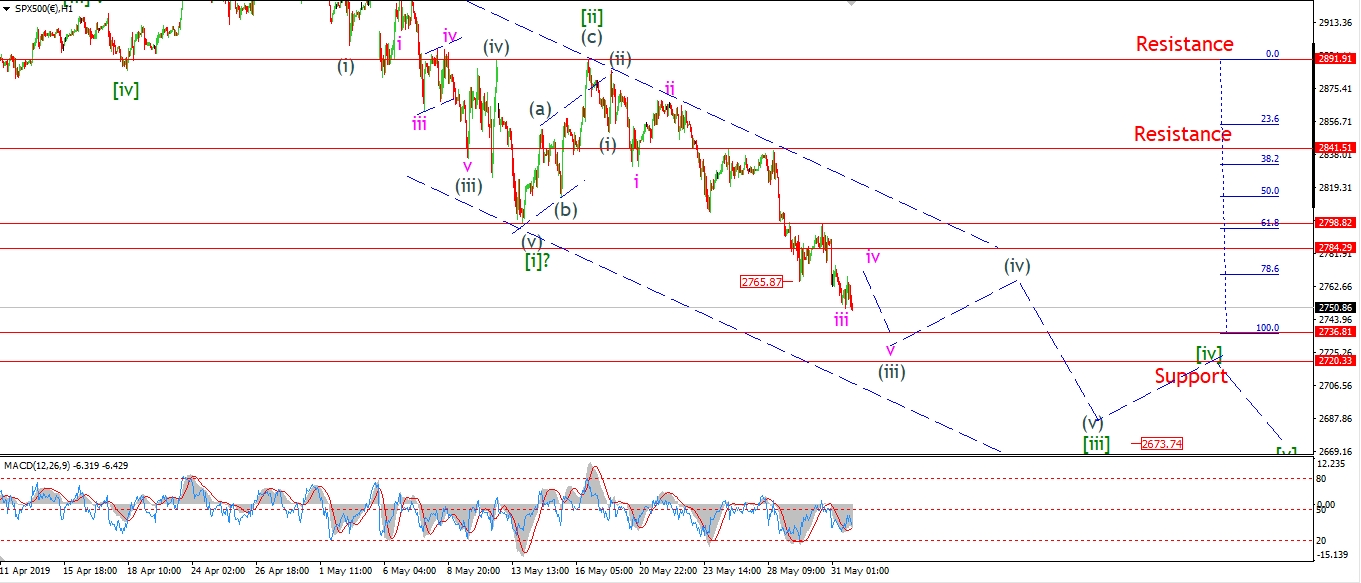 [/vc_column_text][/vc_column][vc_column width=”1/3″][vc_custom_heading text=”4 Hours” use_theme_fonts=”yes”][vc_column_text]
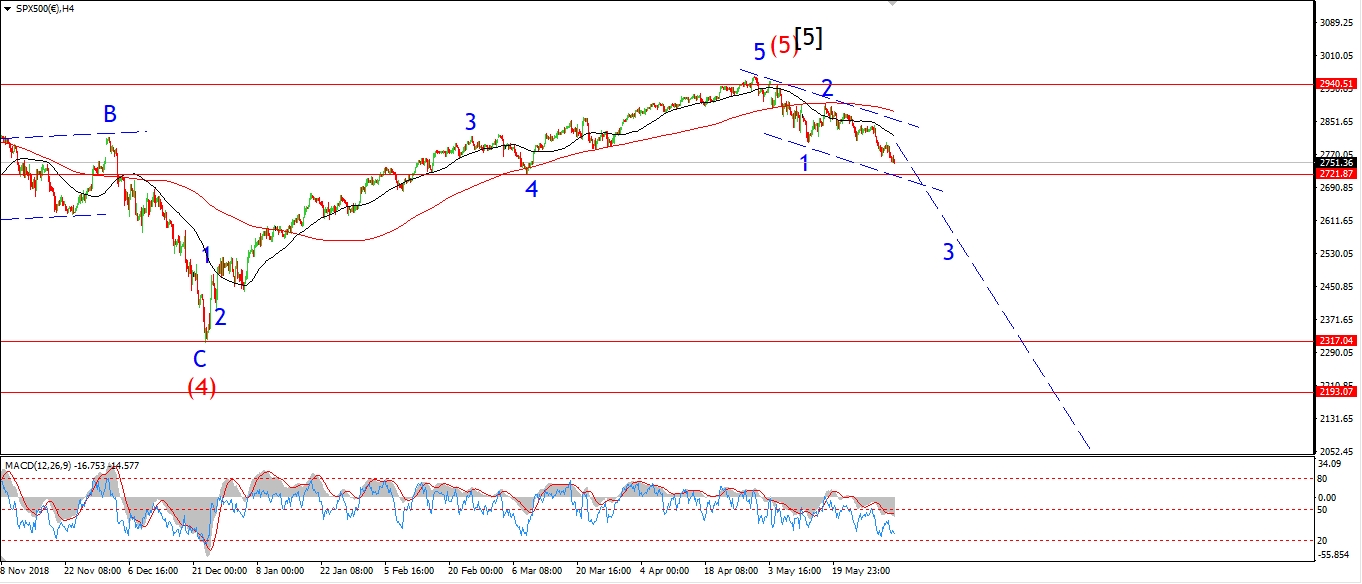 [/vc_column_text][vc_custom_heading text=”Daily” use_theme_fonts=”yes”][vc_column_text]
 [/vc_column_text][/vc_column][/vc_row]
[vc_row][vc_column][vc_column_text]
A steady week of declines has brought the market down to the initial taregt range for wave [iii] green.
That level lies at 2736 where wave [iii] reaches 100% of wave [i].
I expect that wave [iii] should extend below that level when fully complete.
The lower target lies at the 162% Fib level at 2640.
This evenings low is labelled wave ‘iii’ of (iii).
And after a brief drop to complete wave (iii) early next week.
It looks like the market will begin a corrective rest in wave (iv),
before the market turns lower again in wave (v) of [iii].
Things are heating up in the stock market!
But we will take each day as it comes.
Monday;
Watch for wave ‘iv’ and ‘v’ to complete wave (iii) by Tuesday.
Wave (iv) will then be set to corrective higher for the rest of the week.
That is it for the week.
I hope you all have an enjoyable weekend.
And I will see you back here Monday night.
God bless and God’s speed to you all!
Enda.
[/vc_column_text][/vc_column][/vc_row]
[vc_row][vc_column][vc_separator border_width=”5″][/vc_column][/vc_row]