
[vc_row][vc_column][vc_separator border_width=”5″][/vc_column][/vc_row]
[vc_row][vc_column][vc_column_text]
Good evening folks.
[/vc_column_text][/vc_column][/vc_row]
[vc_row][vc_column][vc_separator border_width=”5″][/vc_column][/vc_row]
[vc_row][vc_column][vc_column_text]
EURUSD
[/vc_column_text][/vc_column][/vc_row]
[vc_row][vc_column][vc_separator border_width=”5″][/vc_column][/vc_row][vc_row][vc_column width=”2/3″][vc_custom_heading text=”1 hr” use_theme_fonts=”yes”][vc_column_text]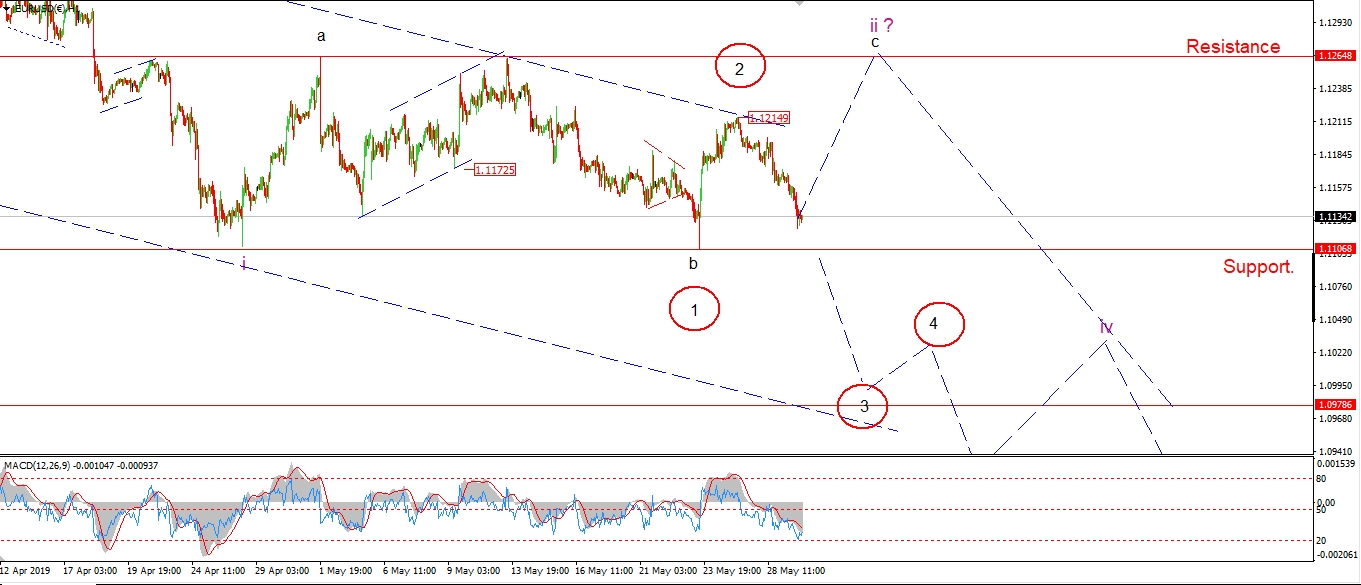 [/vc_column_text][/vc_column][vc_column width=”1/3″][vc_custom_heading text=”4 Hours” use_theme_fonts=”yes”][vc_column_text]
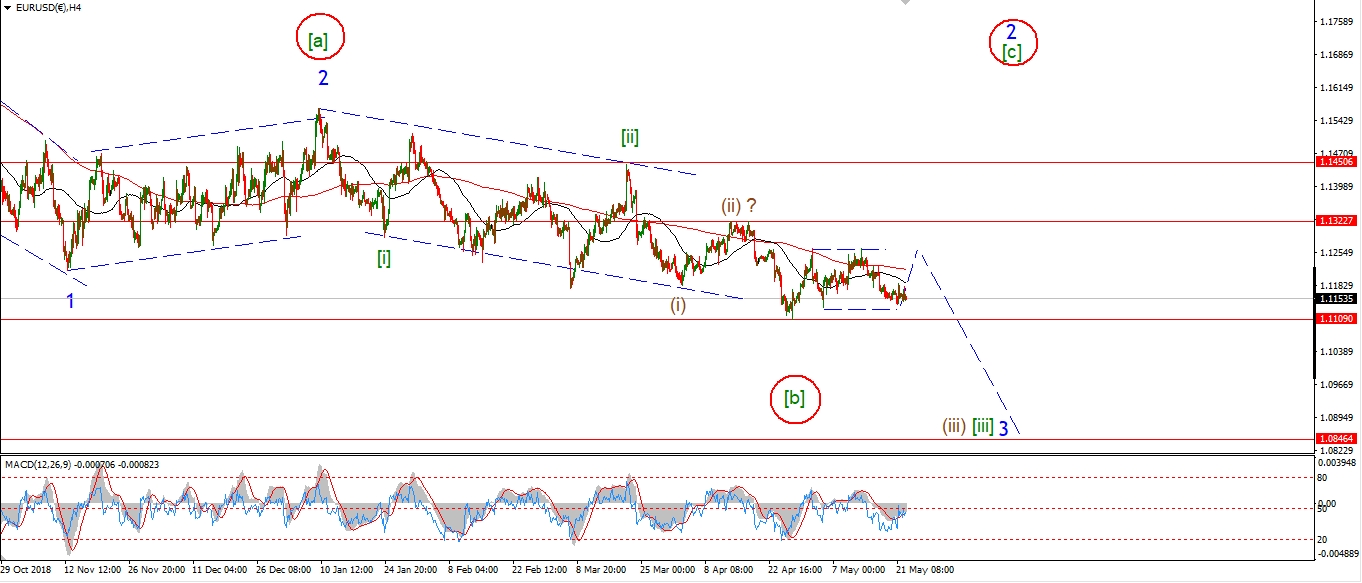 [/vc_column_text][vc_custom_heading text=”Daily” use_theme_fonts=”yes”][vc_column_text]
 [/vc_column_text][/vc_column][/vc_row]
[vc_row][vc_column][vc_column_text]
EURUSD is inching closer to breaking support at 1.1106 again
and in doing so re-instating the previous interpretation shown last week.
Both wave counts shown, call for an extended drop into wave ‘iii’ pink.
The main difference is the interpretation of wave ‘ii’.
A break above 1.1214 will confirm that the larger wave ‘ii’ is in force,
however if we break 1.1106 again then we should expect wave ‘iii’ down
to continue towards the lower trend channel line at 1.0978.
Tomorrow;
watch for a possible push lower into wave ‘3’ of ‘iii’ with a break of 1.1106.
[/vc_column_text][/vc_column][/vc_row]
[vc_row][vc_column][vc_separator border_width=”5″][/vc_column][/vc_row][vc_row][vc_column][vc_column_text]
GBPUSD
[/vc_column_text][/vc_column][/vc_row][vc_row][vc_column][vc_separator border_width=”5″][/vc_column][/vc_row][vc_row][vc_column width=”2/3″][vc_custom_heading text=”1 hr” use_theme_fonts=”yes”][vc_column_text]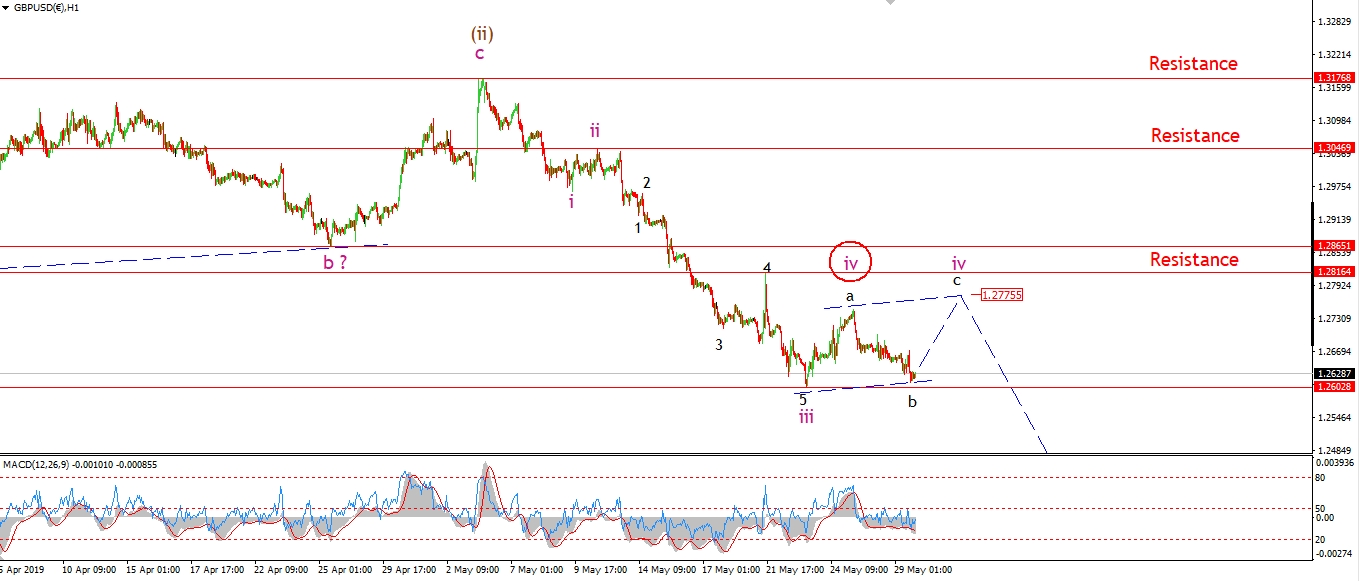 [/vc_column_text][/vc_column][vc_column width=”1/3″][vc_custom_heading text=”4 Hours” use_theme_fonts=”yes”][vc_column_text]
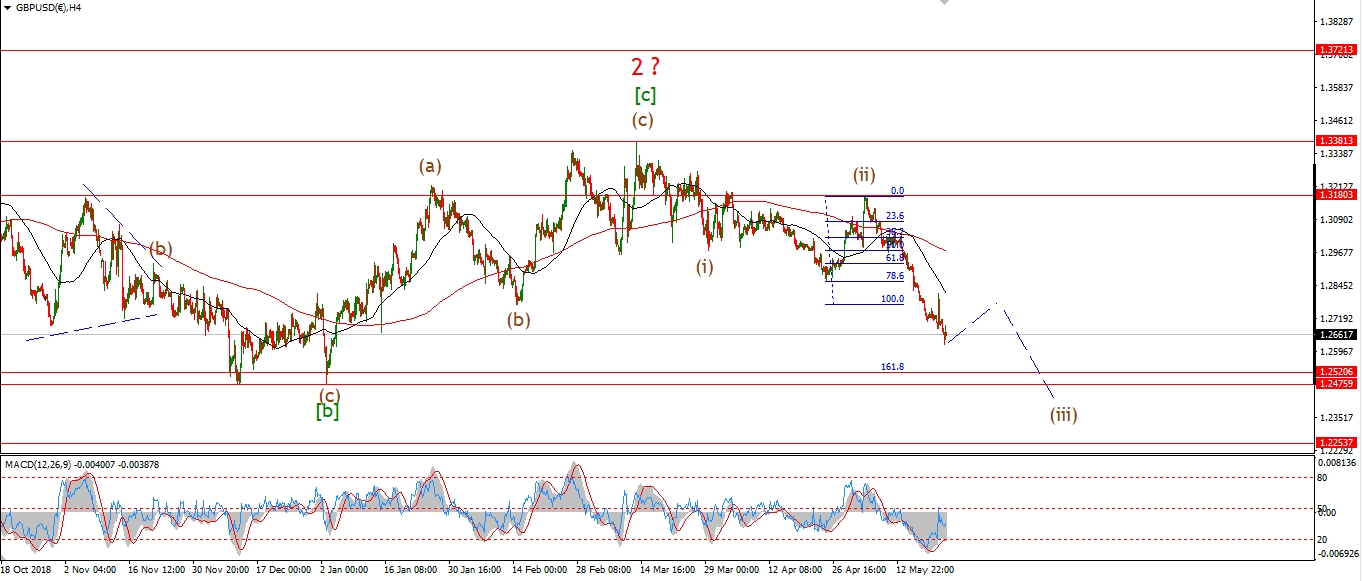 [/vc_column_text][vc_custom_heading text=”Daily” use_theme_fonts=”yes”][vc_column_text]
 [/vc_column_text][/vc_column][/vc_row]
[vc_row][vc_column][vc_column_text]
Wave ‘iv’ is still driving the short term action in cable today.
Wave ‘b’ of ‘iv’ has dropped towards the initial support level at 1.2608.
The decline in wave ‘b’ looks corrective though,
so I expect wave ‘c’ of ‘iv’ to push higher again into the 1.2770 area to complete a three wave correction.
Once this correction is complete,
the next move should be a decline in wave ‘v’ of (iii).
The target for wave (iii) to complete lies at 125.20.
Tomorrow;
Watch for wave ‘c’ to rally back towards 1.2770 to complete wave ‘iv’.
A break of 1.2602 will favor the alternate wave ‘iv’ shown circled in red.
[/vc_column_text][/vc_column][/vc_row]
[vc_row][vc_column][vc_separator border_width=”5″][/vc_column][/vc_row][vc_row][vc_column][vc_column_text]
USDJPY
[/vc_column_text][/vc_column][/vc_row][vc_row][vc_column][vc_separator border_width=”5″][/vc_column][/vc_row][vc_row][vc_column width=”2/3″][vc_custom_heading text=”1 hr” use_theme_fonts=”yes”][vc_column_text]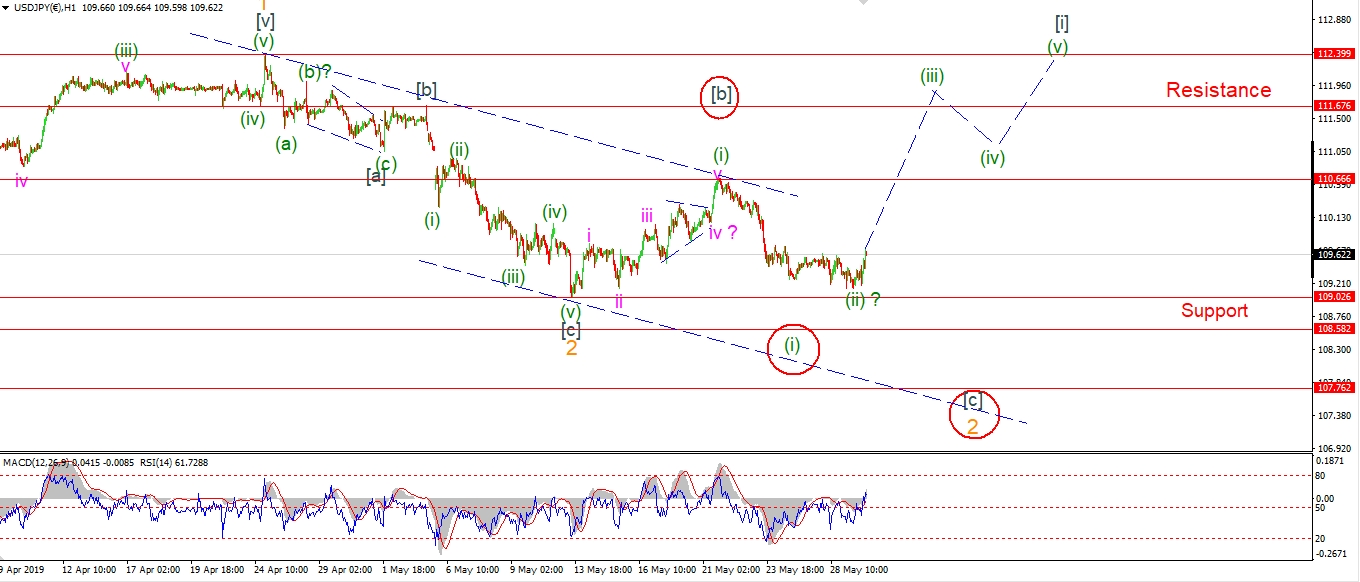 [/vc_column_text][/vc_column][vc_column width=”1/3″][vc_custom_heading text=”4 Hours” use_theme_fonts=”yes”][vc_column_text]
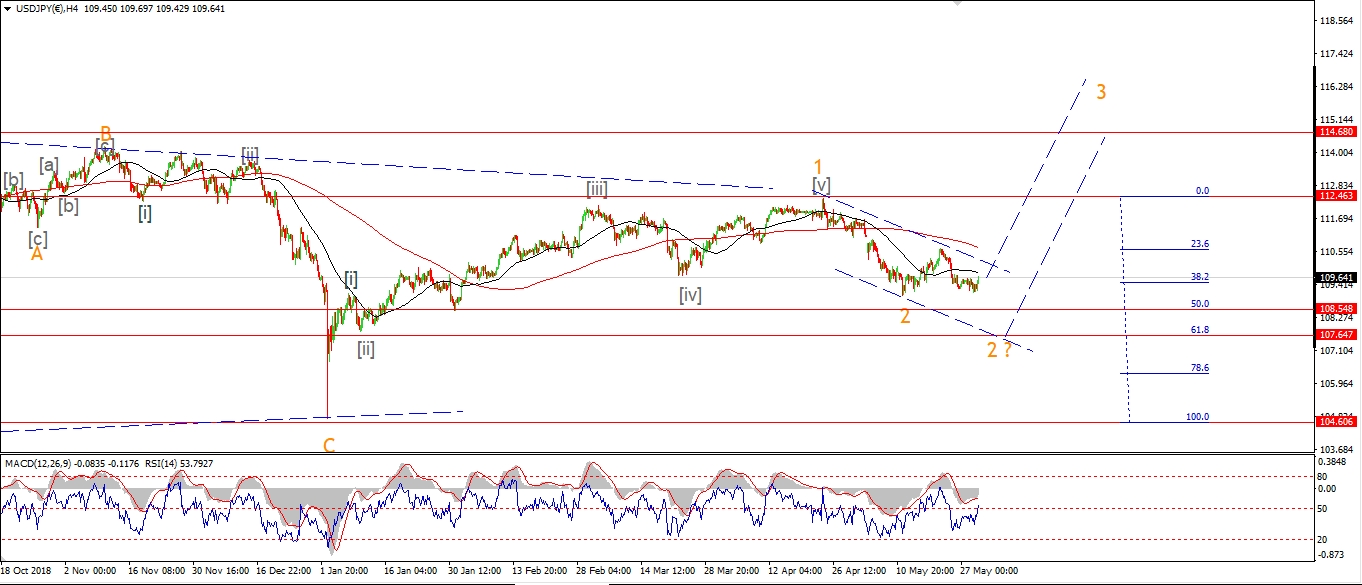 [/vc_column_text][vc_custom_heading text=”Daily” use_theme_fonts=”yes”][vc_column_text]
 [/vc_column_text][/vc_column][/vc_row]
[vc_row][vc_column][vc_column_text]
USDJPY is again hanging down at support just waiting to break and invalidate the bullish count.
109.02 is the key level in the short term now.
A break of that level will trigger the alternate count for wave ‘2’.
And then wave [c] of ‘2’ will head lower to the target range between 108.50 at 107.60.
This is shown best on the 4hr chart.
Tomorrow;
At the moment its a case of wait and see for USDJPY.
The current count can still be saved with another bullish impulse wave off these lows.
But a break of 109.02 will postpone the rally in wave ‘3’ for another week or so as the correction completes.
[/vc_column_text][/vc_column][/vc_row]
[vc_row][vc_column][vc_separator border_width=”5″][/vc_column][/vc_row][vc_row][vc_column][vc_column_text]
DOW JONES INDUSTRIALS
[/vc_column_text][/vc_column][/vc_row][vc_row][vc_column][vc_separator border_width=”5″][/vc_column][/vc_row][vc_row][vc_column width=”2/3″][vc_custom_heading text=”1 hr” use_theme_fonts=”yes”][vc_column_text]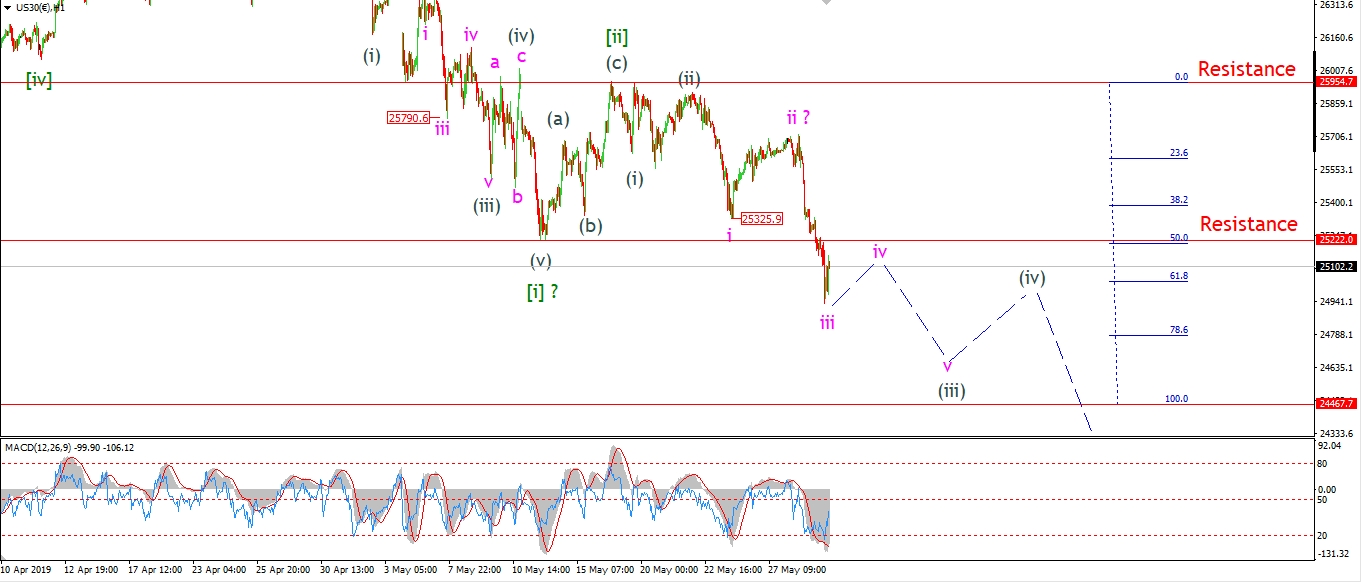 [/vc_column_text][/vc_column][vc_column width=”1/3″][vc_custom_heading text=”4 Hours” use_theme_fonts=”yes”][vc_column_text]
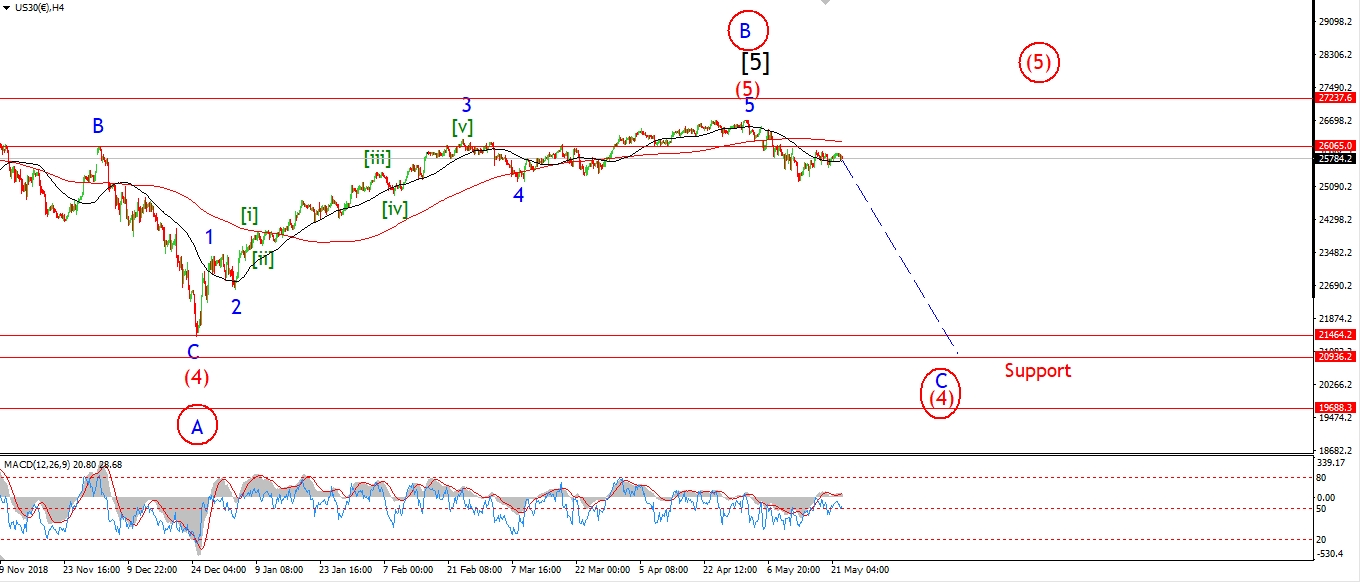 [/vc_column_text][vc_custom_heading text=”Daily” use_theme_fonts=”yes”][vc_column_text]
 [/vc_column_text][/vc_column][/vc_row]
[vc_row][vc_column][vc_column_text]
We got a pretty solid break of the lower support level at 25222 today.
This rules out the alternate wave [ii] scenario that I spoke about last week.
It now looks like wave (iii) of [iii] is fully in charge of the price action.
And this wave has the potential to drag the market back down to 24000 again
if all goes according to plan.
I have changed the short term count slightly this evening.
The decline off wave [ii] is now shown as an extending wave [iii].
With a series of 1,2 waves off 25954,
And then the declines this week are shown as wave ‘iii’ of (iii) of [iii].
That does account for the acceleration lower this week.
Tomorrow;
The price will likely hit a temporary low soon,
and then begin to trace out a corrective pattern in wave ‘iv’ of (iii).
Wave ‘iv’ should complete below 25325,
as wave ‘iv’ should not overlap the low of wave ‘i’.
Wave (iii) of [iii] should remain in force for the next few days ideally.
[/vc_column_text][/vc_column][/vc_row]
[vc_row][vc_column][vc_separator border_width=”5″][/vc_column][/vc_row][vc_row][vc_column][vc_column_text]
GOLD
[/vc_column_text][/vc_column][/vc_row][vc_row][vc_column][vc_separator border_width=”5″][/vc_column][/vc_row][vc_row][vc_column width=”2/3″][vc_custom_heading text=”1 hr” use_theme_fonts=”yes”][vc_column_text]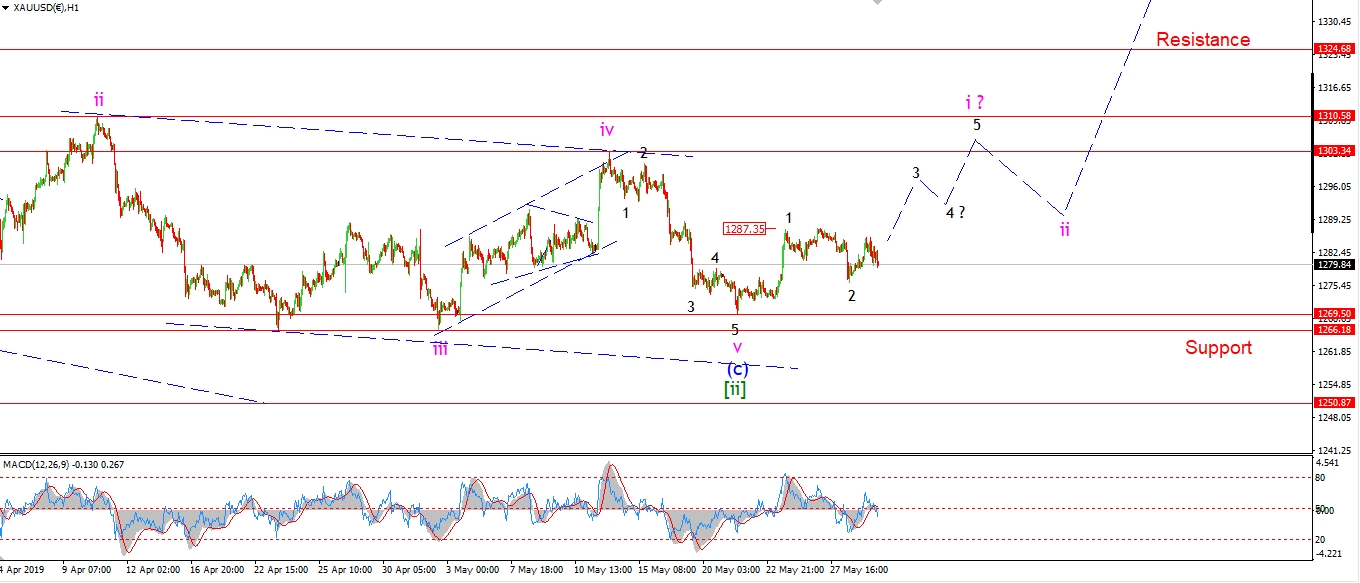 [/vc_column_text][/vc_column][vc_column width=”1/3″][vc_custom_heading text=”4 Hours” use_theme_fonts=”yes”][vc_column_text]
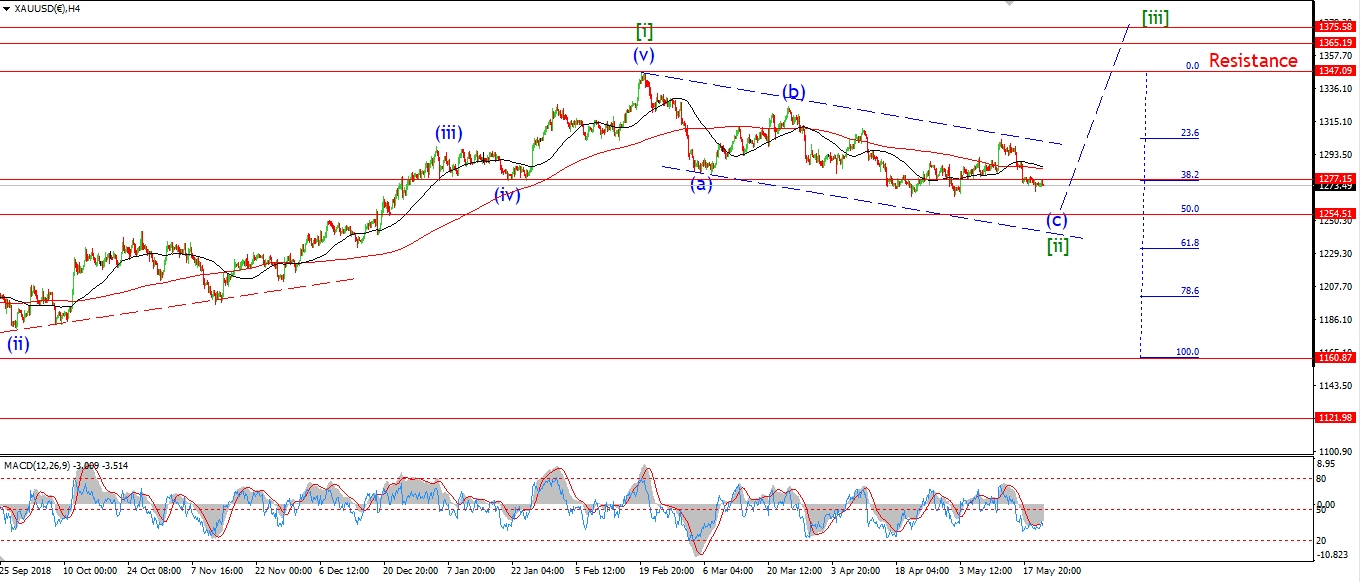 [/vc_column_text][vc_custom_heading text=”Daily” use_theme_fonts=”yes”][vc_column_text]
 [/vc_column_text][/vc_column][/vc_row]
[vc_row][vc_column][vc_column_text]
There is very little reaction to the selloff in stocks today in the gold market.
The price is holding above the wave ‘2’ lows so far,
so I am taking this as positive for the developing bullish wave count.
I wrote about the extended bear-market in silver last night.
The very same dynamic is in play for gold.
The last eight years have been awful for the gold market.
But I think the large [C] wave rally is brewing in gold,
and this rally should take us above the all time high again.
This should happen with a backdrop of a crashing stock market and economy.
but this is a longer term play.
Back to the short term again.
Tomorrow;
I have not yet identified a fully developed impulsive structure off the lows of wave [ii].
Lets see if the price continue higher tomorrow in wave ‘3’ of ‘i’.
[/vc_column_text][/vc_column][/vc_row]
[vc_row][vc_column][vc_separator border_width=”5″][/vc_column][/vc_row][vc_row][vc_column][vc_column_text]
U.S CRUDE OIL
[/vc_column_text][/vc_column][/vc_row][vc_row][vc_column][vc_separator border_width=”5″][/vc_column][/vc_row][vc_row][vc_column width=”2/3″][vc_custom_heading text=”1 hr” use_theme_fonts=”yes”][vc_column_text]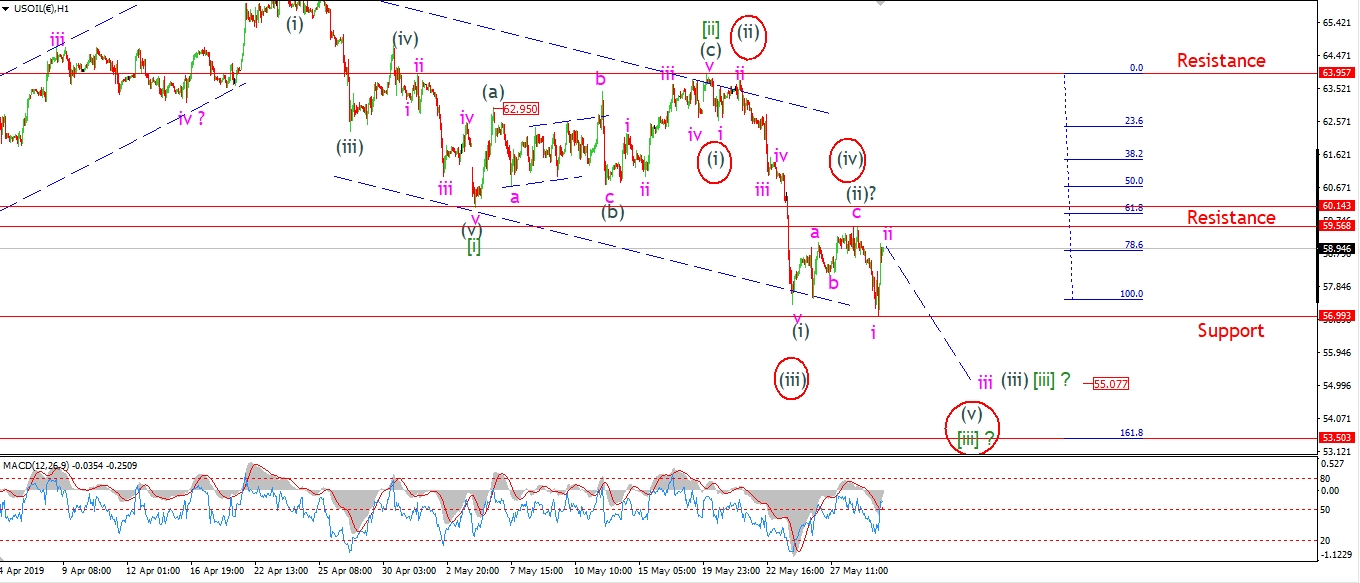 [/vc_column_text][/vc_column][vc_column width=”1/3″][vc_custom_heading text=”4 Hours” use_theme_fonts=”yes”][vc_column_text]
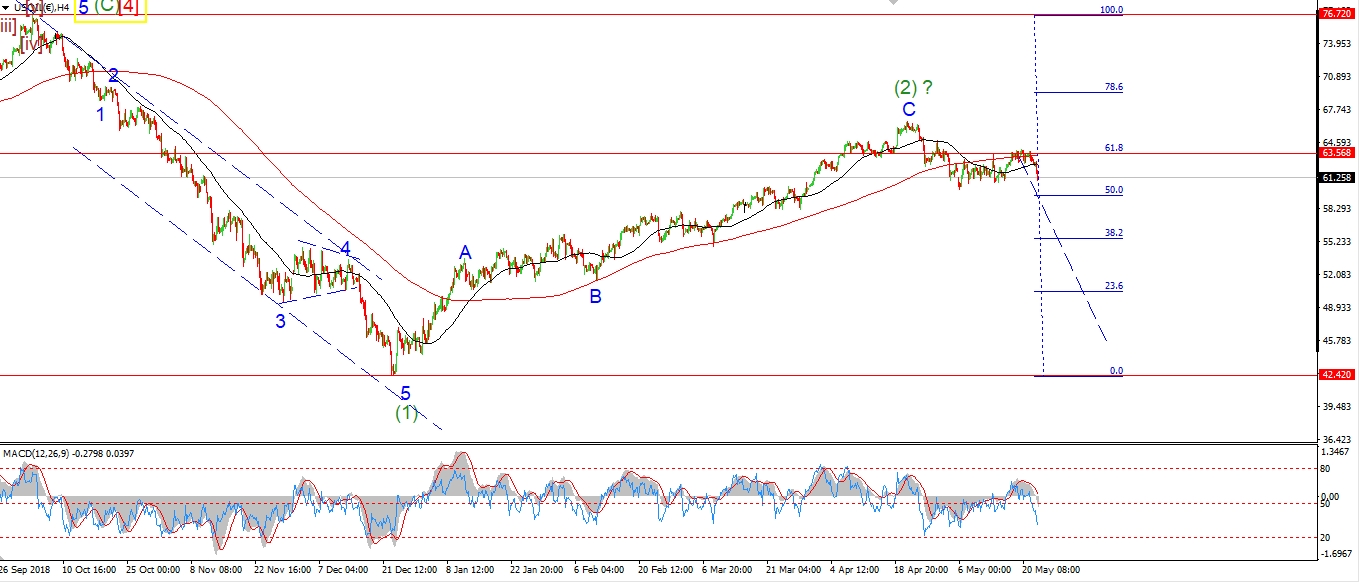 [/vc_column_text][vc_custom_heading text=”Daily” use_theme_fonts=”yes”][vc_column_text]
 [/vc_column_text][/vc_column][/vc_row]
[vc_row][vc_column][vc_column_text]
Crude moved sharply lower this morning and broke the recent wave (i) low.
This decline is labelled as wave ‘i’ of (iii).
and the rally off the session low today is labelled wave ‘ii’ of (iii).
If this short term count is correct,
Then we are about to head into an acceleration lower in wave ‘iii’ of (iii).
The high of wave (ii) at 59.56 must hold in order for that to happen.
And a break of todays low at 56.99 will signal that wave ‘iii’ of (iii) is underway.
Tomorrow;
watch for 59.56 to hold and a return lower in wave ‘iii’ to break initial support.
A break of support will rule out the alternate wave count shown.
[/vc_column_text][/vc_column][/vc_row]
[vc_row][vc_column][vc_separator border_width=”5″][/vc_column][/vc_row][vc_row][vc_column][vc_column_text]
US 10 yr Treasuries.
[/vc_column_text][/vc_column][/vc_row][vc_row][vc_column][vc_separator border_width=”5″][/vc_column][/vc_row][vc_row][vc_column width=”2/3″][vc_custom_heading text=”1 hr” use_theme_fonts=”yes”][vc_column_text]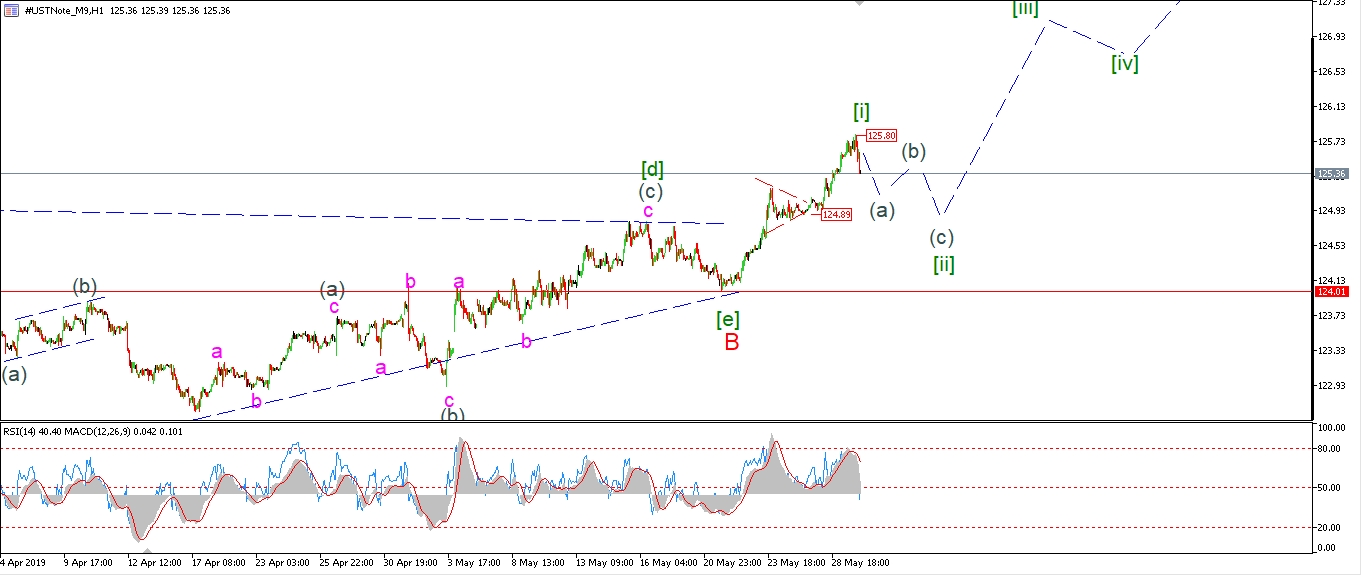 [/vc_column_text][/vc_column][vc_column width=”1/3″][vc_custom_heading text=”4 Hours” use_theme_fonts=”yes”][vc_column_text]
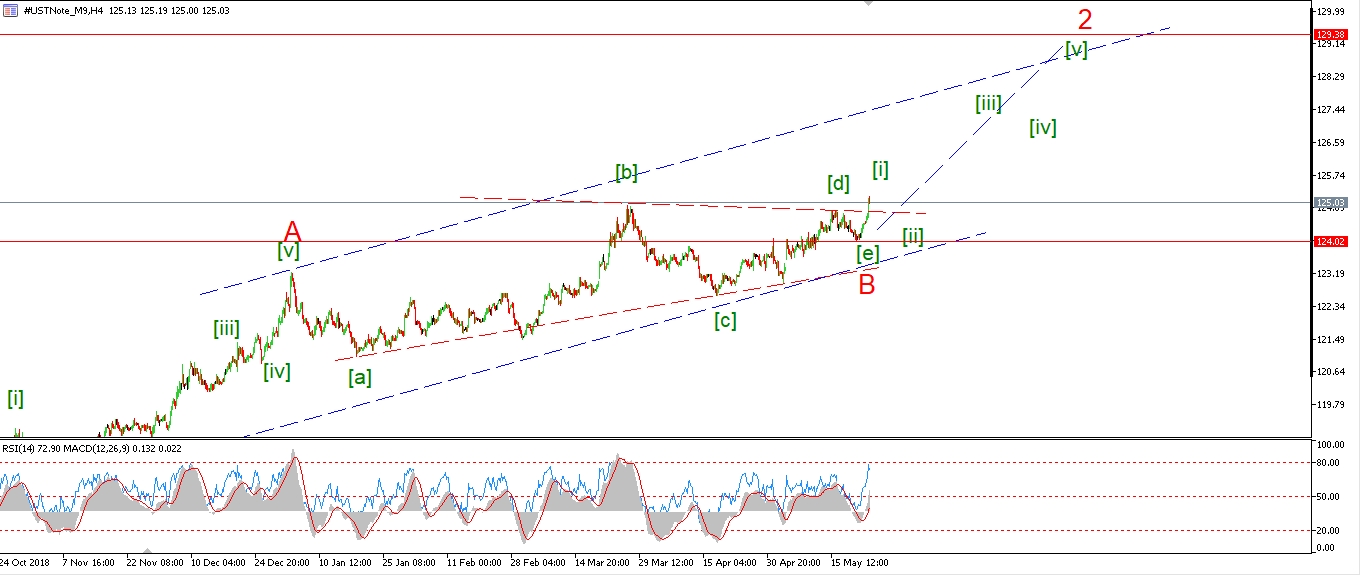 [/vc_column_text][vc_custom_heading text=”Daily” use_theme_fonts=”yes”][vc_column_text]
 [/vc_column_text][/vc_column][/vc_row]
[vc_row][vc_column][vc_column_text]
The price is declining sharply off the highs at 125.80 this evening,
this is labelled wave (a) of [ii] at the moment.
Wave [ii] should create a three wave structure lower over the next few days, and complete above 124.01.
The previous fourth wave at 124.89 will offer at least short term support.
so this is the initial target for wave [ii].
Tomorrow;
Watch for wave (a) to continue lower into about 125.00 before wave (b) rallies to a lower high again.
[/vc_column_text][/vc_column][/vc_row]
[vc_row][vc_column][vc_separator border_width=”5″][/vc_column][/vc_row][vc_row][vc_column][vc_column_text]
SILVER
[/vc_column_text][/vc_column][/vc_row][vc_row][vc_column][vc_separator border_width=”5″][/vc_column][/vc_row][vc_row][vc_column width=”2/3″][vc_custom_heading text=”1 hr” use_theme_fonts=”yes”][vc_column_text]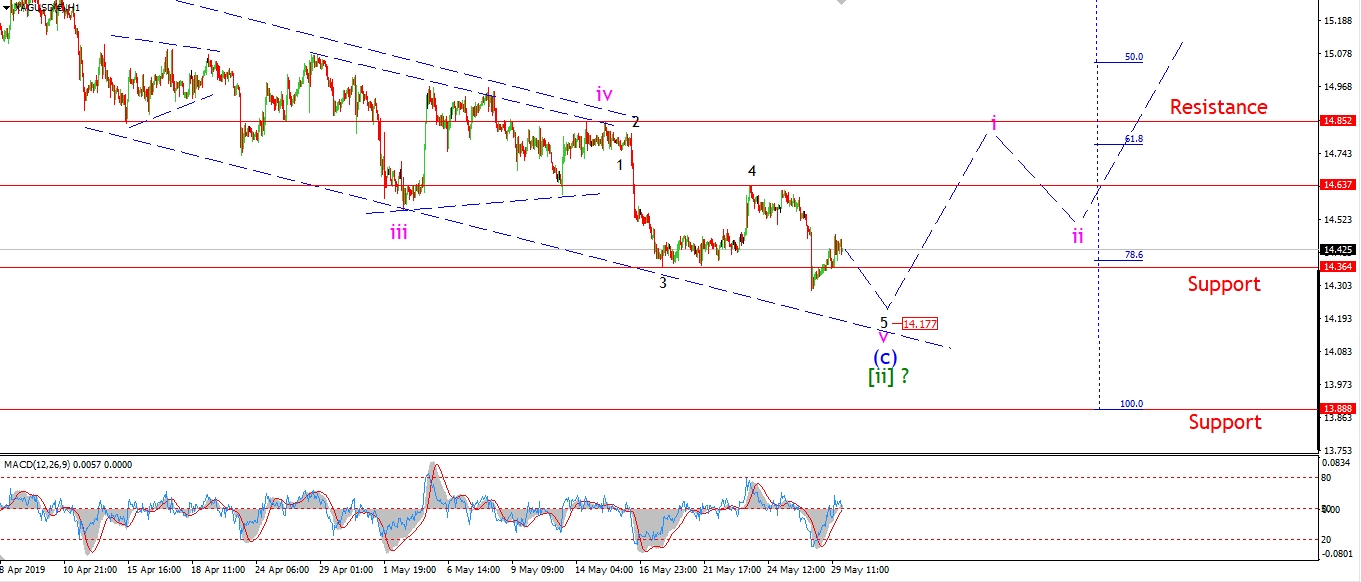 [/vc_column_text][/vc_column][vc_column width=”1/3″][vc_custom_heading text=”4 Hours” use_theme_fonts=”yes”][vc_column_text]
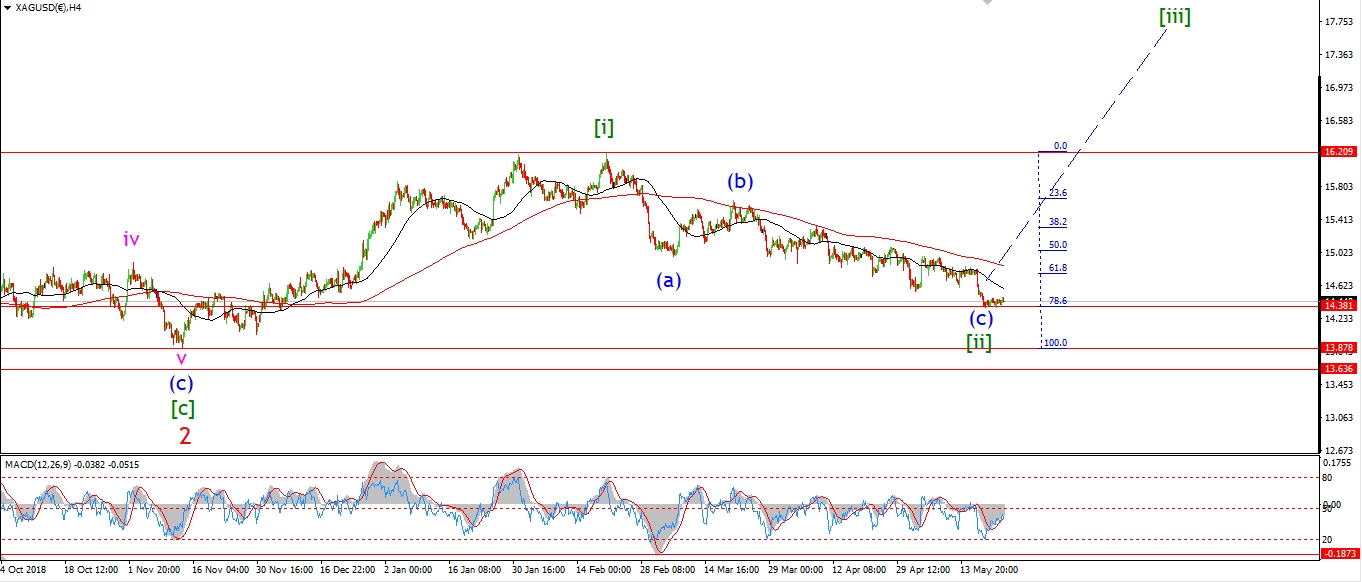 [/vc_column_text][vc_custom_heading text=”Daily” use_theme_fonts=”yes”][vc_column_text]
 [/vc_column_text][/vc_column][/vc_row]
[vc_row][vc_column][vc_column_text]
The rise off Tuesdays lows still looks corrective for now.
And the short term count favors a final decline into 14.20 again to complete wave ‘v’.
We now have 2 separate fourth waves above the current levels.
Wave ‘4’ of ‘v’ at 14.63,
and wave ‘iv’ of (c) at 14.85.
These levels are the main hurdles from this point on.
A break of 14.85 again in a five wave pattern is what I am looking for over the coming days.
This would be ideal to begin the next leg up for silver.
A break of the lower level at 14.63 will be the first sign that the tide is turning.
Tomorrow;
Watch for wave ‘v’ to complete at 14.20 an then an initial spike higher to begin wave ‘i’.
[/vc_column_text][/vc_column][/vc_row]
[vc_row][vc_column][vc_separator border_width=”5″][/vc_column][/vc_row][vc_row][vc_column][vc_column_text]
S&P 500.
[/vc_column_text][/vc_column][/vc_row][vc_row][vc_column][vc_separator border_width=”5″][/vc_column][/vc_row][vc_row][vc_column width=”2/3″][vc_custom_heading text=”1 hr” use_theme_fonts=”yes”][vc_column_text]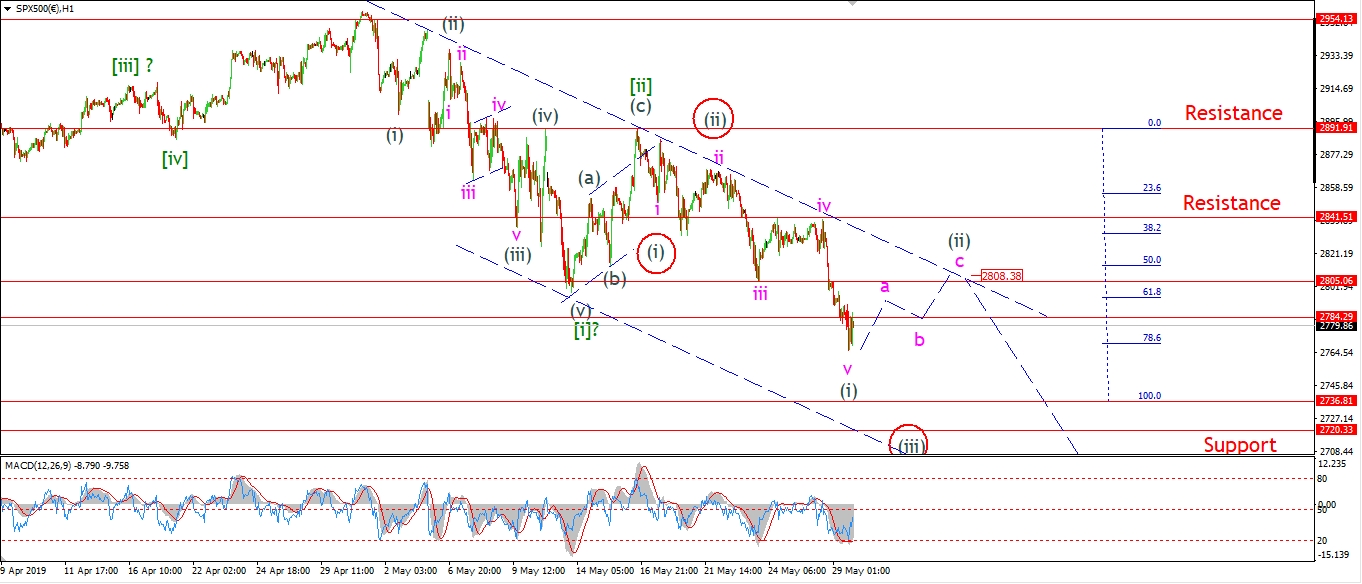 [/vc_column_text][/vc_column][vc_column width=”1/3″][vc_custom_heading text=”4 Hours” use_theme_fonts=”yes”][vc_column_text]
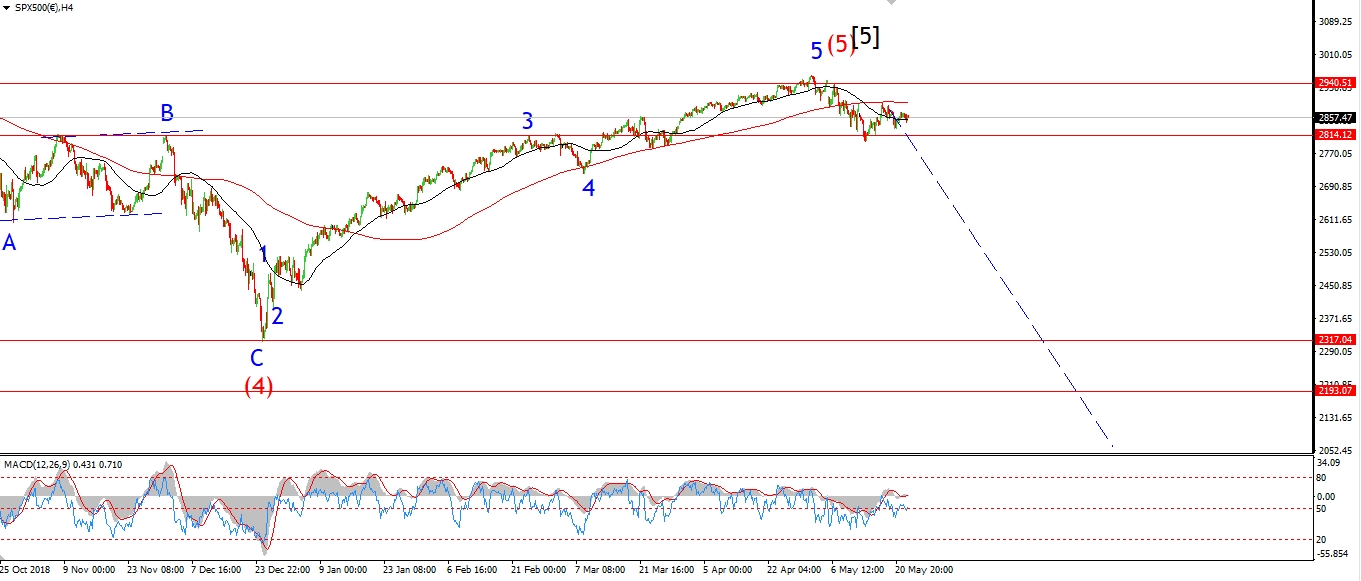 [/vc_column_text][vc_custom_heading text=”Daily” use_theme_fonts=”yes”][vc_column_text]
 [/vc_column_text][/vc_column][/vc_row]
[vc_row][vc_column][vc_column_text]
The S&P has now broken support at 2784 today,
and with that I have ruled out the alternate wave [ii] count also.
The price is now moving lower in wave [iii] green.
With todays lows labelled as a possible wave (i) of [iii].
The market should correct higher in wave (ii) over the coming days.
but I would like to see the declining trend channel hold the price form the moment.
This suggests a high for wave (ii) at 2808,
and then a return lower again in wave (iii) of [iii].
The larger wave [iii] down has a minimum target at 2736,
where wave [iii] reaches equality with wave [i].
And a lower target at 2640 where wave [iii] hits the 162% extension of wave [i].
Tomorrow;
Watch for wave (i) to find a nearby low,
and then begin a correction to about 2808 in wave (ii).
If the price fails below 2805 and moves sharply lower again that will favor the alternate count for wave (iii).
[/vc_column_text][/vc_column][/vc_row]
[vc_row][vc_column][vc_column_text]
[/vc_column_text][/vc_column][/vc_row]
[vc_row][vc_column][vc_separator border_width=”5″][/vc_column][/vc_row]