
Good evening to you all.
I know some of you are awaiting responses to your emails,
But I just failed to get on top of business today.
This usually happens when my wife goes on night duty (she is a midwife)
And ever since this lockdown came along and closed up the schools,
the luxury of sitting down and achieving inbox zero has grown even harder!
Please forgive me,
I will get back to you hopefully tomorrow.
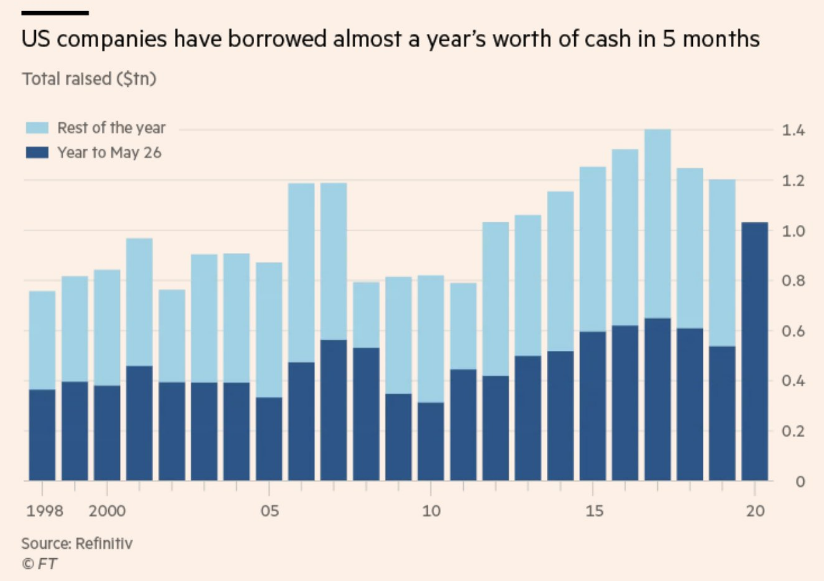
The insolvency wave is coming!
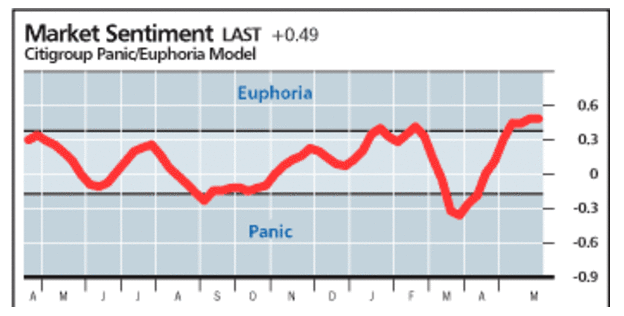
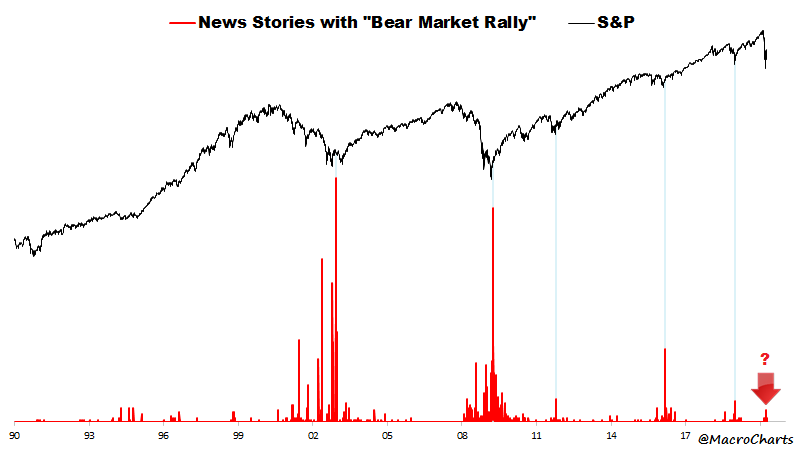
The further the market falls, and the longer the decline lasts, the more likely that we are to call any bounce just a ‘bear market rally’.
Therefore the largest amount of headlines with the term bearmarket rally in them usually come after the lows of the cycle.
And hence we discount the new rally off the lows as just a ‘bearmarket rally’, when in fact the bull market is just getting started.
Notice how there is very little talk of this current rally as a bearmarket rally, it is just a continuation of the bull market as far as most are concerned.
Another chart from John Hussman:
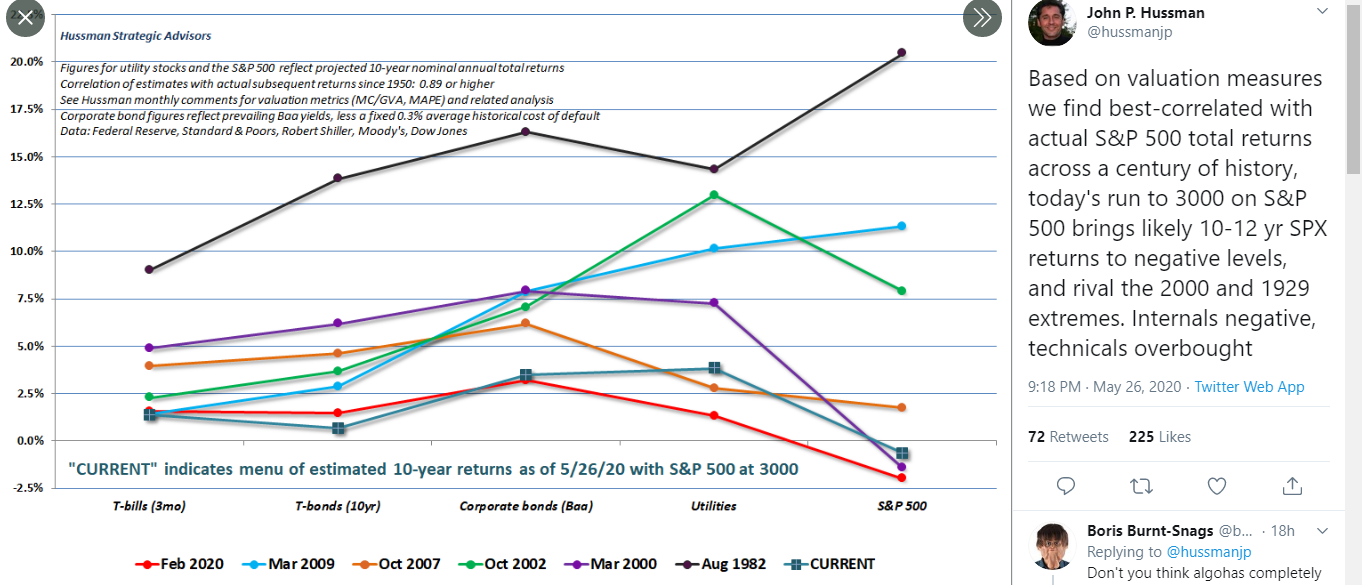
The current lower high in stocks is now up there with the February 2020 high, the March 2000 highs and the October 1929 highs in terms of extreme valuations in the market.
Does this rally continue, not according to this chart!
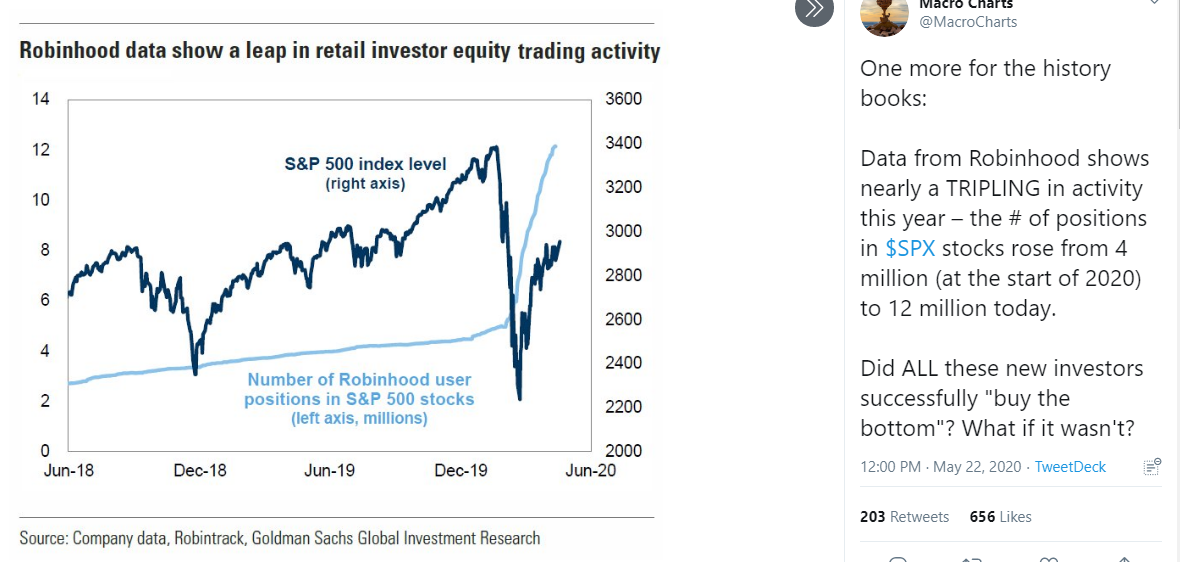
Presented without comment:
here we go.
EURUSD.
EURUSD 1hr.
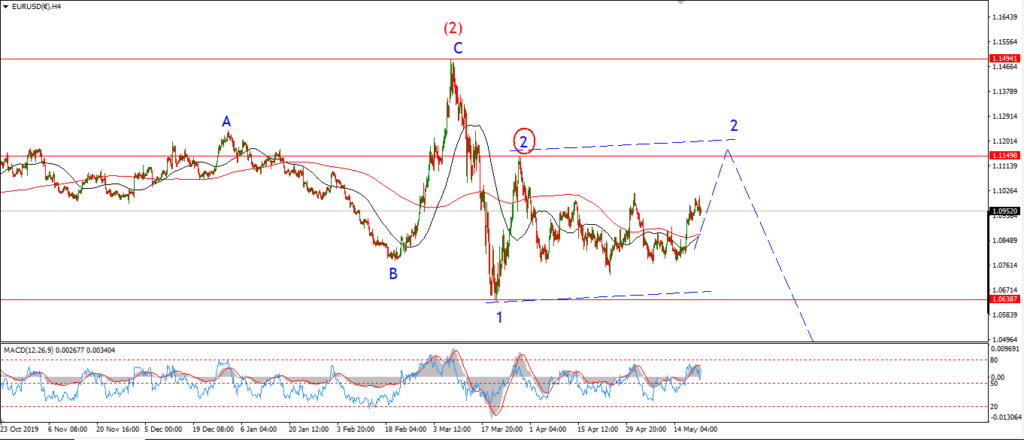
EURUSD 4hr.
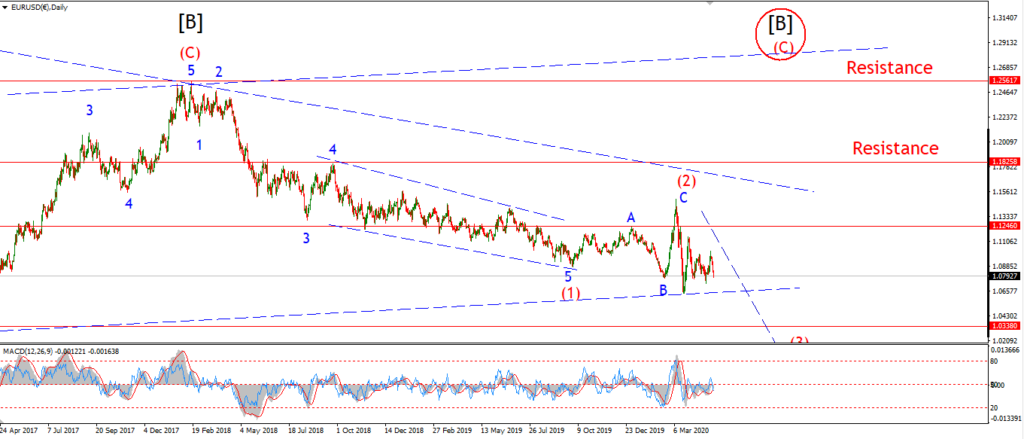
EURUSD daily.
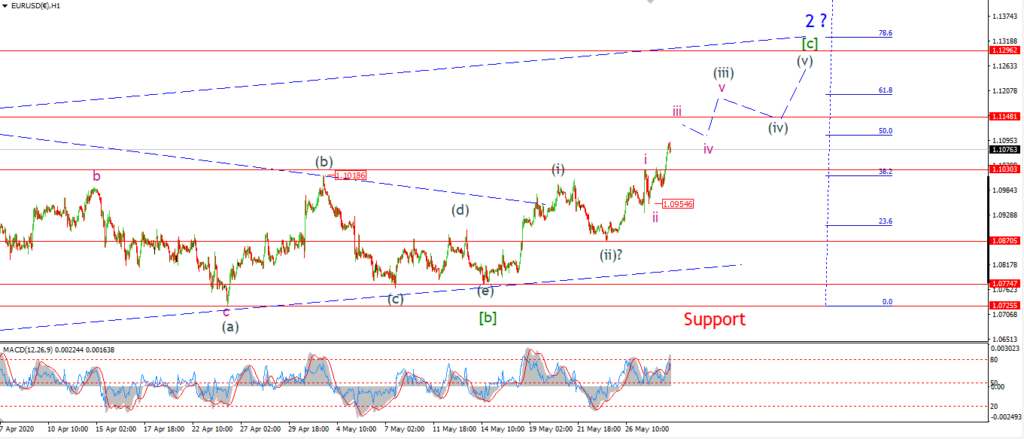
Wave ‘ii’ did complete at yesterdays lows after all.
No that wave ‘ii’ low becomes critical support to the rally ahead.
That level is 1.0954.
Wave ‘iii’ of (iii) of [c] is now underway,
and I expect this wave to push up towards the minimum target overall at 1.1150.
That is where price breaks out above the wave [a] high.
That level will also act as resistance to the rally in wave [c],
so I expect to see a series of fourth and fifth waves to begin at that point.
Tomorrow;
watch for wave ‘iii’ pink to continue higher in a clear five wave pattern.
1.1030 should act as support now.
GBPUSD
GBPUSD 1hr.
GBPUSD 4hr.
GBPUSD daily.
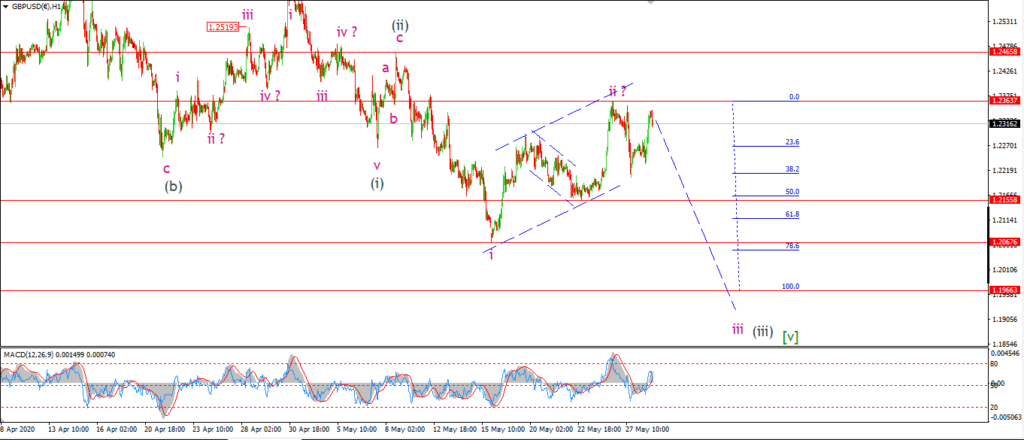
Todays action is exactly the type of rally that I did not wqant to see!
The price has pushed back up towards 1.2363 again,
and this puts pressure on the main wave count now.
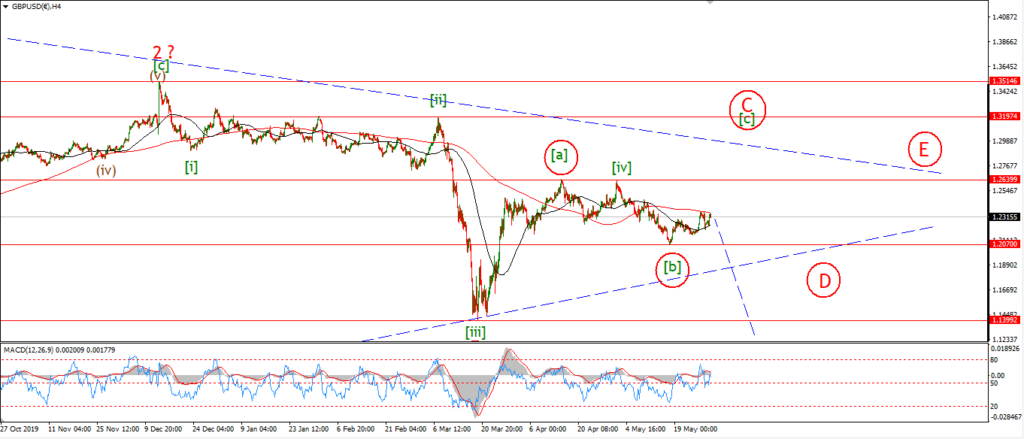
I have updated the 4hr chart to show the alternate view on this count.
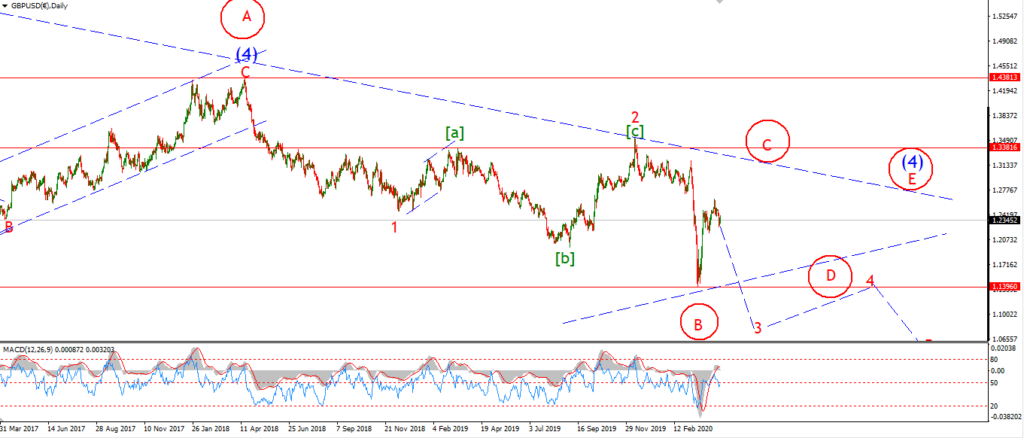
If we are beginning wave [c] of ‘C’ of the larger triangle idea.
Then we will see a break of 1.2465 pretty soon.
This is the level I have set as the trigger point for the alternate count.
So what now you might ask.
Tomorrow;
If the price does not turn lower in a big way tomorrow,
then I think the probability of the alternate count rises dramatically.
If the price rallies again tomorrow and breaks 1.2363,
I will begin to concentrate solely on the alternate count.
We are at an inflection point between wave counts now.
And the upside could be as high as 1.30 if we get a good run in that alternate wave [c].
Tomorrow is critical.
USDJPY.
USDJPY 1hr.
USDJPY 1hr.
USDJPY daily.
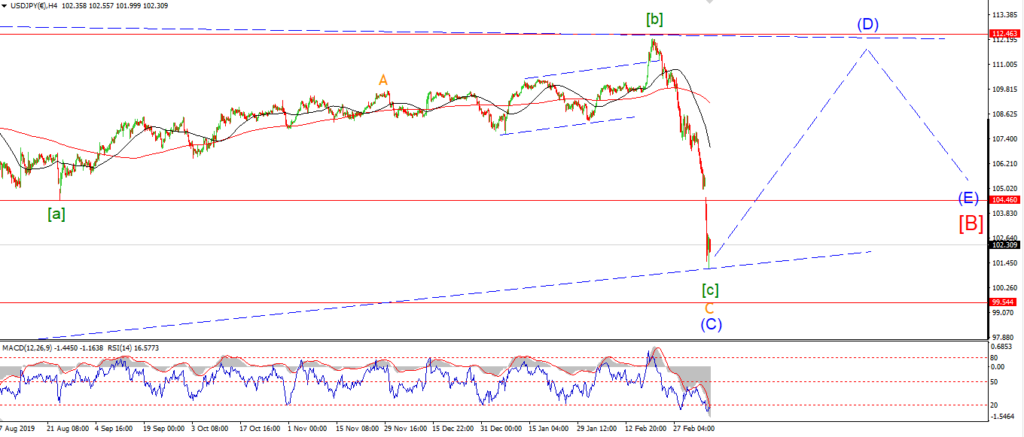
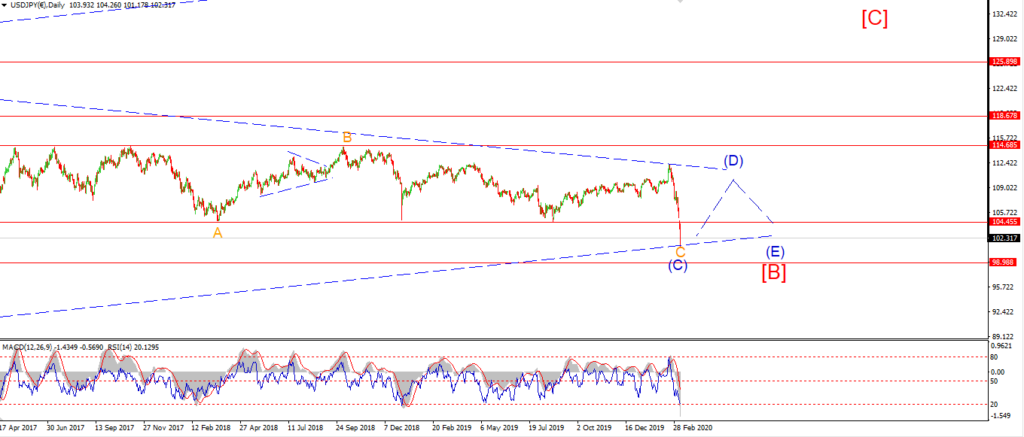
Its funny how the Japanese govt can inflate by 20% of gdp in one day and the yen does absolutely nothing!
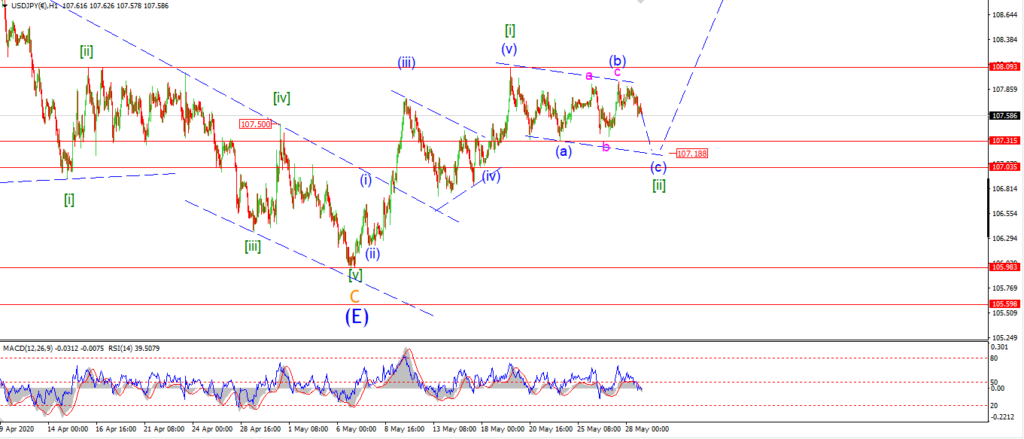
Wave (c) is slow to get going today.
The overall pattern in wave [ii] is still on track,
but I need to see one more drop into the 107.00 area to complete a three wave correction as shown.
The minimum target for wave (c) in this scenario is for a break of the wave (a) low at 107.62.
Once we hit that point,
I will begin to look for a turn higher into wave [iii].
Tomorrow;
watch for wave (c) to complete with a break of 107.62 at a minimum.
DOW JONES.
DOW 1hr.
DOW 4hr
DOW daily.
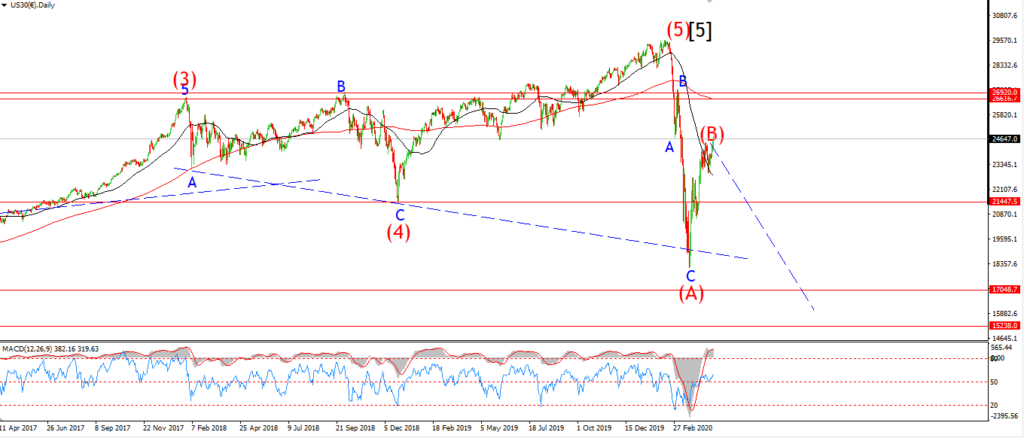
The mantra of late for the stock market has been that bad news is good news,
because the FED has got your back.
Then todays trade should have been an amazing run higher,
because the news was absolutely horrendous all round.
The world economy is falling onto its knees and drowning in insolvency.
But the market rally is sustainable and healthy and set to continue.
If the fed has got you,
why does momentum slow?
why do markets sell off at all?
why are some stocks bought and others just shunned?
Why not just keep buying everything you can get your hands on.
In fact you would be stupid not to just shut up, lever up, and buy!
I am not advocating this position by the way!
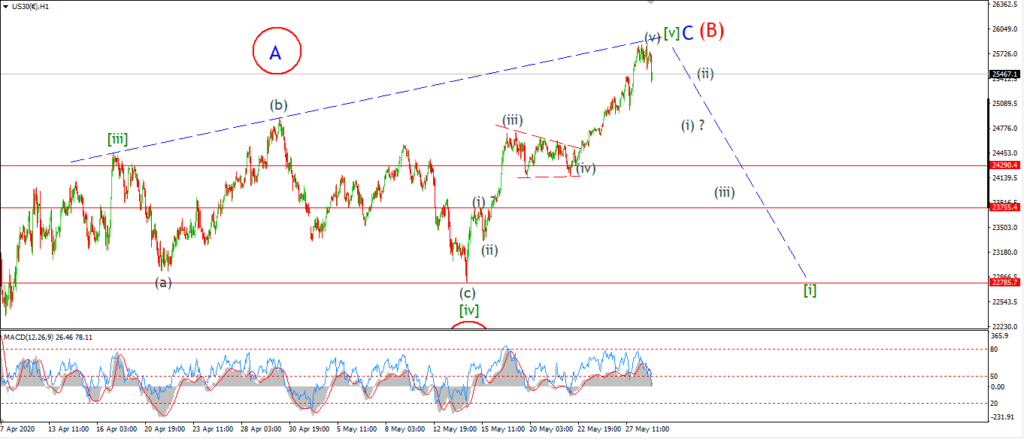
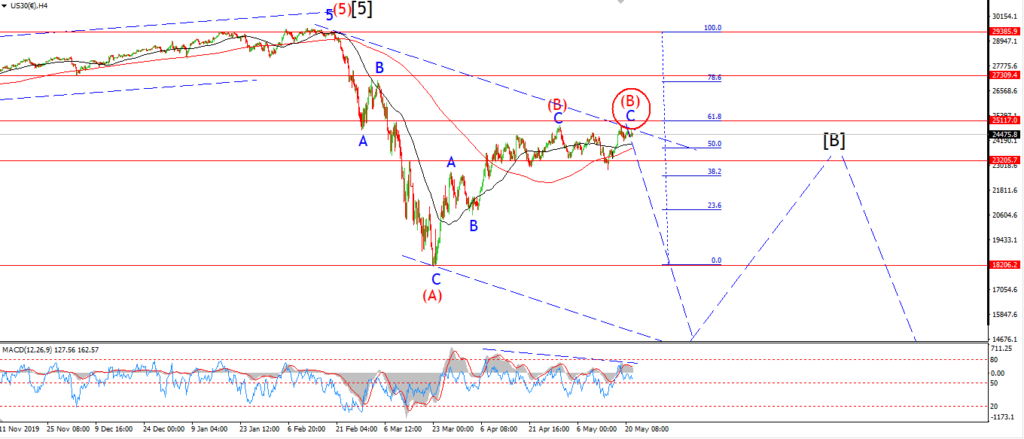
There is not a whole lot to add to the wave count today.
Wave [v] is proving an obstinate and relentless so and so,
much like my 3yr old!
4hr momentum is cresting at an extreme level again,
but we are still continuing the overall slowing pattern off the lows in March.
There was no major move today,
the market is slightly off the highs this evening
and I can only wait to see if this will develop into something more meaningful tomorrow.
Tomorrow;
Watching and waiting for a five wave decline.
GOLD
GOLD 1hr.
GOLD 4hr.
GOLD daily.
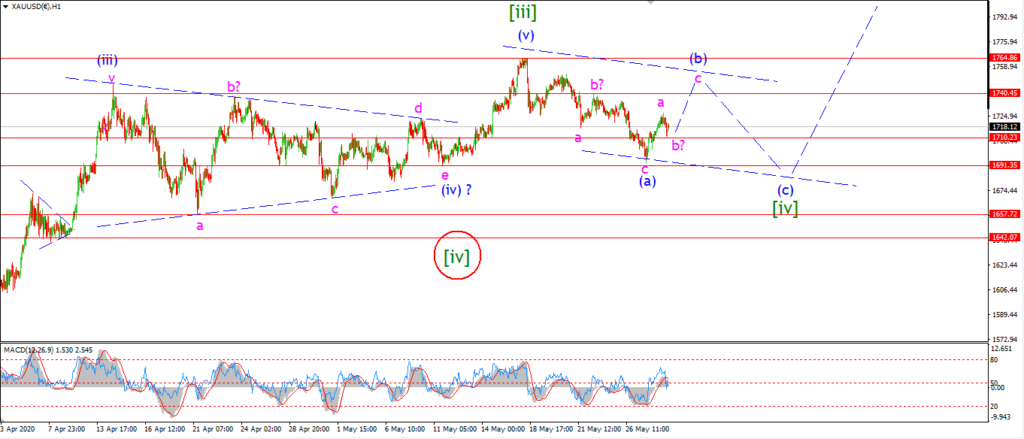
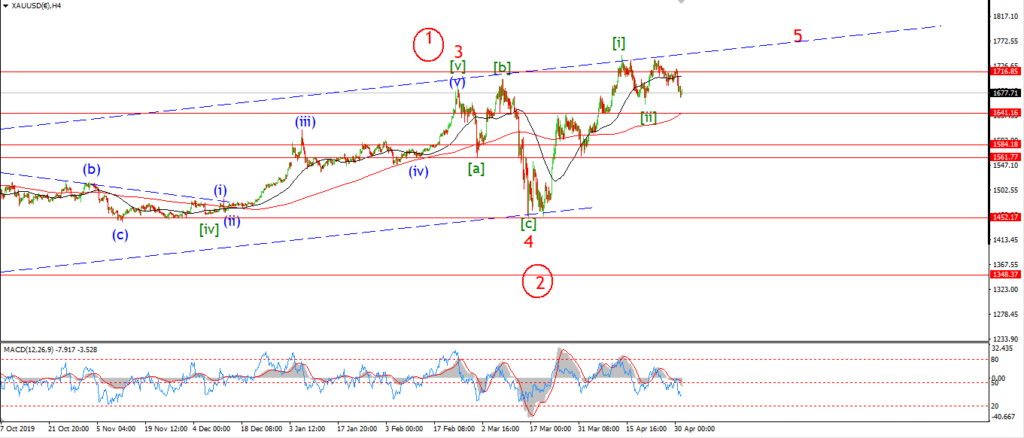
Gold is tracking with the new short term count quite well today.
The price rose in three waves into the high today,
I have labelled this wave ‘a’ of (b).
So far the price is correcting this evening in wave ‘b’.
This should create a small three wave pattern to a higher low
and 1710 looks like a reasonable target at the moment.
Wave ‘c’ of (b) has the potential to rally into 1740 again over the next few sessions.
If the pattern continues as I have suggested,
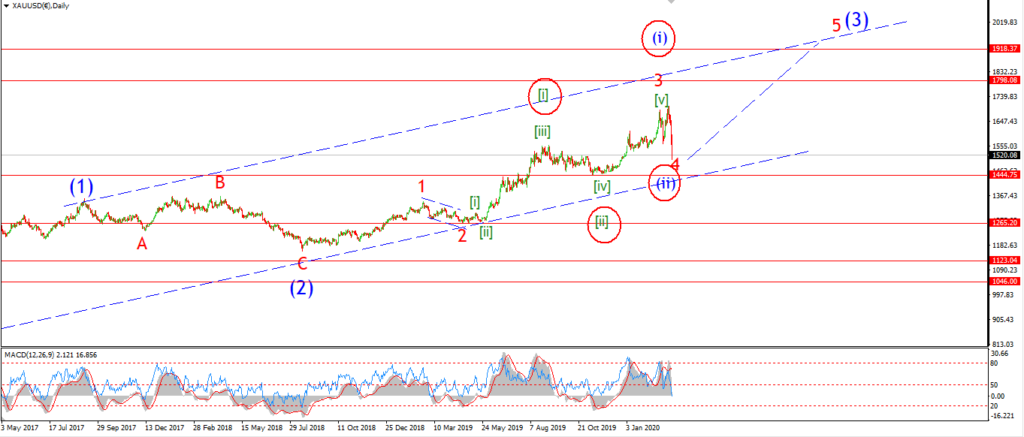
then we should be looking for another decline again later next week to complete wave [iv] green.
Tomorrow;
Watch for 1691 to hold as wave (b) develops.
Wave ‘c’ of (b) should get underway by the end of the day.
CRUDE OIL.
CRUDE OIL 1hr.
CRUDE OIL 4hr.
CRUDE OIL daily.
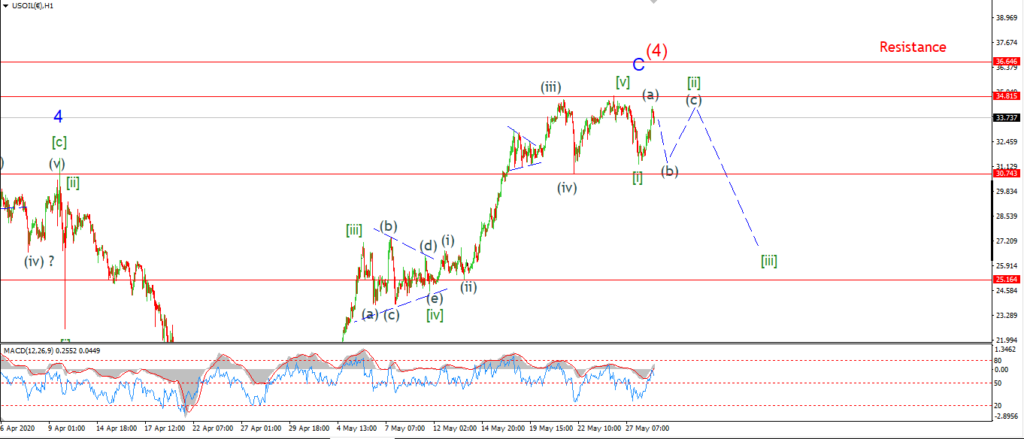
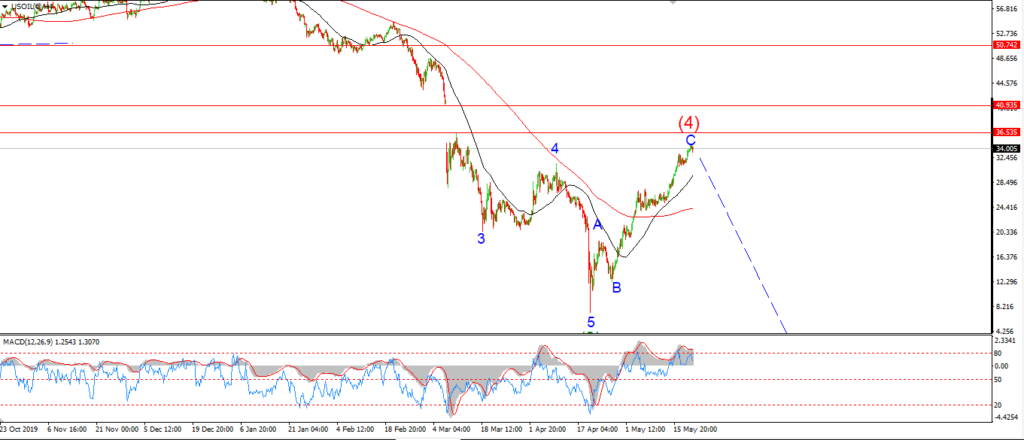
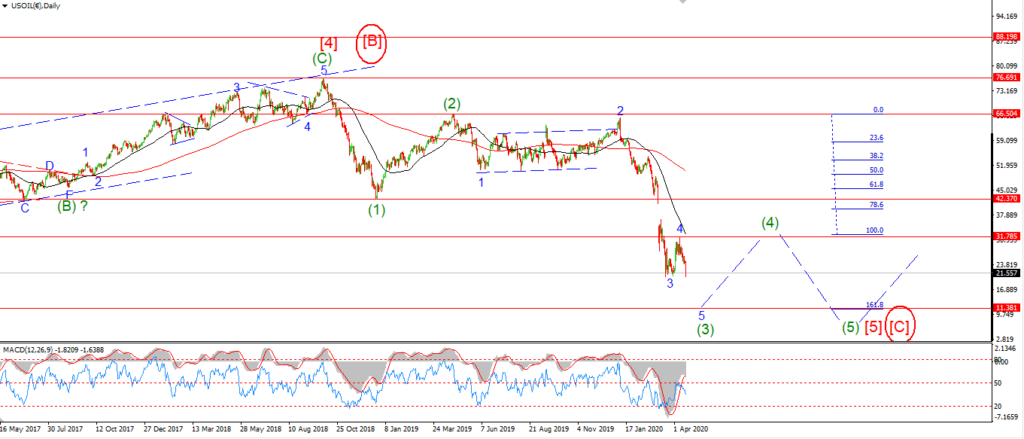
The pattern in crude is not clear cut at all yet.
The rally to a lower high today is not looking corrective to the upside.
Of course todays rally may only be wave (a) of a larger three wave pattern in wave [ii].
But that will require prices to hold below 34.81 from now on.
Wave [ii] can continue for a few more sessions in this scenario.
But we must see a big decline begin next week in wave [iii] down.
Tomorrow;
It is very early days in identifying the beginning of wave (5) down.
Watch for 34.81 to hold again.
Lets see if we can trace out a corrective lower high over the next few days.
S&P 500.
S&P 500 1hr
S&P 500 4hr
S&P 500 daily.
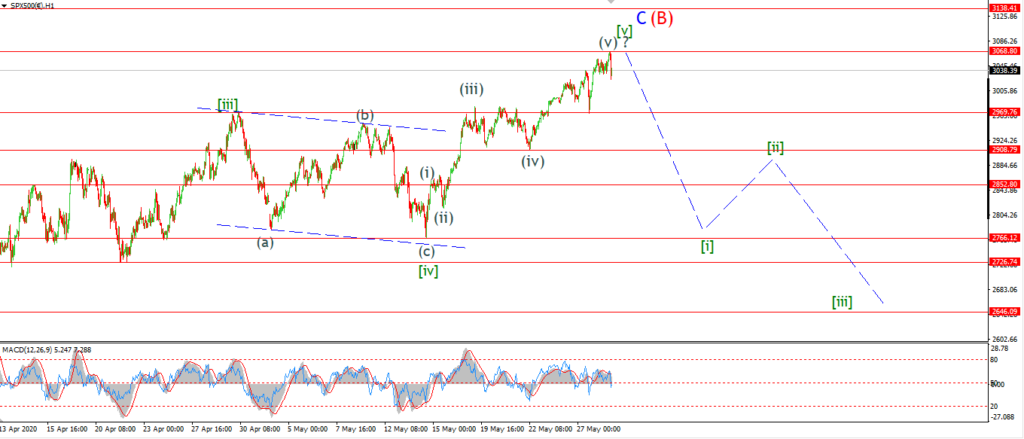
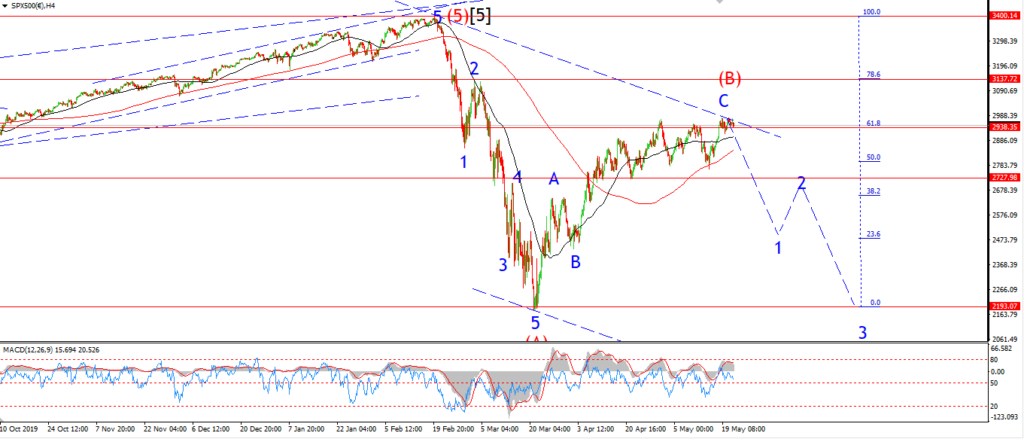
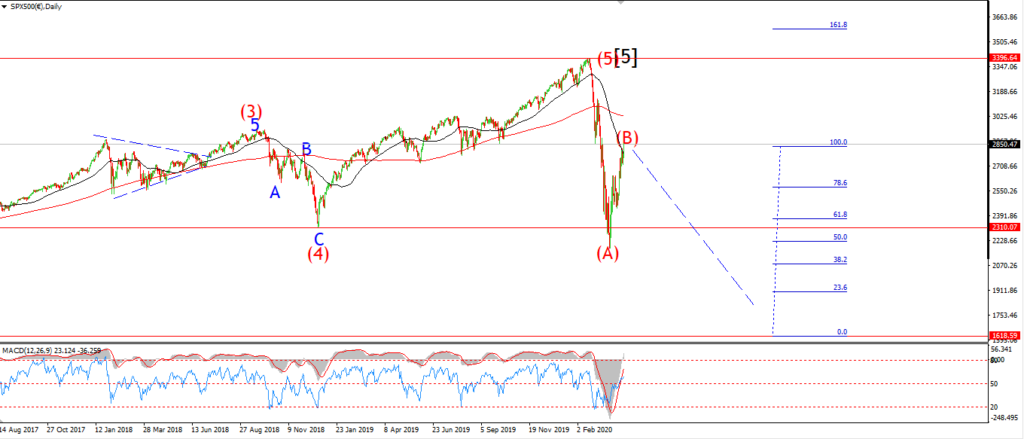
The S&P is dropping off the high today with a reasonably impulsive looking move.
This is of course nothing to pin our hopes to yet.
So I am just going to wait and see if we get any follow through tomorrow.
The price structure has built a few levels of oscillation over the last few weeks.
The first one below us lies at 2969.
This marks the high of wave [iii] and the interim low within the current wave (v).
The next level below that marks the previous wave (iv) low at 2908.
This level is more important in terms of building an impulsive move lower.
A break of that level will be the first step towards turning this juggernaut lower.
Below all these lies the most critical level in my view.
That is 2766 at the previous wave [iv].
If we slice down through this level in five waves,
that will begin wave (C) in my view.
Tomorrow;
It would be nice to see a selloff begin,
but I will just wait and see.
2969 is the first way point lower.
SILVER.
SILVER 1hr
SILVER 4hr.
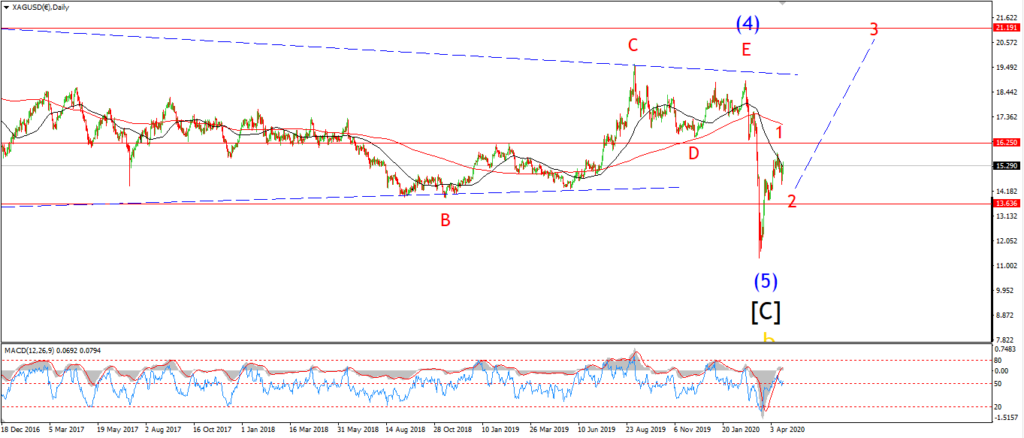
SILVER daily.
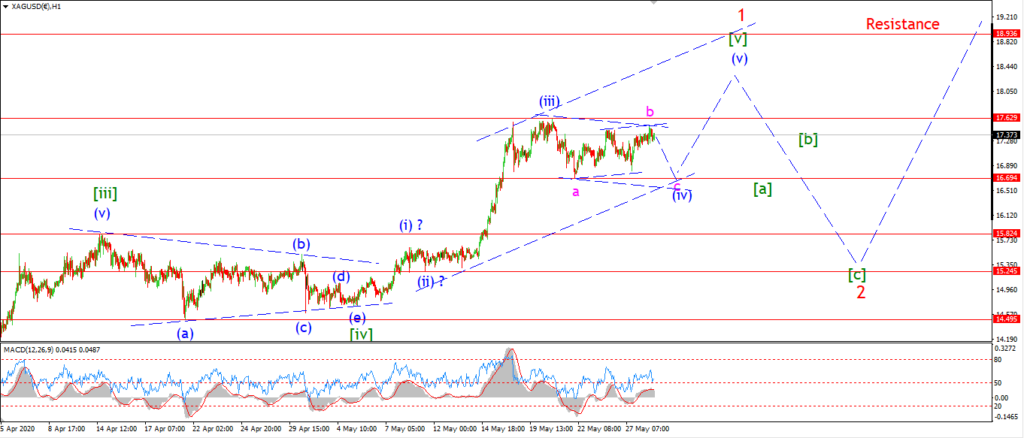
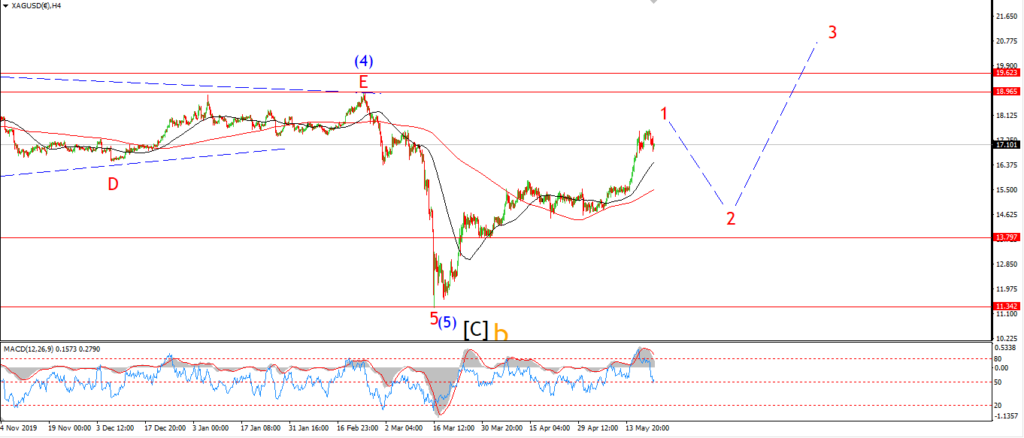
Silver broke out of the triangle scenario for wave (iv) today.
This does not mean wave (iv) is complete yet.
I still think the price action looks corrective to the upside in wave ‘b’ of (iv).
Where wave (iv) is tracing out a flat correction.
So I am allowing for wave ‘c’ of (iv) to fall back to the lower trend channel line again to complete.
the minimum target for wave ‘c’ is at 16.19.
This is where wave ‘c’ will break the low of wave ‘a’.
Tomorrow;
Watch for wave ‘c’ to turn lower again and fall towards the target in five waves.