
Good evening to one and all.
I’m going to do my little chart presentation again over the next few days.
I want to show you the things that catch my eye throughout the week.
Here is a chart that is more valuable than one might think at first glance.
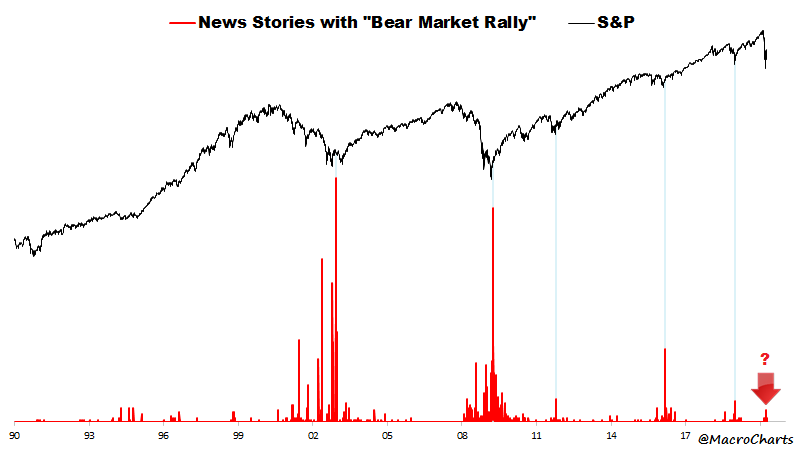
The further the market falls, and the longer the decline lasts, the more likely that we are to call any bounce just a ‘bear market rally’.
Therefore the largest amount of headlines with the term bearmarket rally in them usually come after the lows of the cycle.
And hence we discount the new rally off the lows as just a ‘bearmarket rally’, when in fact the bull market is just getting started.
Notice how there is very little talk of this current rally as a bearmarket rally, it is just a continuation of the bull market as far as most are concerned.
Another chart from John Hussman:
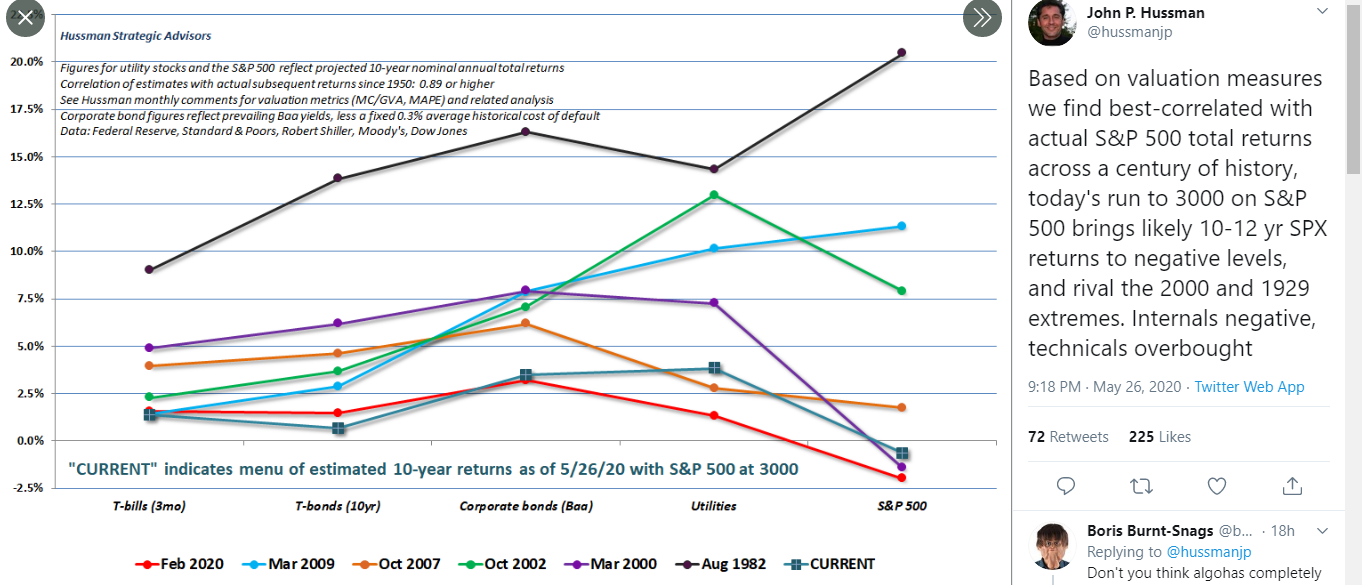
The current lower high in stocks is now up there with the February 2020 high, the March 2000 highs and the October 1929 highs in terms of extreme valuations in the market.
Does this rally continue, not according to this chart!
Presented without comment:
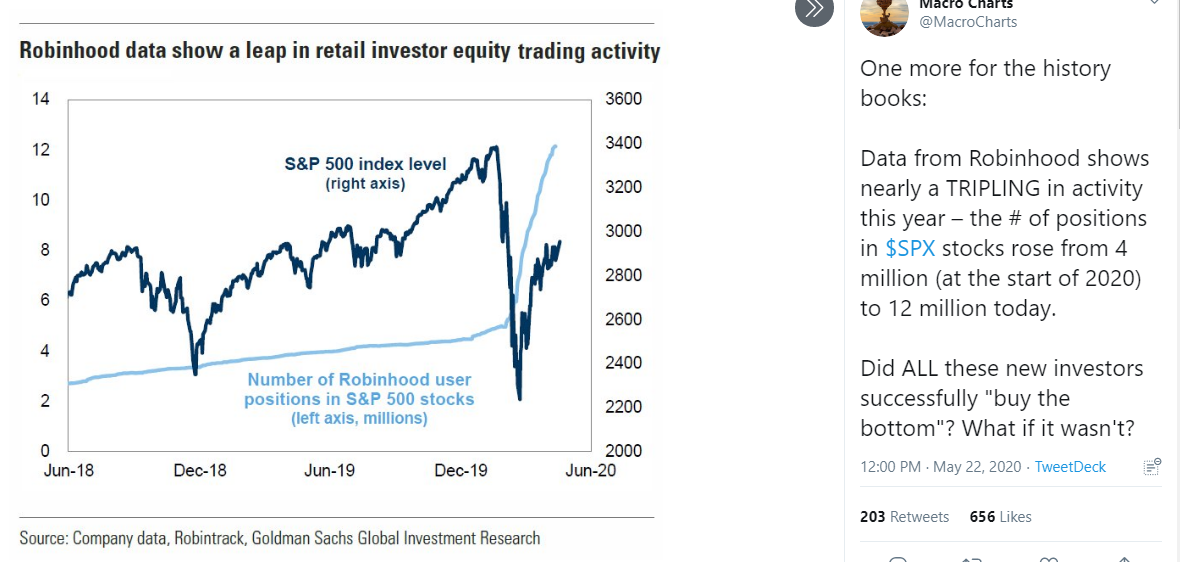
here we go.
EURUSD.
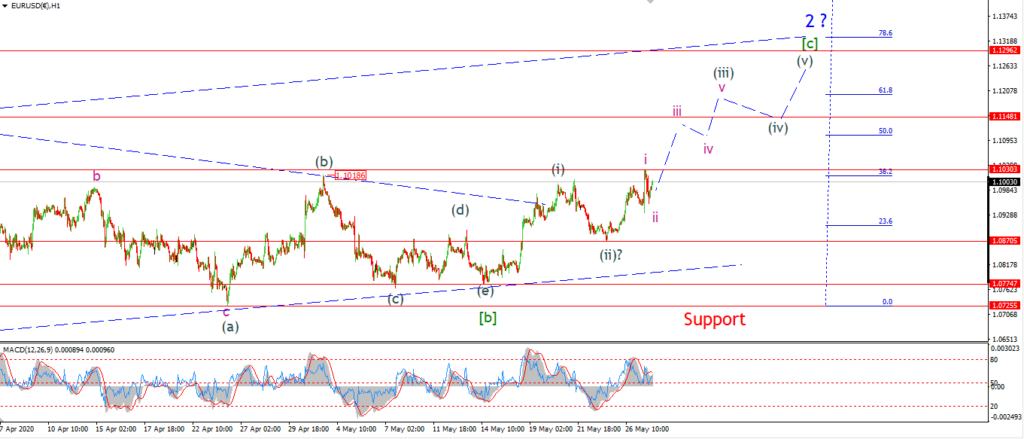
EURUSD 1hr.
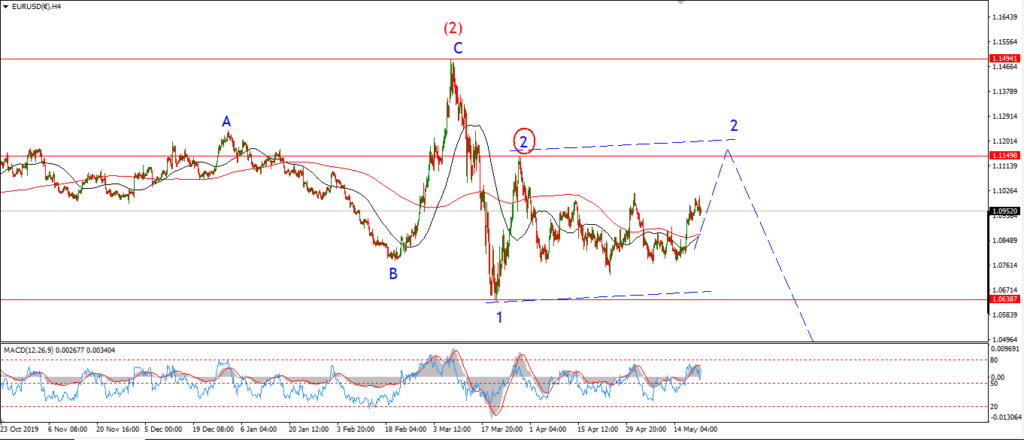
EURUSD 4hr.
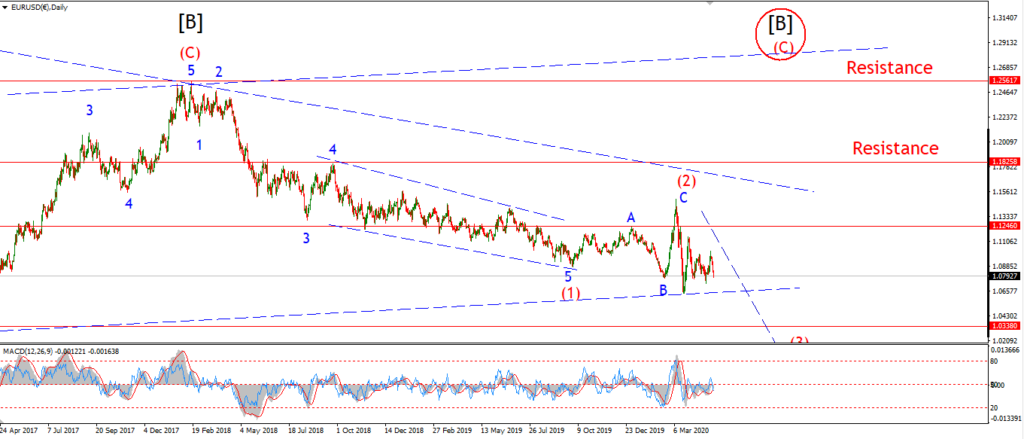
EURUSD daily.
The rally into todays high at 1.1030 is a five wave structure.
This does suggest the rally is only wave ‘i’ of (iii),
with a more sustained rally ahead in wave (iii) over the coming days.
It is not clear yet is wave ‘ii’ pink is done at the session low.
But,
if the price continues higher tomorrow and breaks above 1.1030 again,
I will view that rally as wave ‘iii’ of (iii) underway.
Tomorrow;
Watch for wave ‘ii’ of (iii) to complete and wave ‘iii’ of (iii) to continue higher towards 1.1150.
GBPUSD
GBPUSD 1hr.
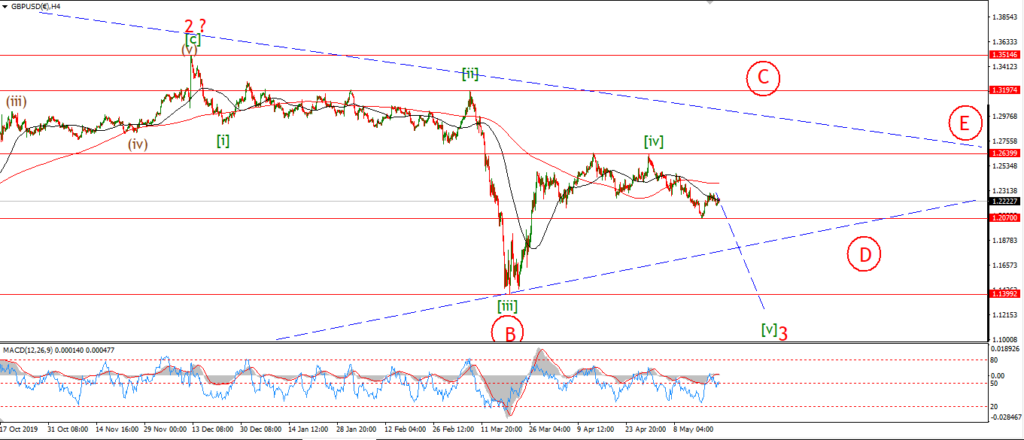
GBPUSD 4hr.
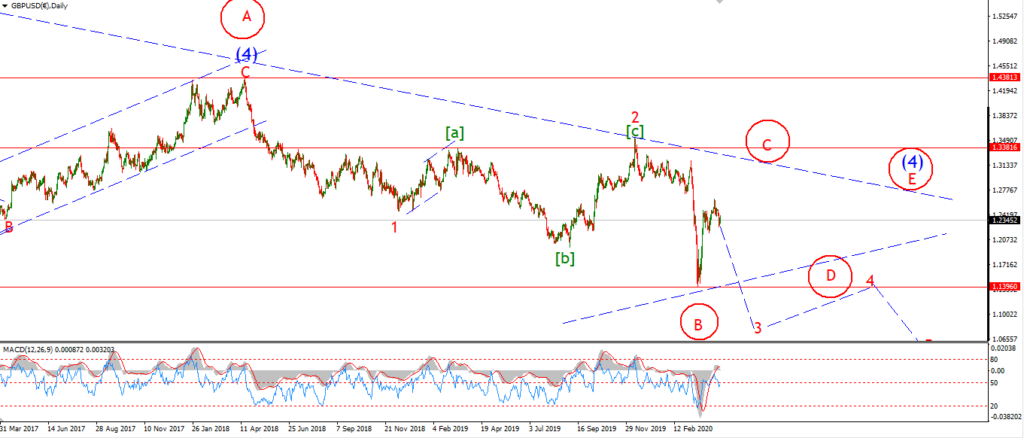
GBPUSD daily.
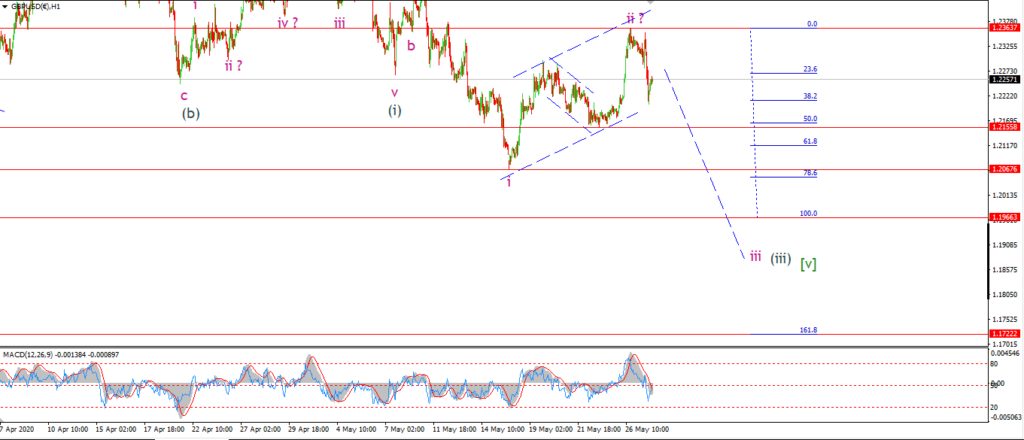
Well I thought we might see a further few sub-waves higher today to complete wave ‘ii’ pink,
but that was not to be.
The price fell quite impulsively this afternoon,
and I am now viewing this as the beginning of wave ‘iii’ of (iii) to the downside.
Tomorrow;
This decline must continue below 1.2155 again to confirm the decline into wave ‘iii’.
And I do not want to see a break above 1.2363 at the wave ‘ii’ high again.
That will favor the alternate count.
Watch for wave ‘iii’ of (iii) to continue lower and break 1.196 at a minimum.
Wave ‘iii’ will reach 162% of wave 1.1722.
USDJPY.
USDJPY 1hr.
USDJPY 1hr.
USDJPY daily.
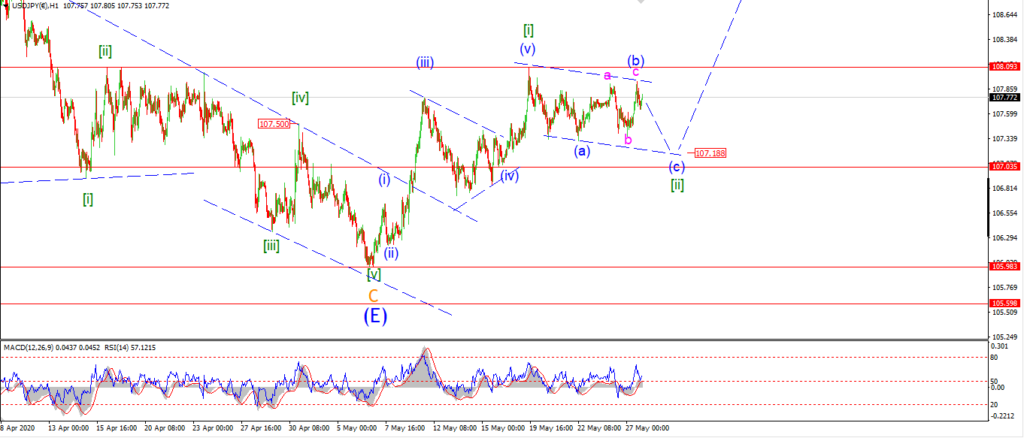
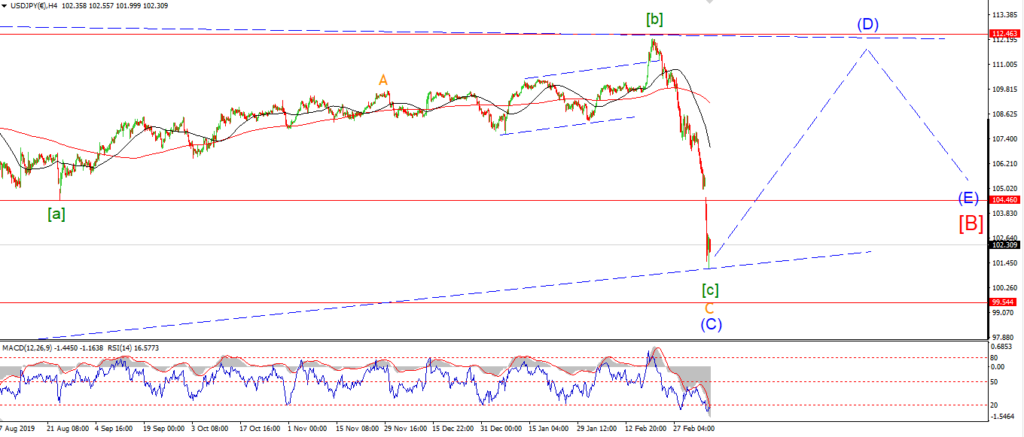
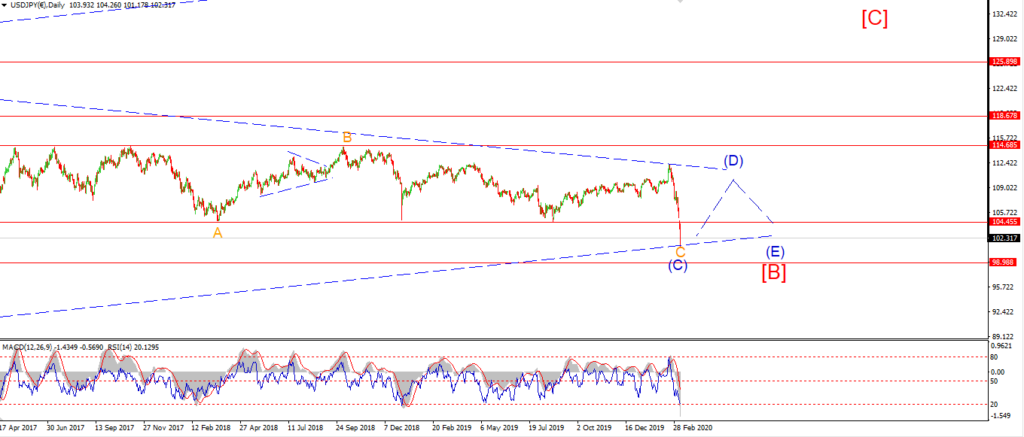
It looks like USDJPY is extending the pattern in wave [ii].
The price has completed a larger three wave sideways pattern in wave (b) of [ii] today.
The price only managed a very slight new high today,
before turning lower again.
A new decline this evening should be the start of wave (c) down.
And wave (c) should fall into the lower trend channel line at 107.18 again to complete the pattern.
Tomorrow;
Watch for wave [ii] to complete with one more drop in wave (c).
DOW JONES.
DOW 1hr.
DOW 4hr
DOW daily.
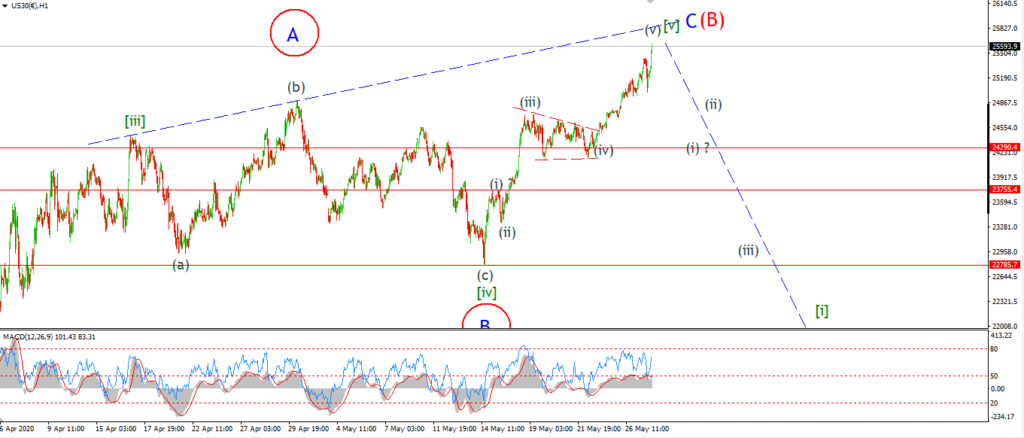
It seems every dip is met with reckless joy and abandon by the BTFD crowd!
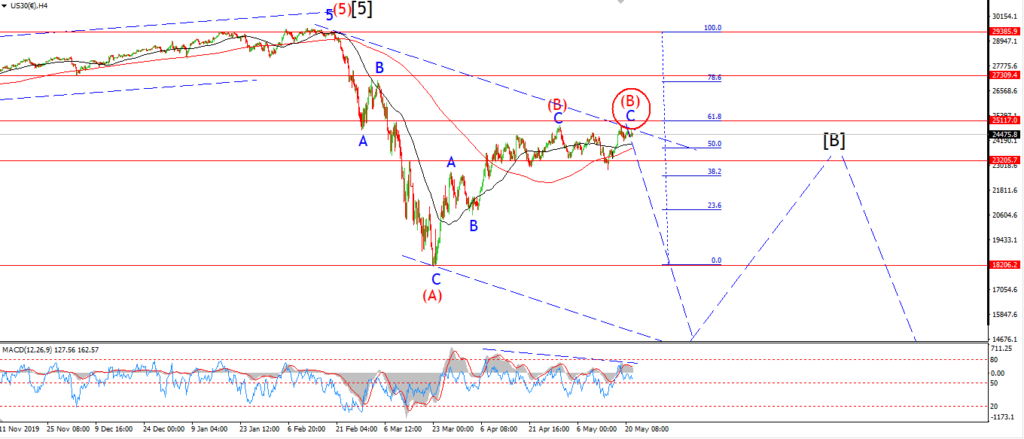
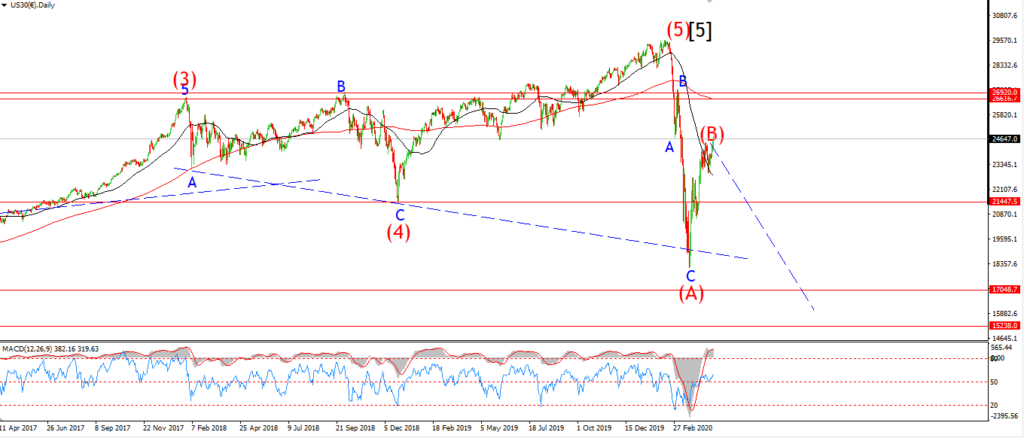
We are marching to an inevitable end point alright,
The series of fourth and fifth waves will complete the pattern.
But the market has not chosen not to do that just yet.
The price gaped higher today then traded lower and now pushed out to a new high for the session as we hit the close.
This choppy action creates a worsening momentum situation,
but only a sharp and unexpected decline will break the stupor created by an over-extended wave ‘C’.
And so I will have to wait for that to happen.
Tomorrow;
It would be great to see a meaningful turn lower develop this week.
The underlying weakness in the market is surely setup beautifully for a major collapse.
If we saw a drop below 24290 again,
I will consider that as wave (i) down.
GOLD
GOLD 1hr.
GOLD 4hr.
GOLD daily.
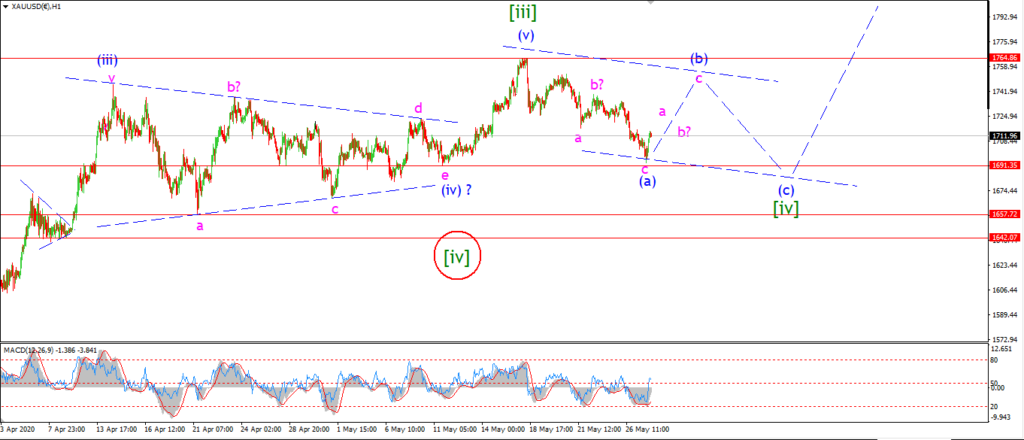
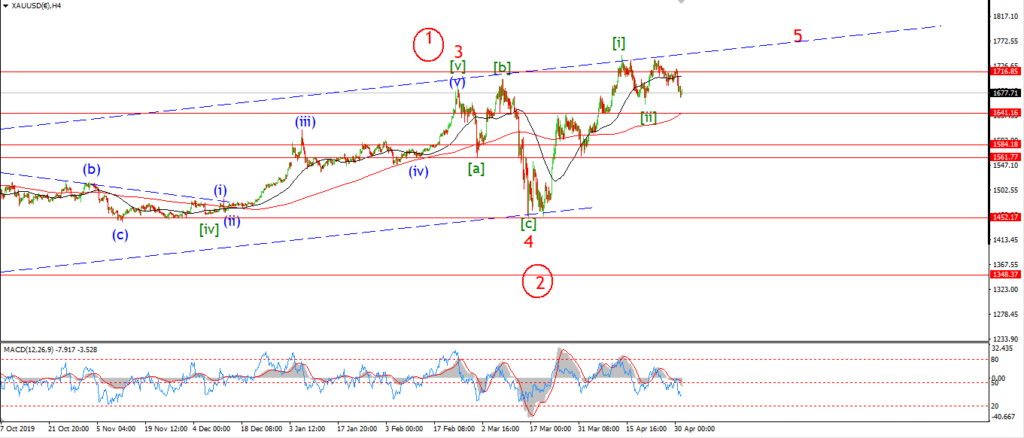
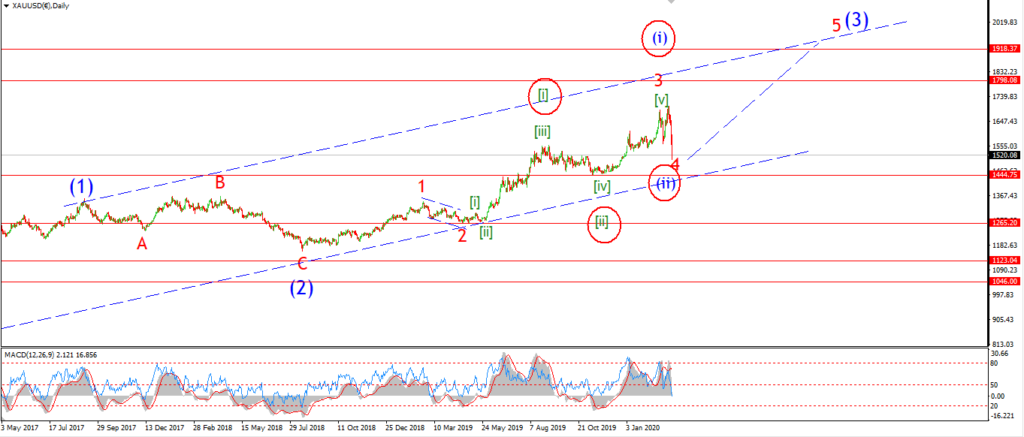
Gold hit a stumbling block today with a five wave decline into the lows of the session.
this action is enough to push me to reconsider the short term wave count.
I am now viewing the decline off 1764 as a three wave correction in wave (a) of [iv].
Wave [iv] should trace out a larger three wave pattern as shown,
and the rise off the session low this evening should begin wave (b).
The low has held above 1691 today,
so in theory, the previous wave count is still valid,
but I have a hunch that something different is developing here now.
Hense the changes.
Tomorrow;
Wave (b) should rally in three waves to create a lower high below 1764.
That will unfold over the next few days.
CRUDE OIL.
CRUDE OIL 1hr.
CRUDE OIL 4hr.
CRUDE OIL daily.
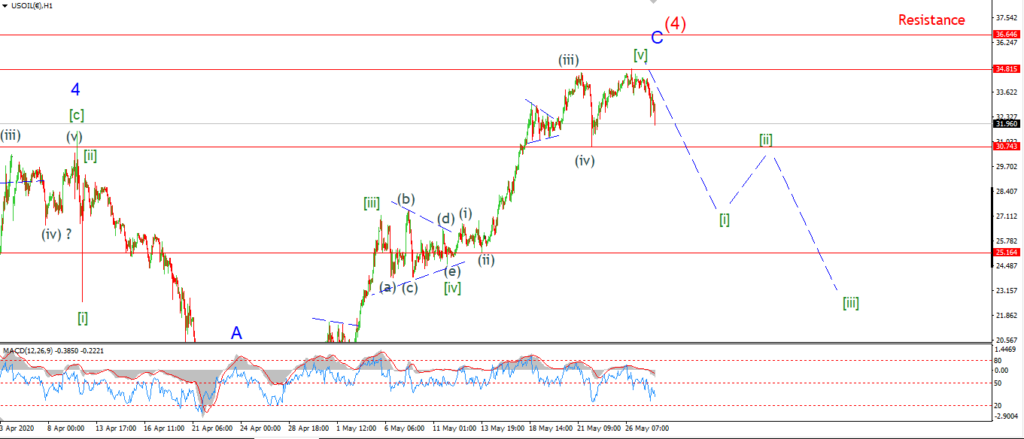
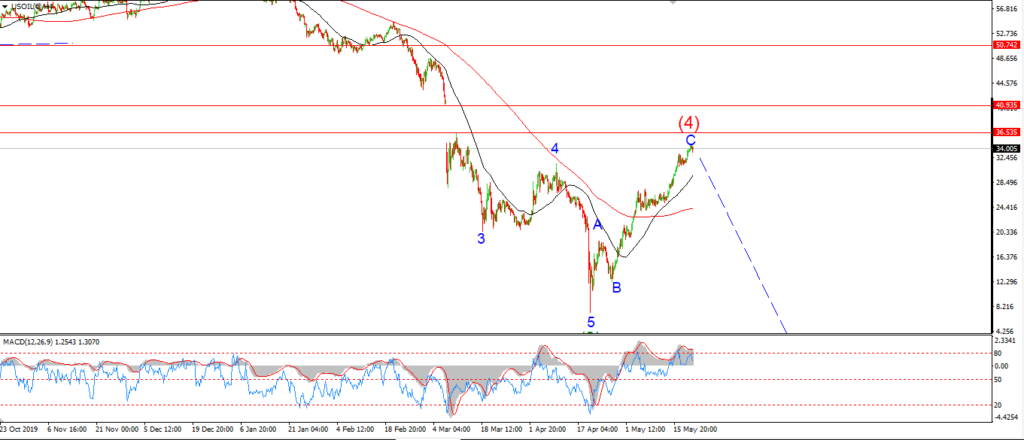
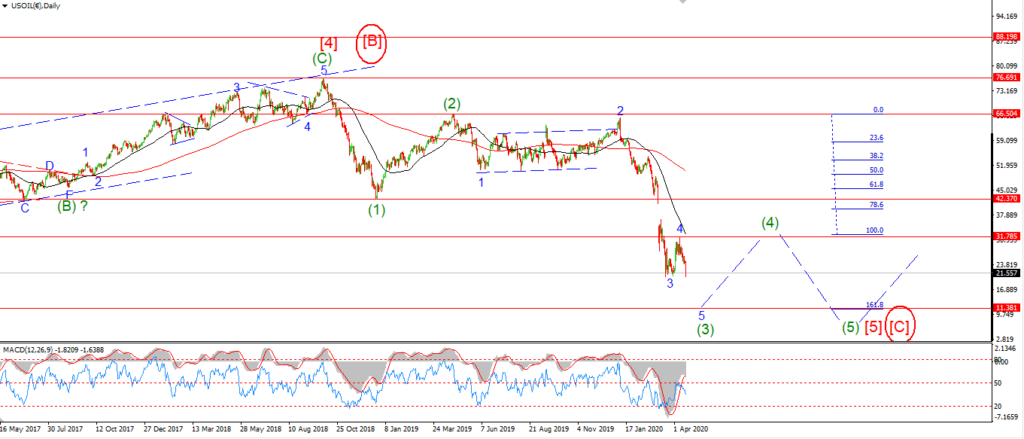
A new high this week and another decline to work with also.
The pattern off the high is promising,
but it is not clearly in five waves just yet.
So I will reserve judgement and allow it to develop a little further.
We should be expecting a standard five wave decline in wave (i) now.
A break below that $30 level again will be a warning signal to the bulls out there.
I think that will be enough to call the top in for wave (4) and then we can work on a lower high to develop in waves [i] and [ii] over the coming week.
Tomorrow;
Watch for a continued decline in five waves to develop be fore Friday.
30.00 is a key level in my mind as it marks a swing high at wave ‘4’ blue and a smaller swing low from last week in wave (iv).
Five waves down to cut through wave (iv) is what I am looking for.
S&P 500.
S&P 500 1hr
S&P 500 4hr
S&P 500 daily.
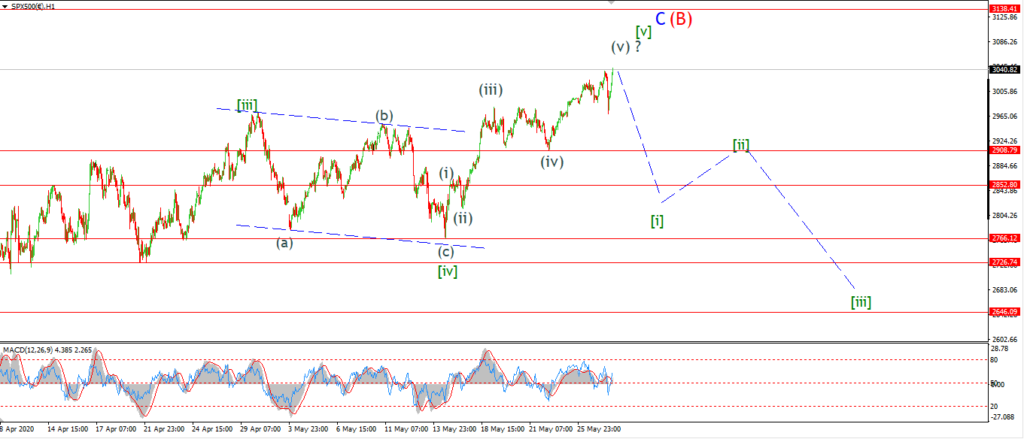
The S&P is closing above 3000 for the the first time since the March 5th.
The action today was pretty erratic to say the least.
Most of the gains were made at the open and then at the last 30 mins of trading.
The whole central portion of the trade made zero net gains.
this market is definitely super optimistic about the future right now,
seen as the market is 1.4% higher against a backdrop of horrible economic data,
and even worse technical data pointing to a very weak underpinning to this rally.
Bull markets do not start on etreme optimism and terrible market dynamics.
This is the picture of an end to a rally,
not the beginning!
Tomorrow;
But I do repeat myself today!
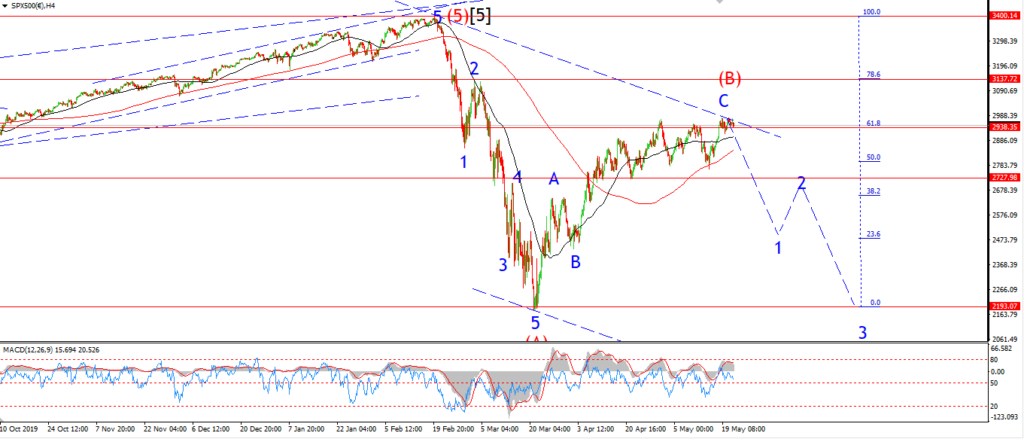
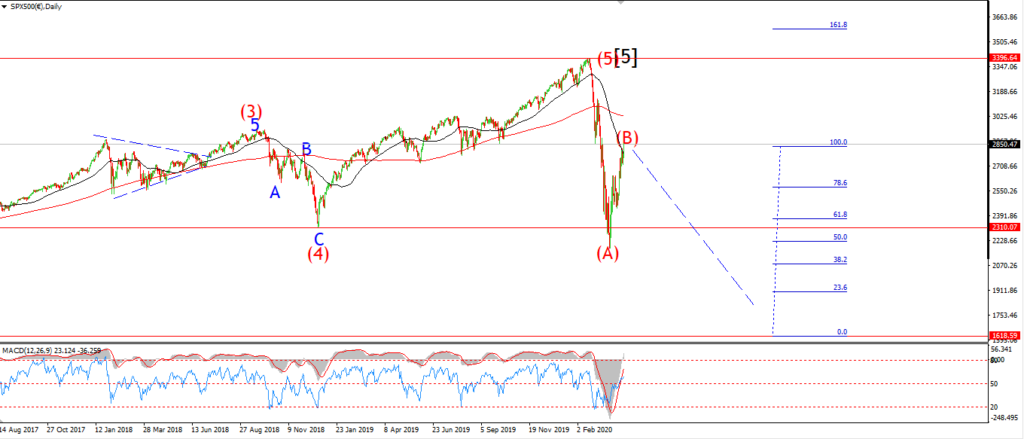
I am looking for a meaningful decline to start a new trend lower in wave (C).
The market is not giving me anything to work with yet.
But the trap door is open under this rally now,
And we are going in soon.
SILVER.
SILVER 1hr
SILVER 4hr.
SILVER daily.
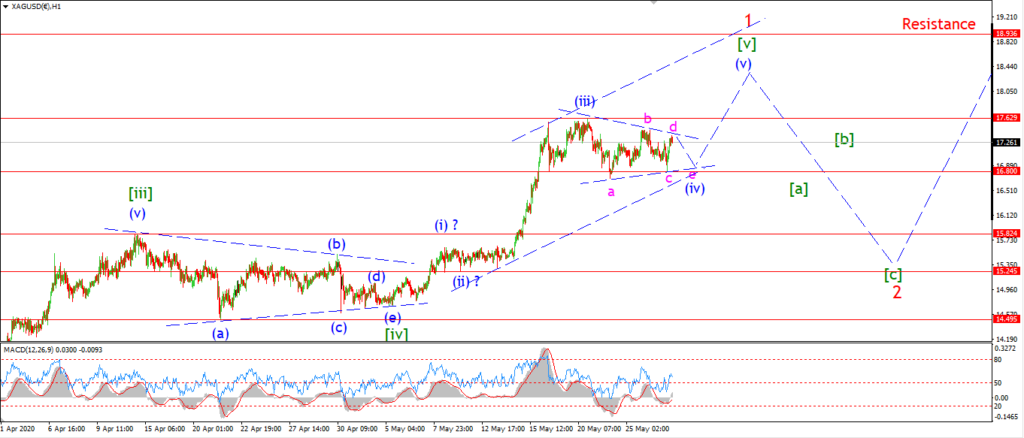
Silver is moving in a tighter range today,
which opens up the possibility that wave (iv) is tracing out a triangle.
The internal pattern is not complete yet though,
we need to see another drop to complete above 16.80 in wave ‘e’ tomorrow.
that will complete wave (iv) blue,
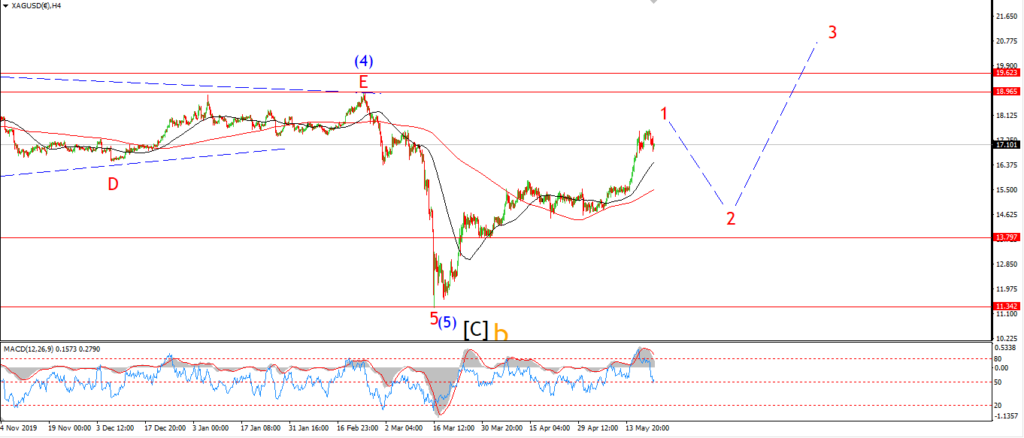
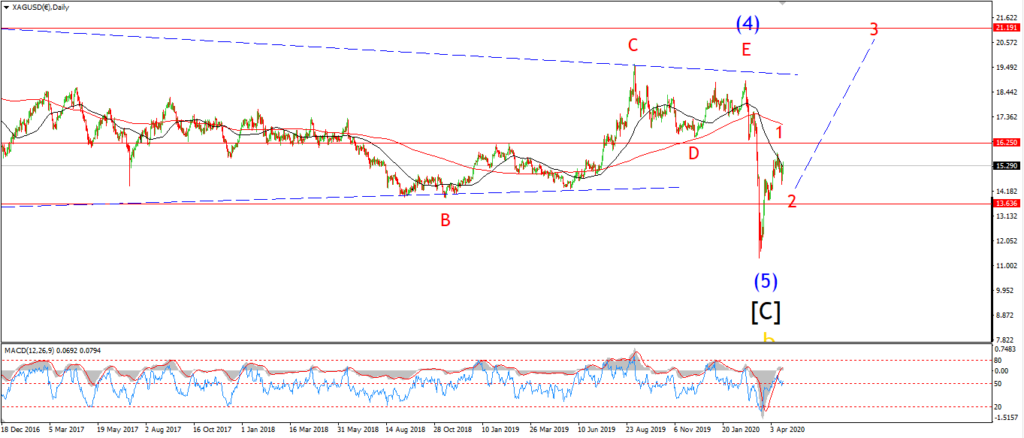
and then we should see another rally again in wave (v) blue to complete the larger wave [v] and ‘1’ sometime next week.
There is a small chance that wave (iv) completed at the session low today in complex flat,
in that case we will see a rally above 17.62 tomorrow to begin wave (v).
Tomorrow;
Watch for wave ‘e’ of (iv) to complete above 16.80,
we should then be set for a rally into wave (v) of [v].