
[vc_row][vc_column][vc_separator border_width=”5″][/vc_column][/vc_row]
[vc_row][vc_column][vc_column_text]
Good evening folks,
It’s Friday again and the video is posted as usual.
Firstly some housekeeping.
Monday is a national holiday in the U.S and the market’s are closed,
so there will not be an update on Monday night.
I will be back again on Tuesday evening after the close as usual.
To all my Stateside friends,
Have a great Memorial day weekend.
Ok, down to it.
[/vc_column_text][/vc_column][/vc_row]
[vc_row][vc_column][vc_separator border_width=”5″][/vc_column][/vc_row]
[vc_row][vc_column][vc_column_text]
EURUSD
[/vc_column_text][/vc_column][/vc_row]
[vc_row][vc_column][vc_separator border_width=”5″][/vc_column][/vc_row][vc_row][vc_column width=”2/3″][vc_custom_heading text=”1 hr” use_theme_fonts=”yes”][vc_column_text]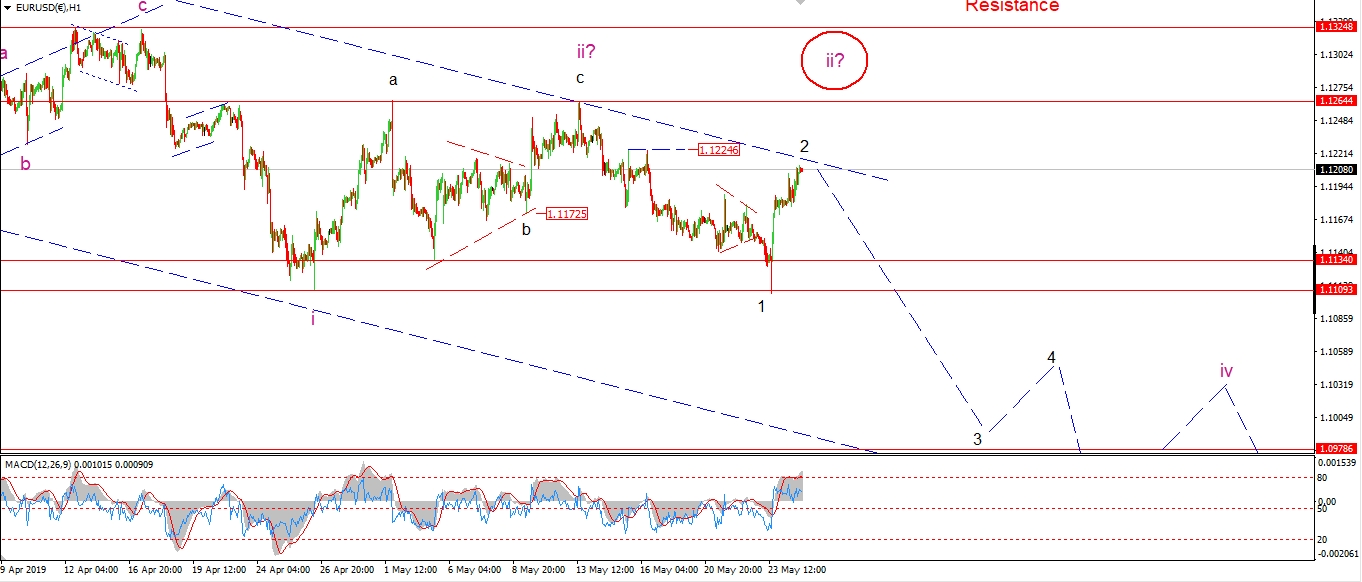 [/vc_column_text][/vc_column][vc_column width=”1/3″][vc_custom_heading text=”4 Hours” use_theme_fonts=”yes”][vc_column_text]
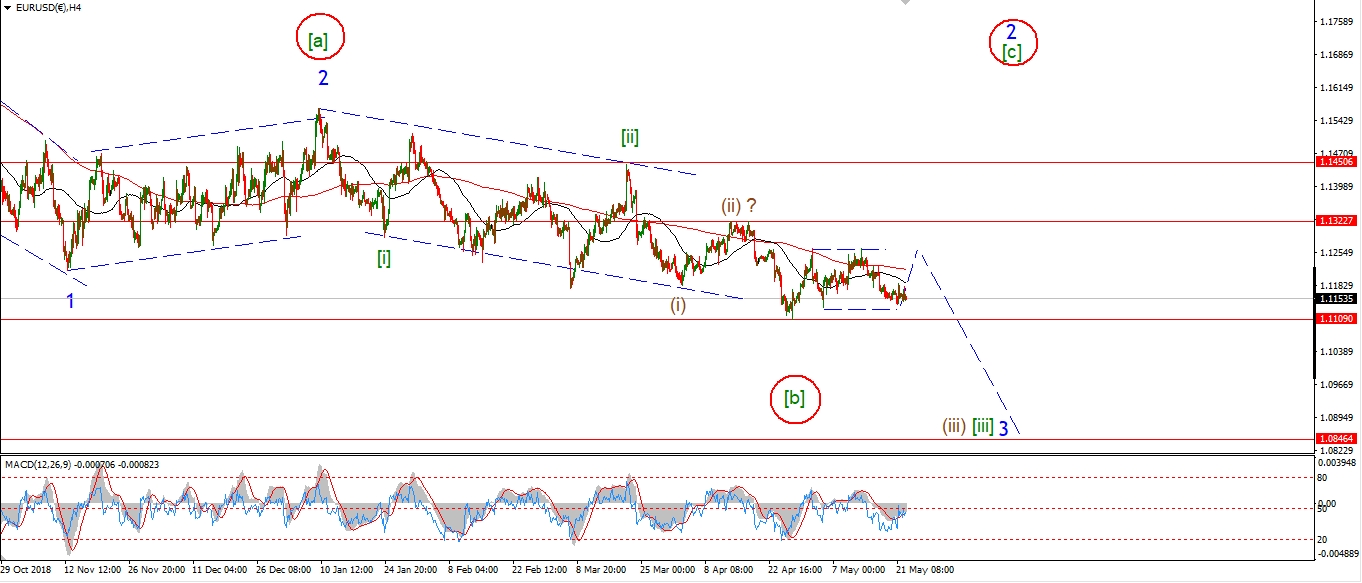 [/vc_column_text][vc_custom_heading text=”Daily” use_theme_fonts=”yes”][vc_column_text]
 [/vc_column_text][/vc_column][/vc_row]
[vc_row][vc_column][vc_column_text]
EURUSD has now risen back into the upper trend channel line again.
I have labelled this as wave ‘2’ of ‘iii’.
But it is now equally likely that this is wave ‘c’ of ‘ii’,
as per the alternate count.
I still expect a larger decline in wave ‘iii’ over the next week.
Next week;
1.1224 should act a resistance to wave ‘2’ in the early trade.
A break of 1.1100 again will confirm wave ‘iii’ down.
But if we see a break of 1.1264 that will trigger the alternate wave ‘ii’ count.
Both counts should lead to a decline in wave ‘iii’.
[/vc_column_text][/vc_column][/vc_row]
[vc_row][vc_column][vc_separator border_width=”5″][/vc_column][/vc_row][vc_row][vc_column][vc_column_text]
GBPUSD
[/vc_column_text][/vc_column][/vc_row][vc_row][vc_column][vc_separator border_width=”5″][/vc_column][/vc_row][vc_row][vc_column width=”2/3″][vc_custom_heading text=”1 hr” use_theme_fonts=”yes”][vc_column_text]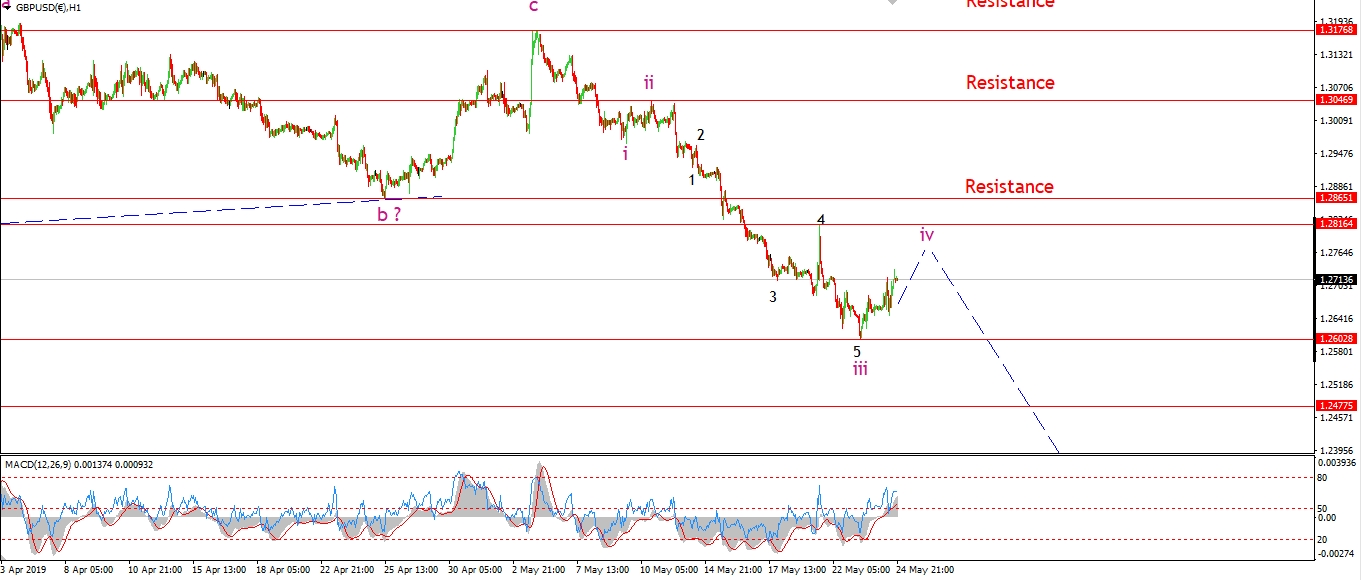 [/vc_column_text][/vc_column][vc_column width=”1/3″][vc_custom_heading text=”4 Hours” use_theme_fonts=”yes”][vc_column_text]
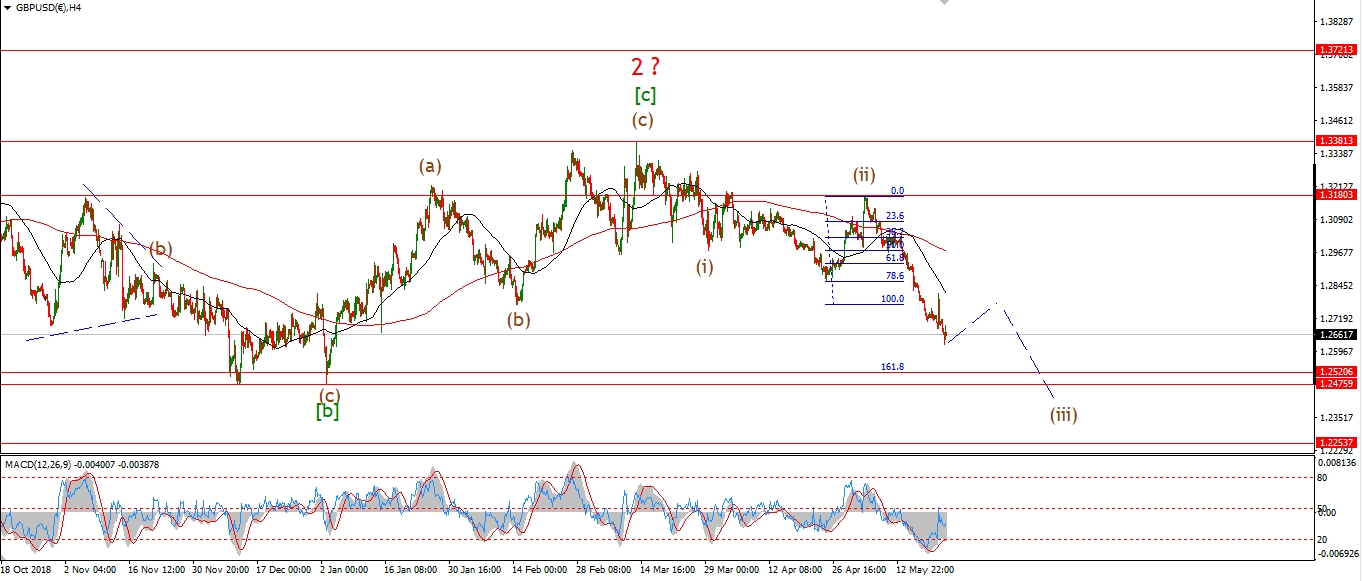 [/vc_column_text][vc_custom_heading text=”Daily” use_theme_fonts=”yes”][vc_column_text]
 [/vc_column_text][/vc_column][/vc_row]
[vc_row][vc_column][vc_column_text]
Cable is rallying in wave ‘iv’ today and so far the action looks quite corrective.
The price has risen in three waves into todays highs.
So this is either wave ‘a’ of a triangle,
or wave ‘a’ of a flat correction.
This correction should complete at or below 1.2816 as shown.
And then turn lower again into wave ‘v’ of (iii).
So we will just have to wait and see how the trade begins next week to narrow down the options for wave ‘iv’.
Next week;
Watch for wave ‘iv’ to continue and complete below resistance next week.
[/vc_column_text][/vc_column][/vc_row]
[vc_row][vc_column][vc_separator border_width=”5″][/vc_column][/vc_row][vc_row][vc_column][vc_column_text]
USDJPY
[/vc_column_text][/vc_column][/vc_row][vc_row][vc_column][vc_separator border_width=”5″][/vc_column][/vc_row][vc_row][vc_column width=”2/3″][vc_custom_heading text=”1 hr” use_theme_fonts=”yes”][vc_column_text]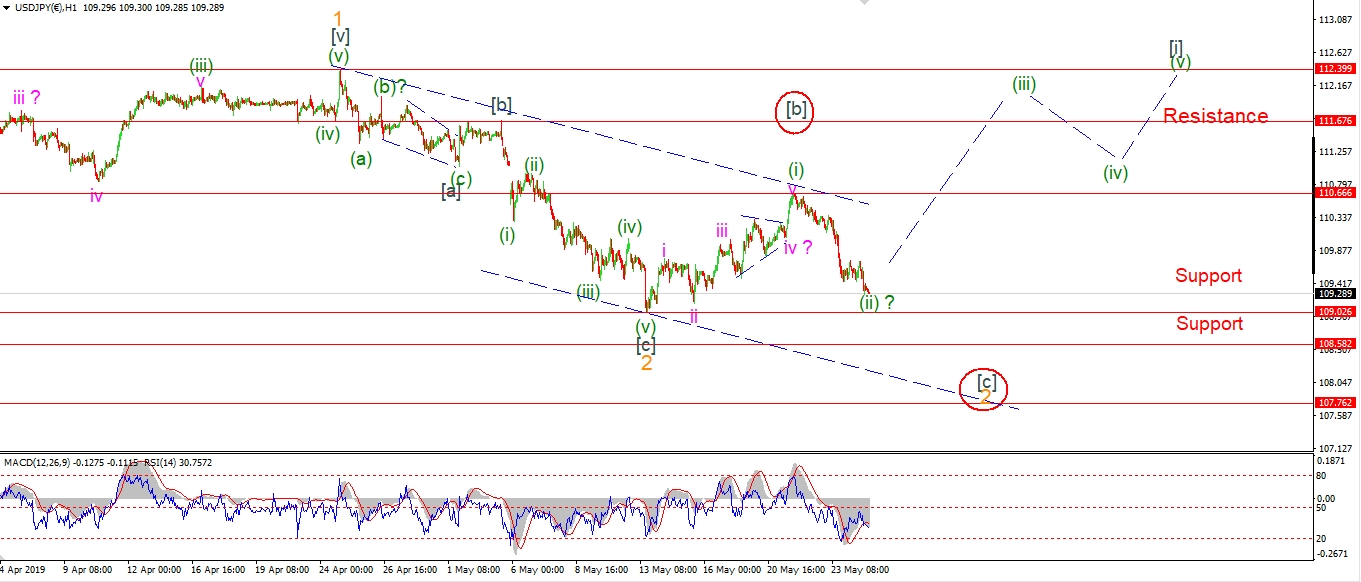 [/vc_column_text][/vc_column][vc_column width=”1/3″][vc_custom_heading text=”4 Hours” use_theme_fonts=”yes”][vc_column_text]
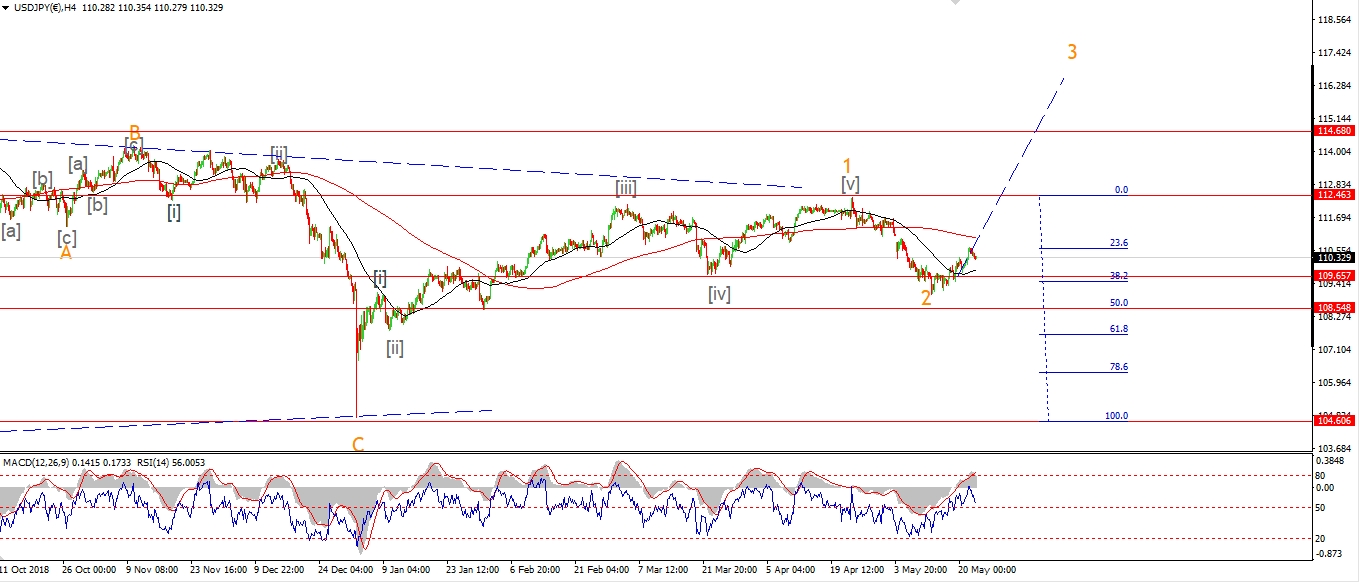 [/vc_column_text][vc_custom_heading text=”Daily” use_theme_fonts=”yes”][vc_column_text]
 [/vc_column_text][/vc_column][/vc_row]
[vc_row][vc_column][vc_column_text]
We are getting very close to invalidating the short term bullish count in USDJPY,
after the price continued to fall again today.
The invalidation line lies at 109.02,
If that level breaks,
that will trigger the alternate count which shows a larger wave ‘2’ underway.
This alternate wave ‘2’ scenario will allow for a decline into 107.70 before turning higher into wave ‘3’ again.
Next week;
Watch for wave (ii) to hold above 109.02
and wave (iii) to push back above 110.66 again.
[/vc_column_text][/vc_column][/vc_row]
[vc_row][vc_column][vc_separator border_width=”5″][/vc_column][/vc_row][vc_row][vc_column][vc_column_text]
DOW JONES INDUSTRIALS
[/vc_column_text][/vc_column][/vc_row][vc_row][vc_column][vc_separator border_width=”5″][/vc_column][/vc_row][vc_row][vc_column width=”2/3″][vc_custom_heading text=”1 hr” use_theme_fonts=”yes”][vc_column_text]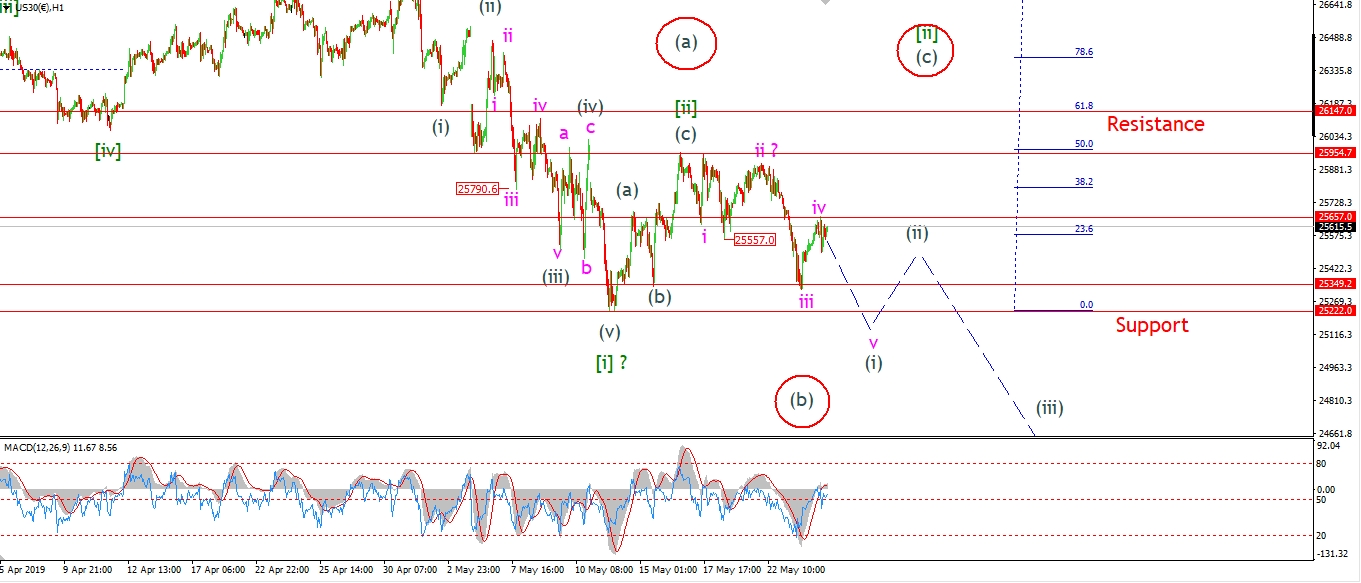 [/vc_column_text][/vc_column][vc_column width=”1/3″][vc_custom_heading text=”4 Hours” use_theme_fonts=”yes”][vc_column_text]
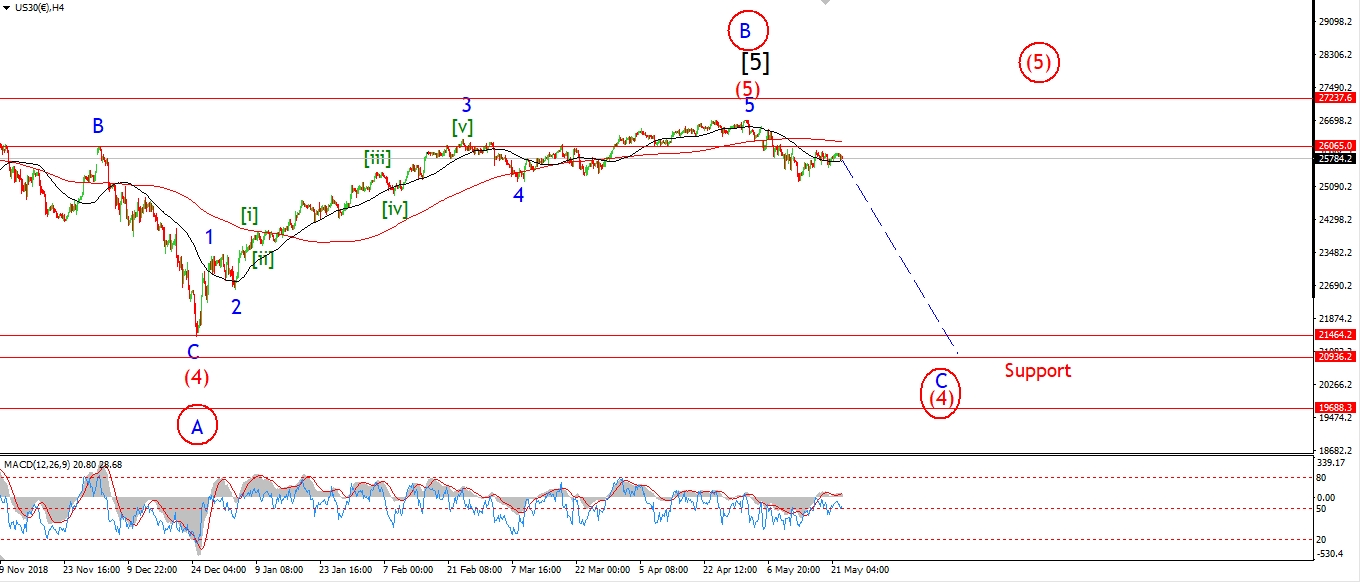 [/vc_column_text][vc_custom_heading text=”Daily” use_theme_fonts=”yes”][vc_column_text]
 [/vc_column_text][/vc_column][/vc_row]
[vc_row][vc_column][vc_column_text]
The DOW has rallied in wave ‘iv’ today and reached right back towards the wave ‘i’ low at 25657.
So far that level has held,
But if we do see a rally above 25657,
that will trigger the alternate wave [ii] scenario as shown circled in red.
If the market pushes back below the 25349 level on Tuesday,
that should be enough to confirm the current wave (i) count as shown.
Either way you look at it,
This market is in a very precarious position now,
and we have the potential to fall in a big way over the coming weeks.
Next week;
Watch for 25657 to hold and wave ‘v’ of (i) to turn lower again on Tuesday.
[/vc_column_text][/vc_column][/vc_row]
[vc_row][vc_column][vc_separator border_width=”5″][/vc_column][/vc_row][vc_row][vc_column][vc_column_text]
GOLD
[/vc_column_text][/vc_column][/vc_row][vc_row][vc_column][vc_separator border_width=”5″][/vc_column][/vc_row][vc_row][vc_column width=”2/3″][vc_custom_heading text=”1 hr” use_theme_fonts=”yes”][vc_column_text]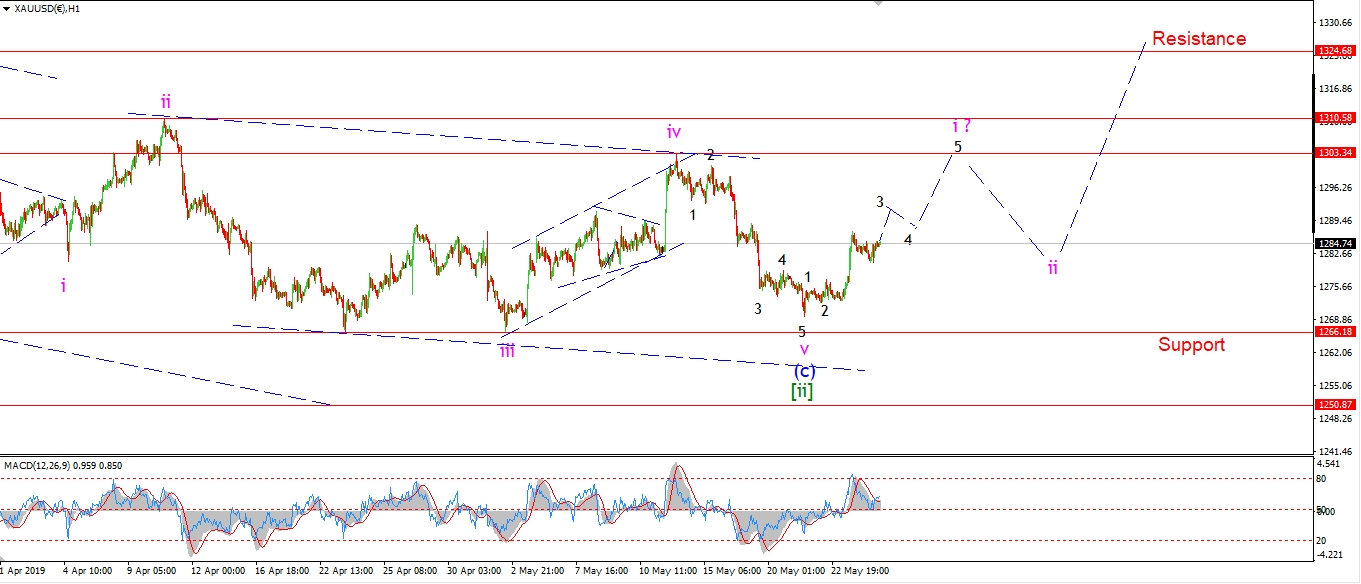 [/vc_column_text][/vc_column][vc_column width=”1/3″][vc_custom_heading text=”4 Hours” use_theme_fonts=”yes”][vc_column_text]
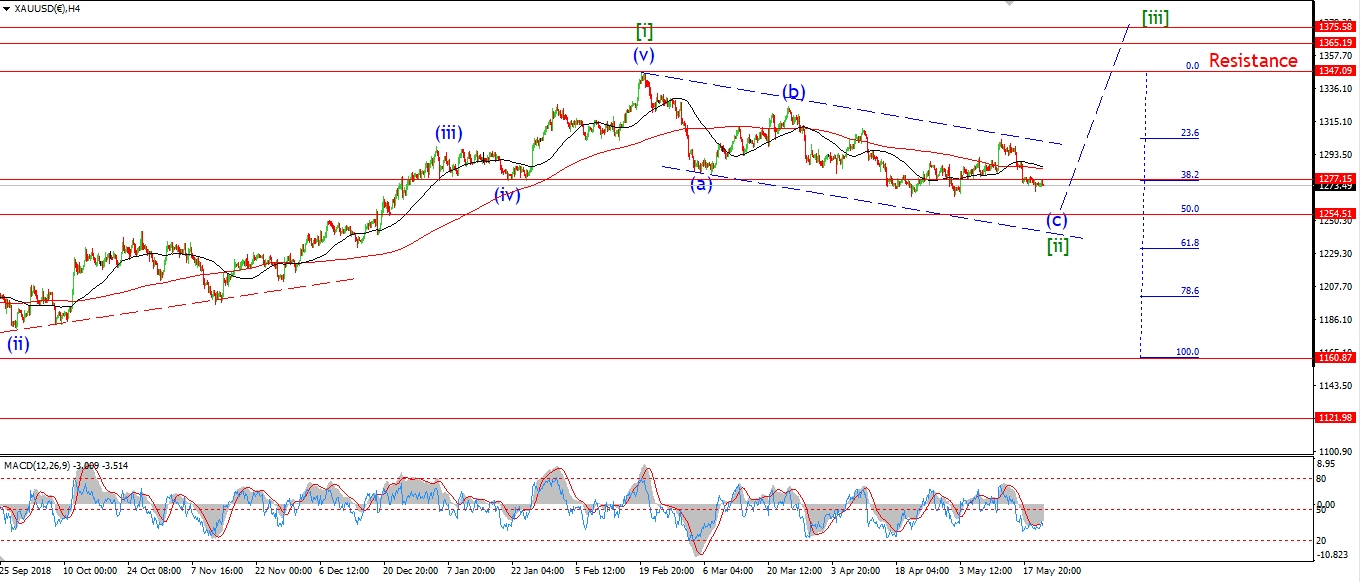 [/vc_column_text][vc_custom_heading text=”Daily” use_theme_fonts=”yes”][vc_column_text]
 [/vc_column_text][/vc_column][/vc_row]
[vc_row][vc_column][vc_column_text]
Gold corrected in three waves off the Thursday highs today.
This suggests a minor correction is in play within wave ‘i’.
and the price should continue higher again next week.
The real crunch area lies at 1300 again.
If we see a break of that key level after a five wave rally higher,
that will signal the market has turned up again.
And then we should be presented with a bullish opportunity after a correction in wave ‘ii’.
Next week;
Watch for wave ‘i’ to continue higher and break 1300 again by the end of next week.
[/vc_column_text][/vc_column][/vc_row]
[vc_row][vc_column][vc_separator border_width=”5″][/vc_column][/vc_row][vc_row][vc_column][vc_column_text]
U.S CRUDE OIL
[/vc_column_text][/vc_column][/vc_row][vc_row][vc_column][vc_separator border_width=”5″][/vc_column][/vc_row][vc_row][vc_column width=”2/3″][vc_custom_heading text=”1 hr” use_theme_fonts=”yes”][vc_column_text]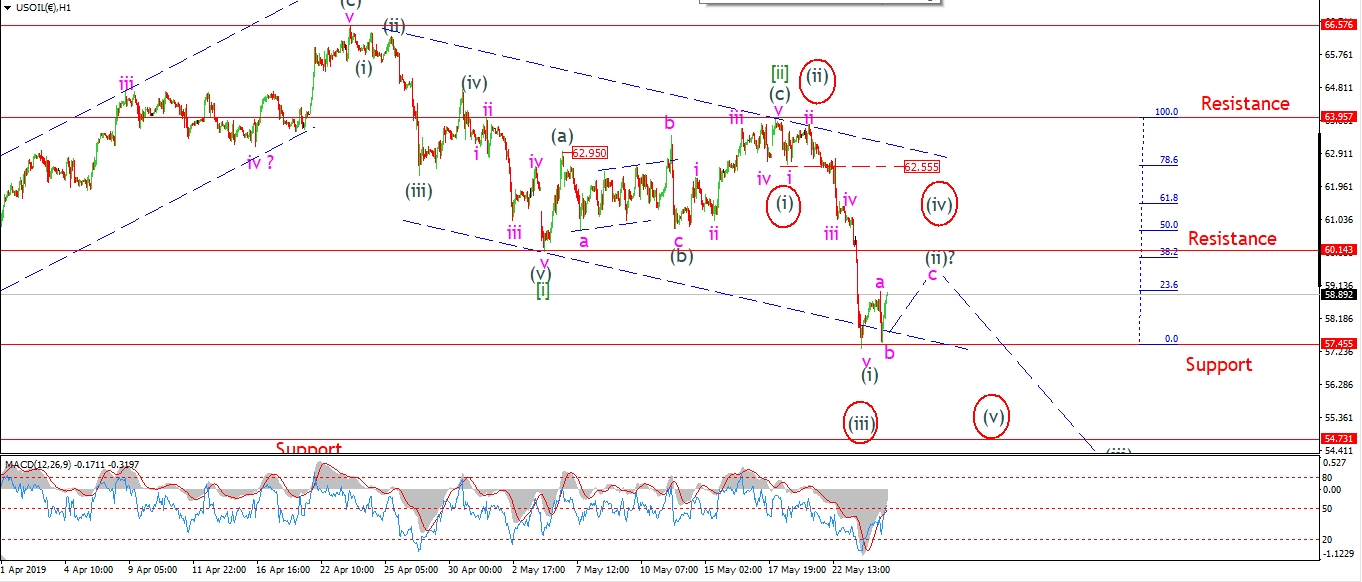 [/vc_column_text][/vc_column][vc_column width=”1/3″][vc_custom_heading text=”4 Hours” use_theme_fonts=”yes”][vc_column_text]
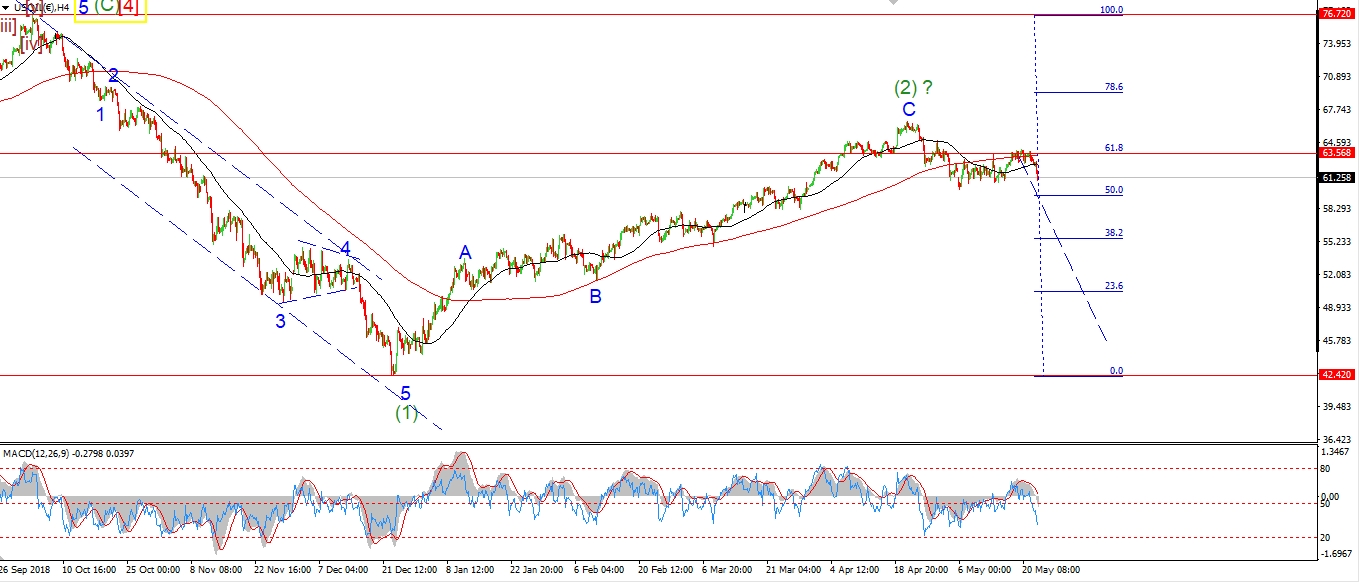 [/vc_column_text][vc_custom_heading text=”Daily” use_theme_fonts=”yes”][vc_column_text]
 [/vc_column_text][/vc_column][/vc_row]
[vc_row][vc_column][vc_column_text]
Crude has corrected off the recent lows in a three wave fashion so far.
I have labelled this sideways move as wave (ii) of [iii],
Although I can’t rule out the alternate count either.
It really depends on the action from this point as to which interpretation fits best.
A rally above 60.00 again will fit the wave (ii) count better.
However a triangle wave will favor the wave (iv) scenario.
Next week;
The early action should shed some light on this problem for us.
Watch for resistance at 60.14 hold the price for now.
[/vc_column_text][/vc_column][/vc_row]
[vc_row][vc_column][vc_separator border_width=”5″][/vc_column][/vc_row][vc_row][vc_column][vc_column_text]
US 10 yr Treasuries.
[/vc_column_text][/vc_column][/vc_row][vc_row][vc_column][vc_separator border_width=”5″][/vc_column][/vc_row][vc_row][vc_column width=”2/3″][vc_custom_heading text=”1 hr” use_theme_fonts=”yes”][vc_column_text] [/vc_column_text][/vc_column][vc_column width=”1/3″][vc_custom_heading text=”4 Hours” use_theme_fonts=”yes”][vc_column_text]
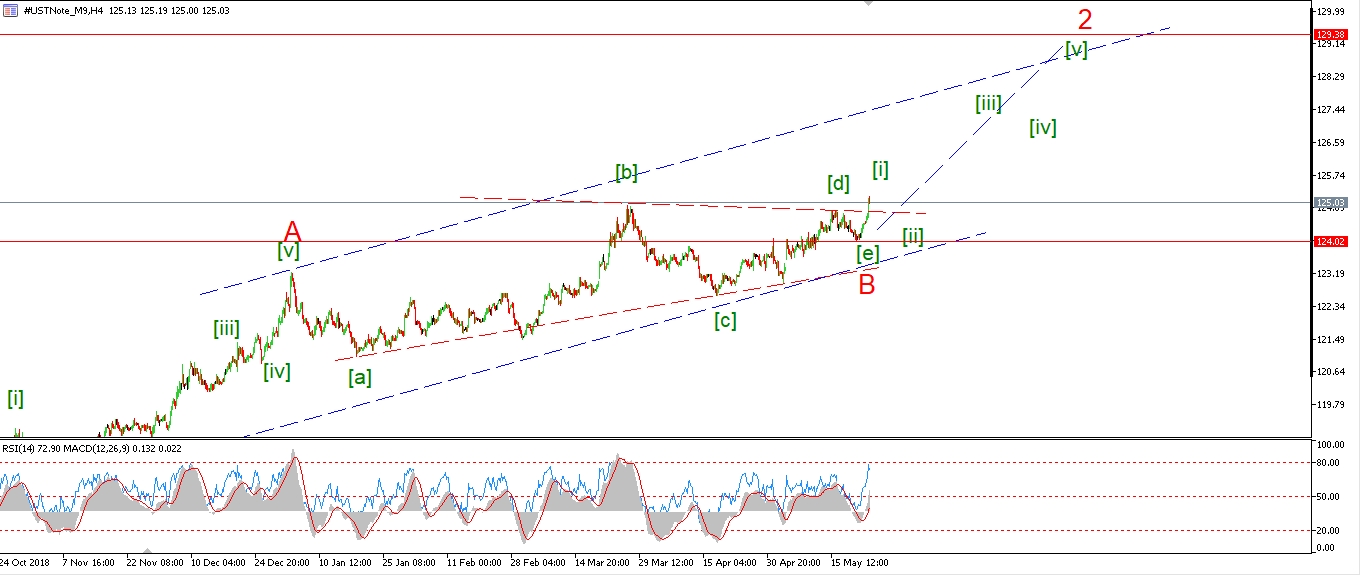 [/vc_column_text][vc_custom_heading text=”Daily” use_theme_fonts=”yes”][vc_column_text]
 [/vc_column_text][/vc_column][/vc_row]
[vc_row][vc_column][vc_column_text]
I have shown the recent rally off the triangle low at 124.00 as wave [i] up.
the decline off that level today is labelled as wave [ii] underway.
And this should trace out a three wave corrective higher low above 124.00 over the coming week.
this will signal that the market is ready to rally in wave [iii] of ‘C’.
And also,
that action will be a bearish signal for the stock market.
As we are likely to see an initial rush into Treasuries
to coincide with a sharp selloff in stocks.
Next week;
Watch for a higher low to complete above 124.00 in wave [ii] of ‘C’.
[/vc_column_text][/vc_column][/vc_row]
[vc_row][vc_column][vc_separator border_width=”5″][/vc_column][/vc_row][vc_row][vc_column][vc_column_text]
SILVER
[/vc_column_text][/vc_column][/vc_row][vc_row][vc_column][vc_separator border_width=”5″][/vc_column][/vc_row][vc_row][vc_column width=”2/3″][vc_custom_heading text=”1 hr” use_theme_fonts=”yes”][vc_column_text] [/vc_column_text][/vc_column][vc_column width=”1/3″][vc_custom_heading text=”4 Hours” use_theme_fonts=”yes”][vc_column_text]
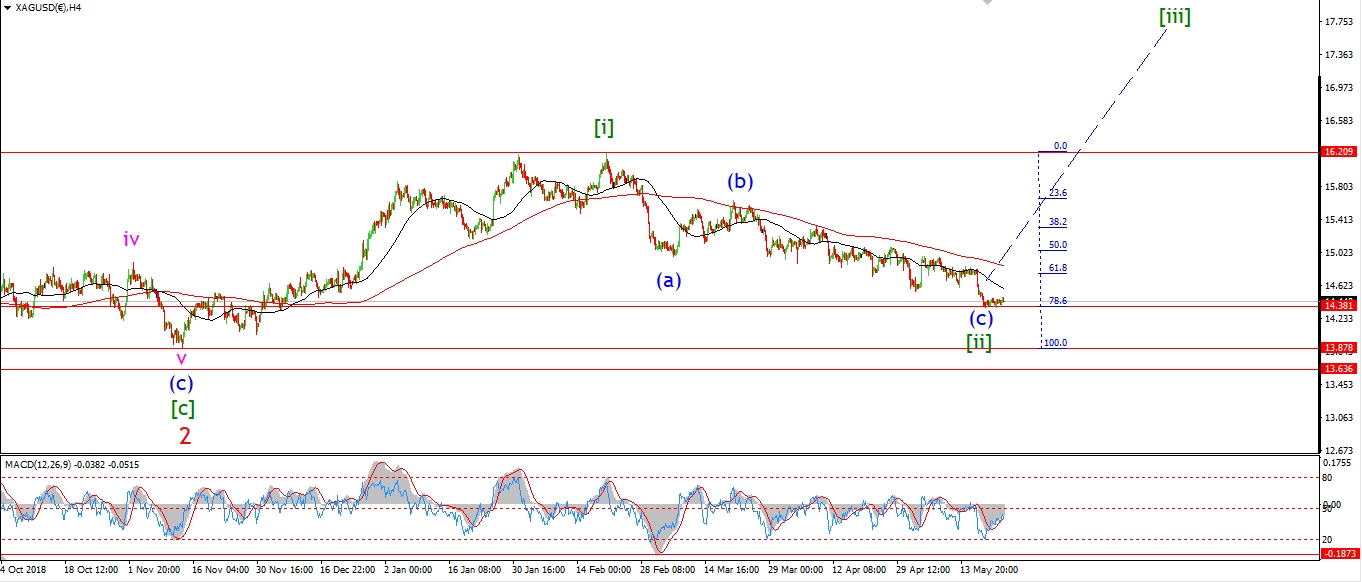 [/vc_column_text][vc_custom_heading text=”Daily” use_theme_fonts=”yes”][vc_column_text]
 [/vc_column_text][/vc_column][/vc_row]
[vc_row][vc_column][vc_column_text]
Silver corrected off the high today also.
This could be viewed as a correction in wave ‘3’ of ‘i’ as shown.
If this is the case,
we should see further upside next week as wave ‘i’ progresses towards a five wave rally.
And price should hold above the 14.47 level as wave ‘i’ develops.
Next week;
I will simply be patient as wave ‘i’ goes through the motions.
A break of that wave ‘iv’ high at 14.85 will confirm that the market has turned.
[/vc_column_text][/vc_column][/vc_row]
[vc_row][vc_column][vc_separator border_width=”5″][/vc_column][/vc_row][vc_row][vc_column][vc_column_text]
S&P 500.
[/vc_column_text][/vc_column][/vc_row][vc_row][vc_column][vc_separator border_width=”5″][/vc_column][/vc_row][vc_row][vc_column width=”2/3″][vc_custom_heading text=”1 hr” use_theme_fonts=”yes”][vc_column_text]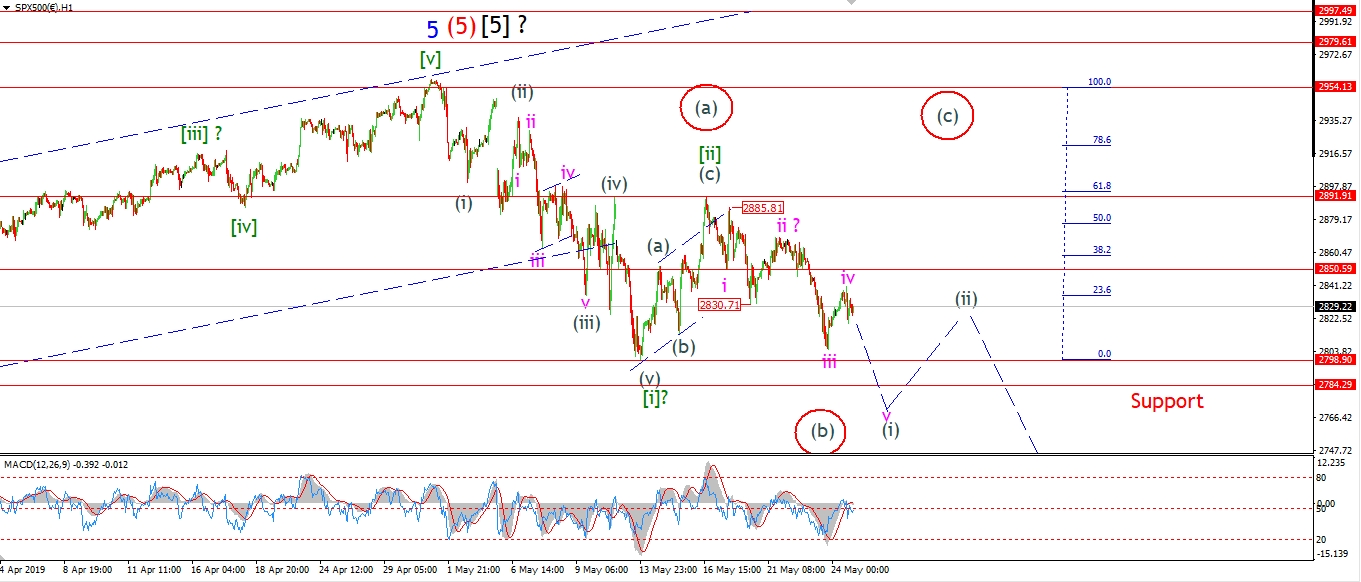 [/vc_column_text][/vc_column][vc_column width=”1/3″][vc_custom_heading text=”4 Hours” use_theme_fonts=”yes”][vc_column_text]
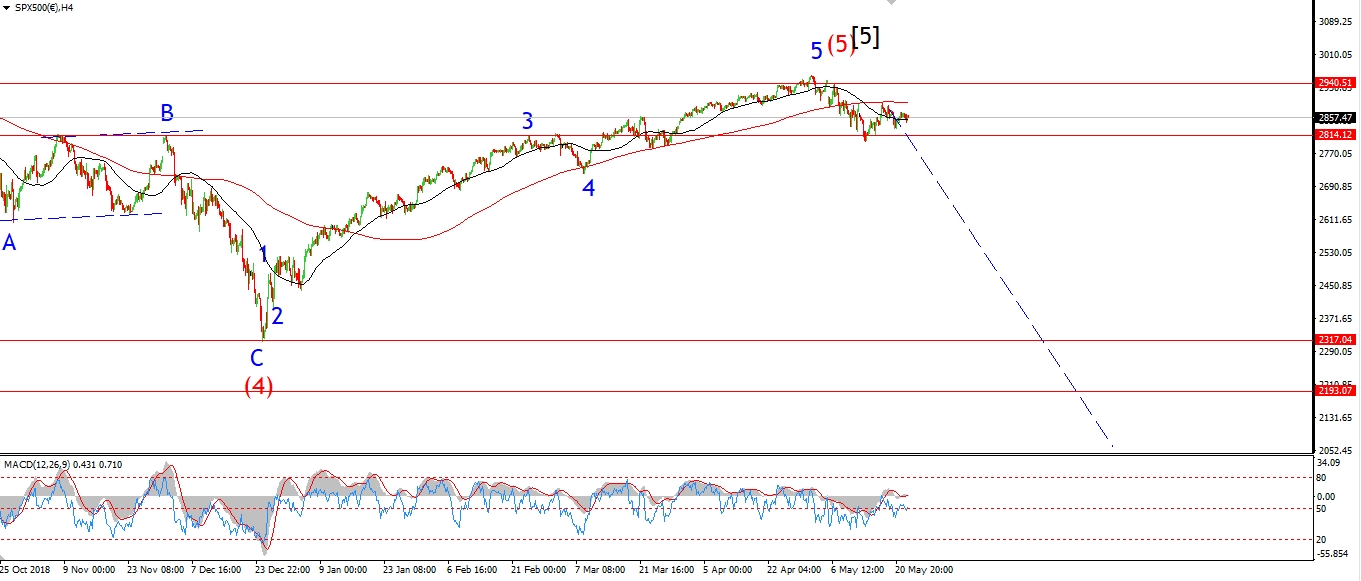 [/vc_column_text][vc_custom_heading text=”Daily” use_theme_fonts=”yes”][vc_column_text]
 [/vc_column_text][/vc_column][/vc_row]
[vc_row][vc_column][vc_column_text]
The S&P is off the session high this evening.
I have labelled this rally today as wave ‘iv’.
But this could also be just wave ‘a’ of a larger flat correction wave ‘iv’.
The alternate wave [ii] scenario is still valid also.
This would allow for a rally up to 2891 again in wave (c) of [ii].
However,
If we see an early turn lower on Monday
to break the wave [i] low at 2798 again.
That action will favor the current wave wave (i) of [iii] count.
And then we can expect a smaller corrective rally
in wave (ii) of [iii].
Next week;
Watch for wave ‘iv’ to complete below the wave ‘i’ low at 2850.
And then turn lower into wave ‘v’.
[/vc_column_text][/vc_column][/vc_row]
[vc_row][vc_column][vc_column_text]
I hope you all have a wonderful weekend.
God bless.
See you back here on Tuesday evening after the long weekend.
[/vc_column_text][/vc_column][/vc_row]
[vc_row][vc_column][vc_separator border_width=”5″][/vc_column][/vc_row]