
[vc_row][vc_column][vc_separator border_width=”5″][/vc_column][/vc_row]
[vc_row][vc_column][vc_column_text]
Hello everyone.
Heres a recent chart from Jesse Felder.
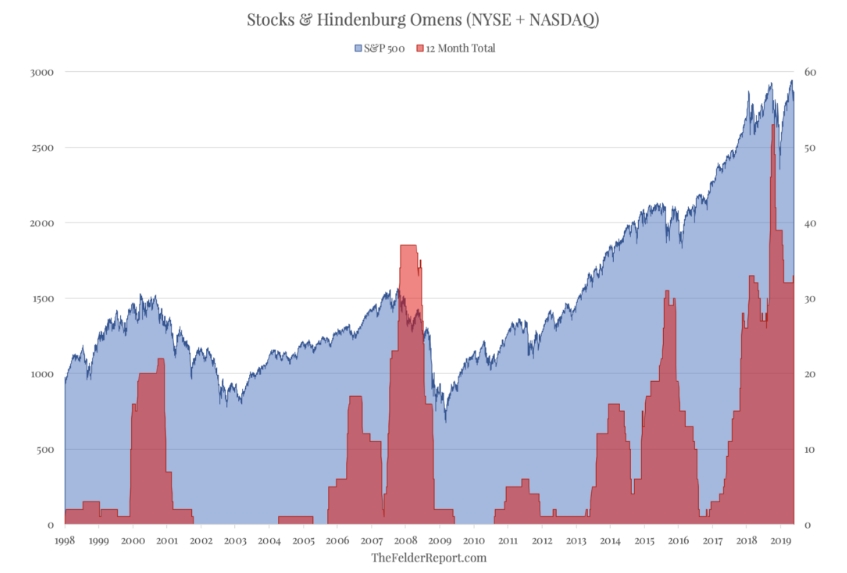
It shows the YoY running total of Hindenburg omens in the broad market beginning in 1998.
The chart is very good at putting the current market position in perspective. And along with that,
it shows the very real possibility for a massive crash scenario that I have been talking about incessantly over the last year!
The omens keep adding up, and the higher the market goes – the less people believe any harm can come upon them.
And of course with that build up in complacency, the higher the likelihood is that a huge bear-market will occur!
And then we have todays trade.
Lets get into it shall we.
[/vc_column_text][/vc_column][/vc_row]
[vc_row][vc_column][vc_separator border_width=”5″][/vc_column][/vc_row]
[vc_row][vc_column][vc_column_text]
EURUSD
[/vc_column_text][/vc_column][/vc_row]
[vc_row][vc_column][vc_separator border_width=”5″][/vc_column][/vc_row][vc_row][vc_column width=”2/3″][vc_custom_heading text=”1 hr” use_theme_fonts=”yes”][vc_column_text]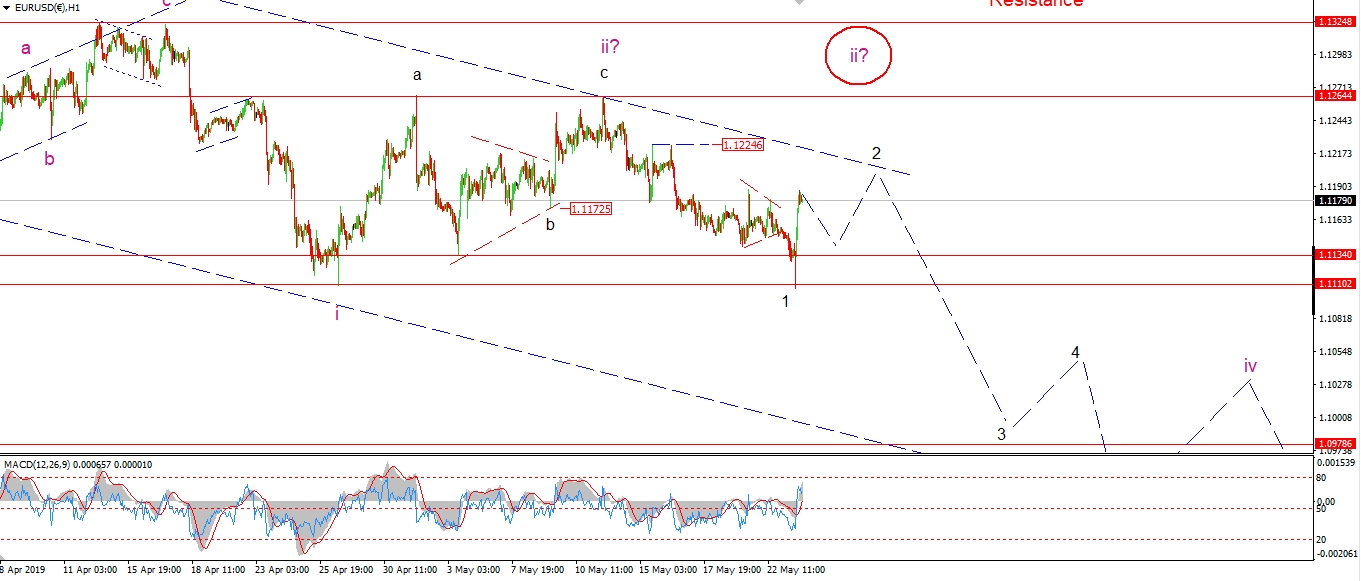 [/vc_column_text][/vc_column][vc_column width=”1/3″][vc_custom_heading text=”4 Hours” use_theme_fonts=”yes”][vc_column_text]
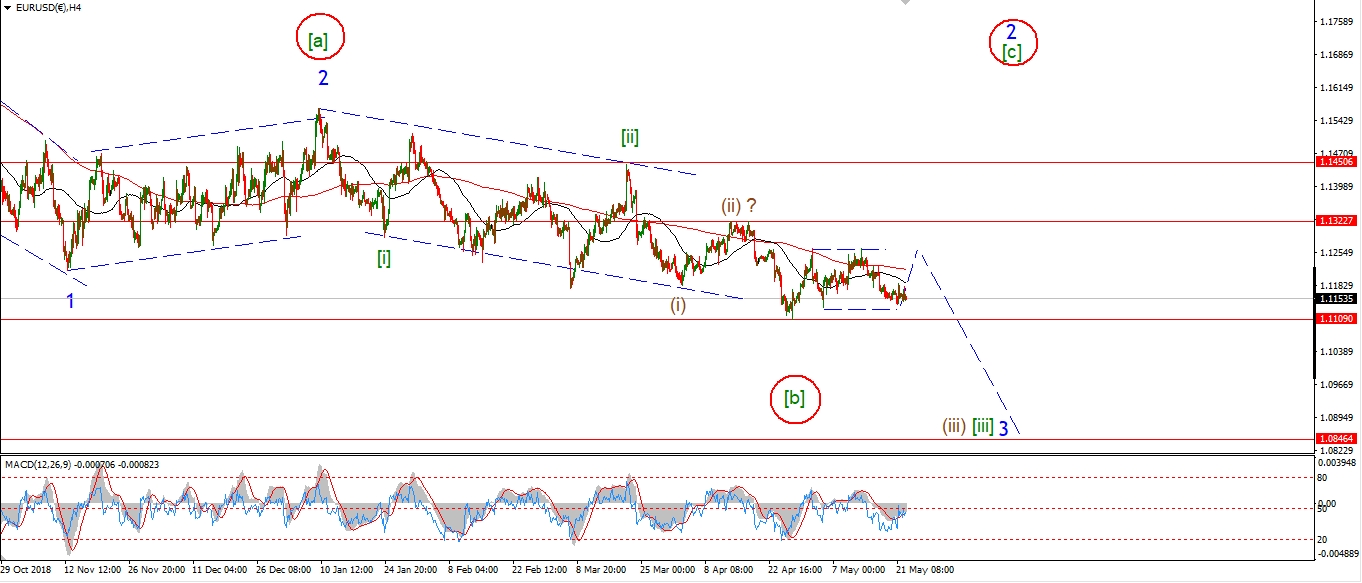 [/vc_column_text][vc_custom_heading text=”Daily” use_theme_fonts=”yes”][vc_column_text]
 [/vc_column_text][/vc_column][/vc_row]
[vc_row][vc_column][vc_column_text]
EURUSD did break the lower support at 1.1110 this afternoon,
and then immediately rallied back above the minor triangle wave that formed this week.
I have shown a slightly different interpretation this evening after todays rally,
this involves the potential for an even larger wave ‘iii’ down.
With the recent decline off wave ‘ii’ labelled as only wave ‘1’ of ‘iii’.
And the rally off the low now part of a larger wave ‘2’ of ‘iii’.
Tomorrow;
Watch for a three wave rally to trace out in wave ‘2’ and complete below the trend channel line.
[/vc_column_text][/vc_column][/vc_row]
[vc_row][vc_column][vc_separator border_width=”5″][/vc_column][/vc_row][vc_row][vc_column][vc_column_text]
GBPUSD
[/vc_column_text][/vc_column][/vc_row][vc_row][vc_column][vc_separator border_width=”5″][/vc_column][/vc_row][vc_row][vc_column width=”2/3″][vc_custom_heading text=”1 hr” use_theme_fonts=”yes”][vc_column_text] [/vc_column_text][/vc_column][vc_column width=”1/3″][vc_custom_heading text=”4 Hours” use_theme_fonts=”yes”][vc_column_text]
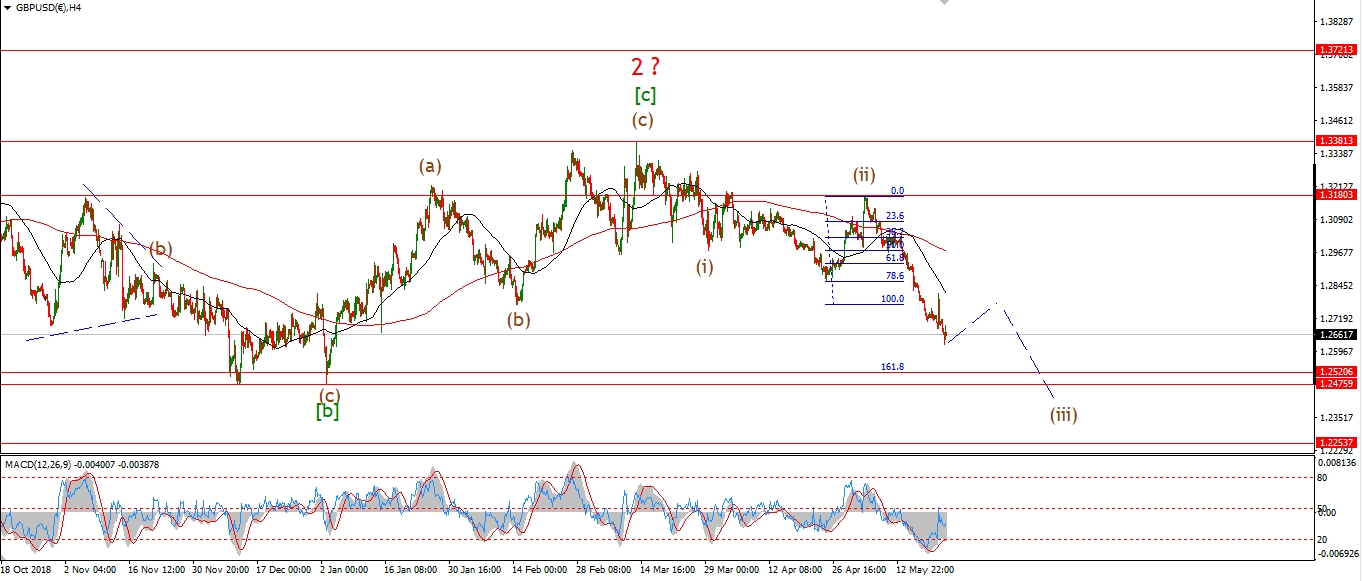 [/vc_column_text][vc_custom_heading text=”Daily” use_theme_fonts=”yes”][vc_column_text]
 [/vc_column_text][/vc_column][/vc_row]
[vc_row][vc_column][vc_column_text]
Cable dropped to a slight new low this afternoon which should complete wave ‘5’ of ‘iii’.
Wave ‘5’ itself has traced out a small five wave internal pattern.
This should lead to a new corrective rally in wave ‘iv’ off these lows.
It is impossible to know what pattern wave ‘iv’ will take from here,
but the initial target for wave ‘iv’ lies at the previous fourth wave high at 1.2816.
Tomorrow;
Wave ‘iv’ should at least trace out a three wave pattern higher over the next week or so.
Watch for wave ‘a’ of ‘iv’ to continue higher tomorrow.
[/vc_column_text][/vc_column][/vc_row]
[vc_row][vc_column][vc_separator border_width=”5″][/vc_column][/vc_row][vc_row][vc_column][vc_column_text]
USDJPY
[/vc_column_text][/vc_column][/vc_row][vc_row][vc_column][vc_separator border_width=”5″][/vc_column][/vc_row][vc_row][vc_column width=”2/3″][vc_custom_heading text=”1 hr” use_theme_fonts=”yes”][vc_column_text]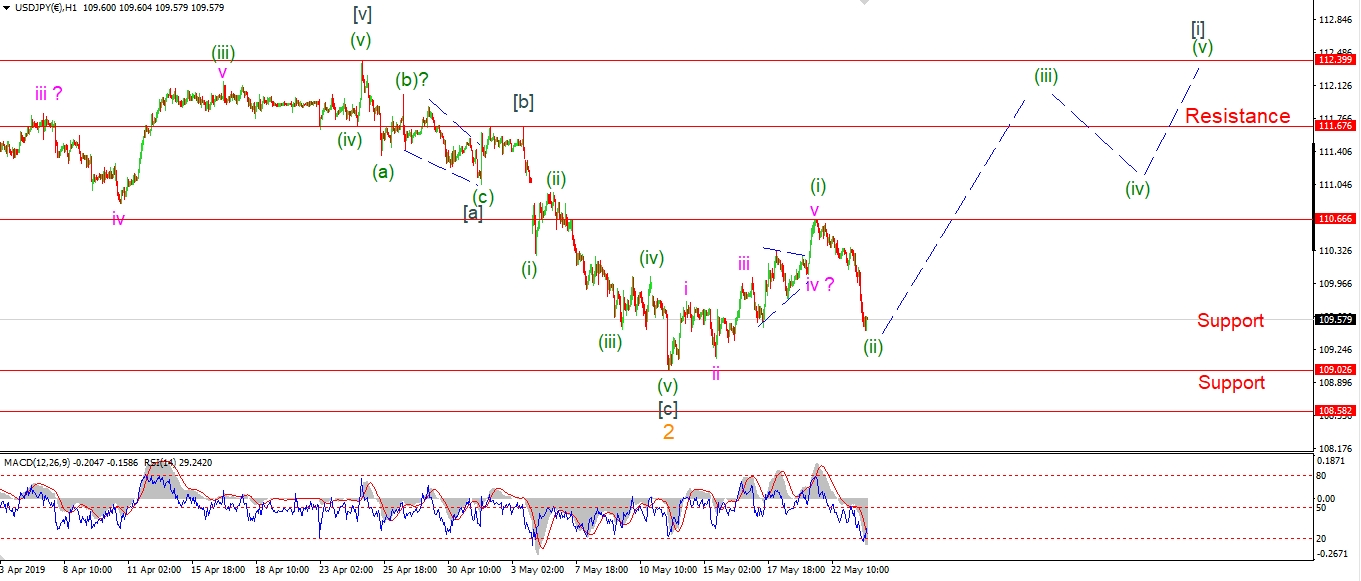 [/vc_column_text][/vc_column][vc_column width=”1/3″][vc_custom_heading text=”4 Hours” use_theme_fonts=”yes”][vc_column_text]
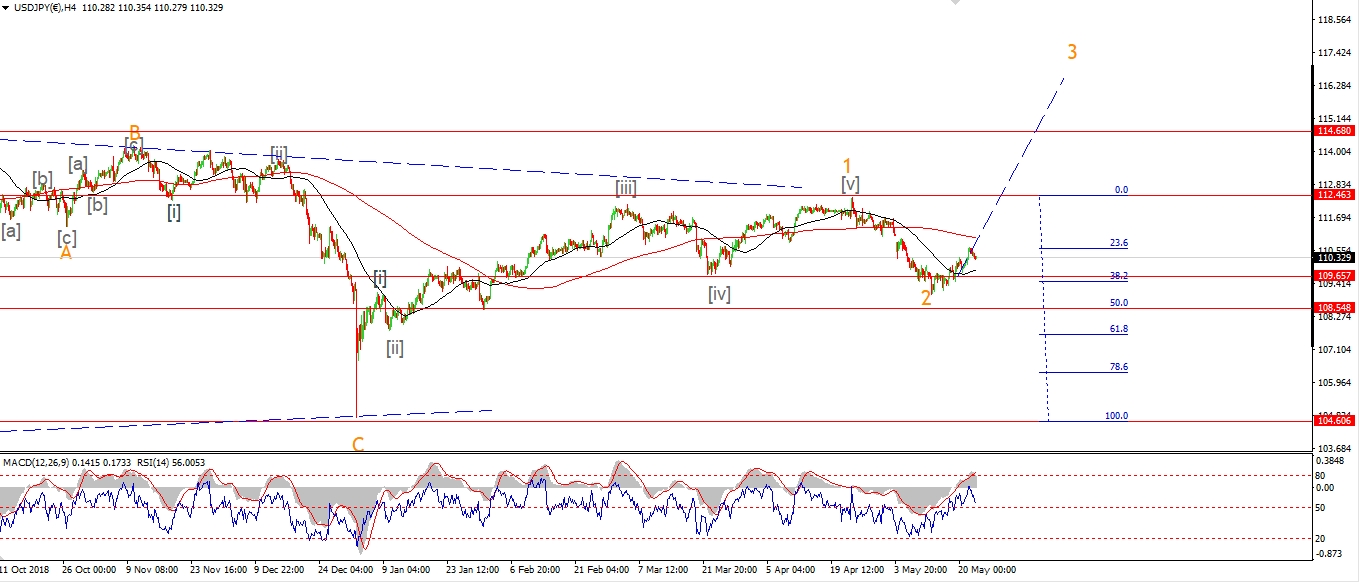 [/vc_column_text][vc_custom_heading text=”Daily” use_theme_fonts=”yes”][vc_column_text]
 [/vc_column_text][/vc_column][/vc_row]
[vc_row][vc_column][vc_column_text]
The pattern in USDJPY is getting more complicated by the day now.
Todays stock market selloff was joined by a sell off in USDJPY.
The fact that the Yen was bid up off the back of a drop in the stock market is interesting.
And I will be watching how this develops closely over the coming week.
But so long as 109.02 holds from here,
then I am viewing this as a second wave decline with a rally in wave (iii) to follow.
Tomorrow;
Watch for wave (ii) to complete above 109.02.
A break above 110.66 again will confirm wave (iii) has begun.
[/vc_column_text][/vc_column][/vc_row]
[vc_row][vc_column][vc_separator border_width=”5″][/vc_column][/vc_row][vc_row][vc_column][vc_column_text]
DOW JONES INDUSTRIALS
[/vc_column_text][/vc_column][/vc_row][vc_row][vc_column][vc_separator border_width=”5″][/vc_column][/vc_row][vc_row][vc_column width=”2/3″][vc_custom_heading text=”1 hr” use_theme_fonts=”yes”][vc_column_text]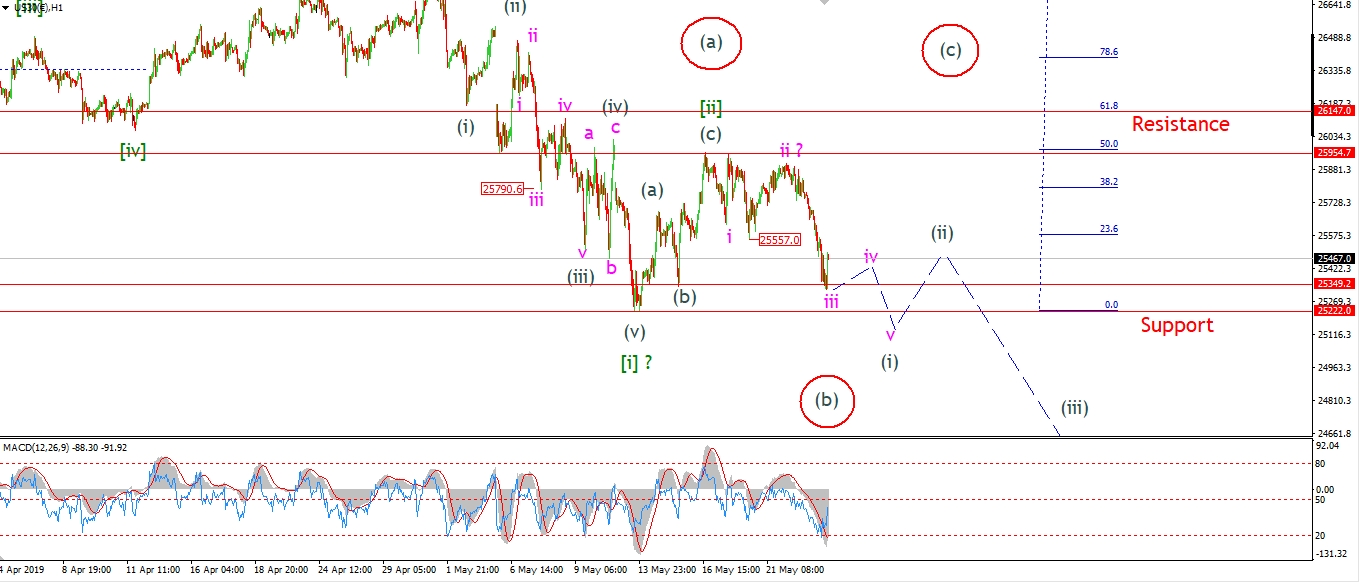 [/vc_column_text][/vc_column][vc_column width=”1/3″][vc_custom_heading text=”4 Hours” use_theme_fonts=”yes”][vc_column_text]
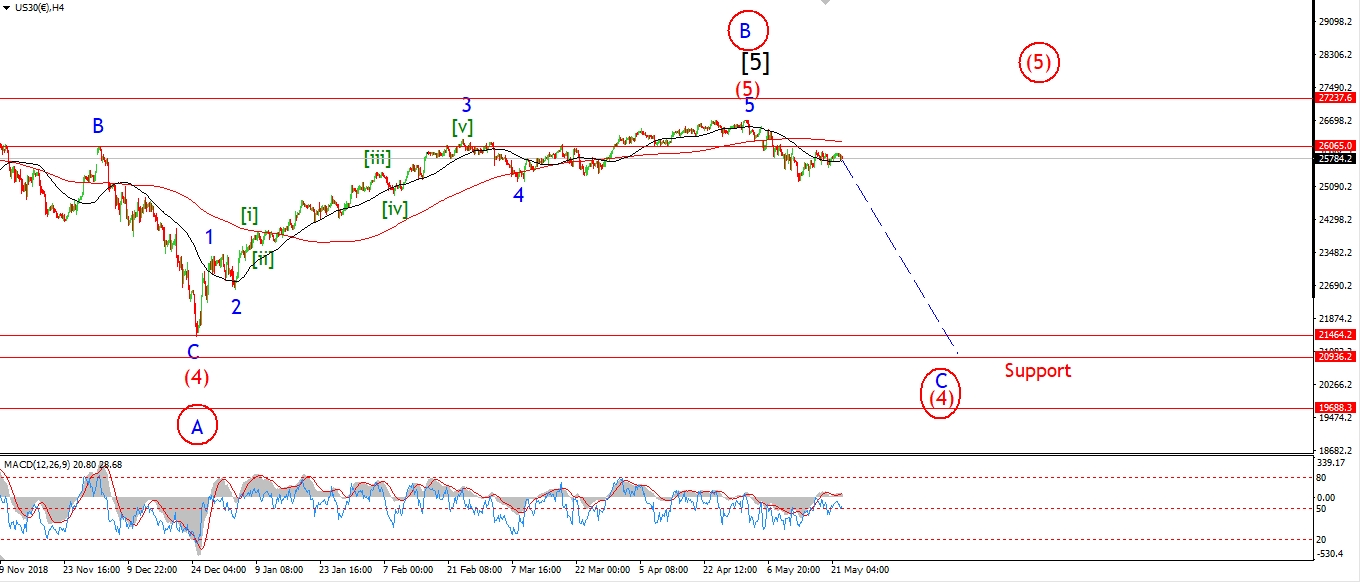 [/vc_column_text][vc_custom_heading text=”Daily” use_theme_fonts=”yes”][vc_column_text]
 [/vc_column_text][/vc_column][/vc_row]
[vc_row][vc_column][vc_column_text]
The DOW has just broken 25349 this evening as we approach the final half hour of the session.
I have labelled this decline as wave ‘iii’ of (i).
And this decline is a good sign that the larger wave [iii] down is now underway.
A break of 25222 will confirm wave [iii] as wave (i) of [iii] completes.
The pattern off the high is now nearing a critical point,
the creation of a lower degree impulse wave will be complete at wave (ii) early next week.
And then we face a decline in wave (iii) of [iii].
And that wave could easily take the market down below 24000 again.
As for the alternate count,
I still cant rule it out just yet.
So far the decline off wave [ii] has only traced out a three wave pattern.
This can also be viewed as wave (b) as per the alternate count.
If we see a clear five wave pattern develop in wave (i) over the next few sessions,
That will rule out the alternate count.
Tomorrow;
Watch for wave (i) to continue lower for another few sessions.
Ideally we should break 25222 in wave (i).
There is a good chance that wave ‘iv’ of (i) will correct higher tomorrow.
Wave ‘iv’ should hold below 25557.
[/vc_column_text][/vc_column][/vc_row]
[vc_row][vc_column][vc_separator border_width=”5″][/vc_column][/vc_row][vc_row][vc_column][vc_column_text]
GOLD
[/vc_column_text][/vc_column][/vc_row][vc_row][vc_column][vc_separator border_width=”5″][/vc_column][/vc_row][vc_row][vc_column width=”2/3″][vc_custom_heading text=”1 hr” use_theme_fonts=”yes”][vc_column_text]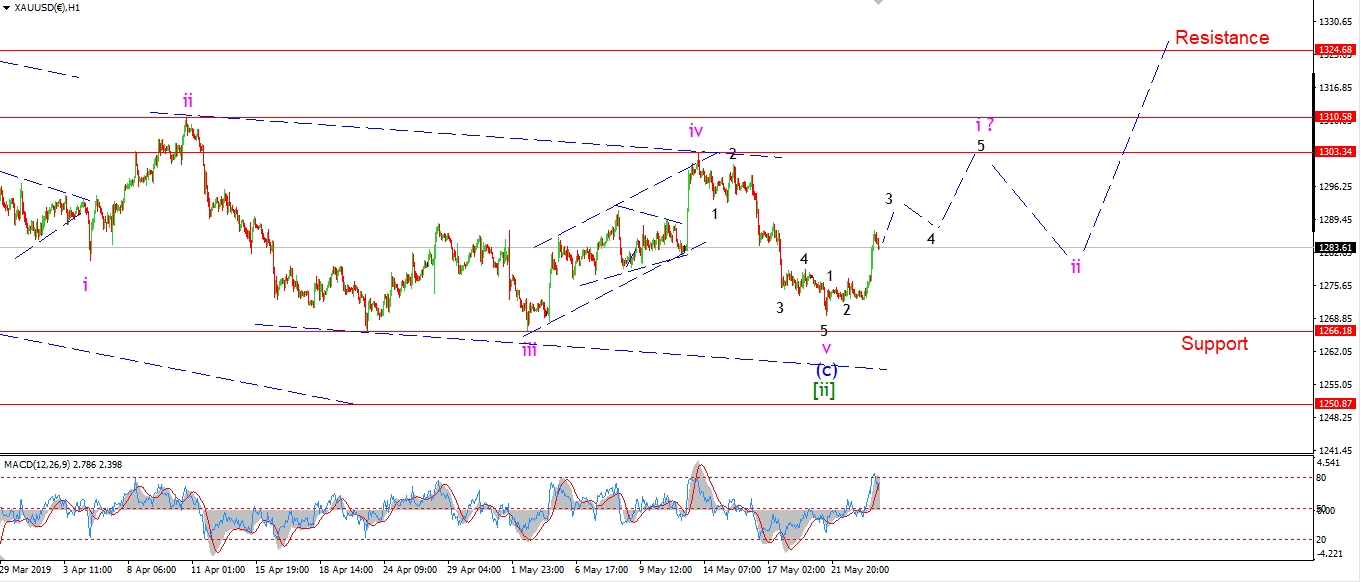 [/vc_column_text][/vc_column][vc_column width=”1/3″][vc_custom_heading text=”4 Hours” use_theme_fonts=”yes”][vc_column_text]
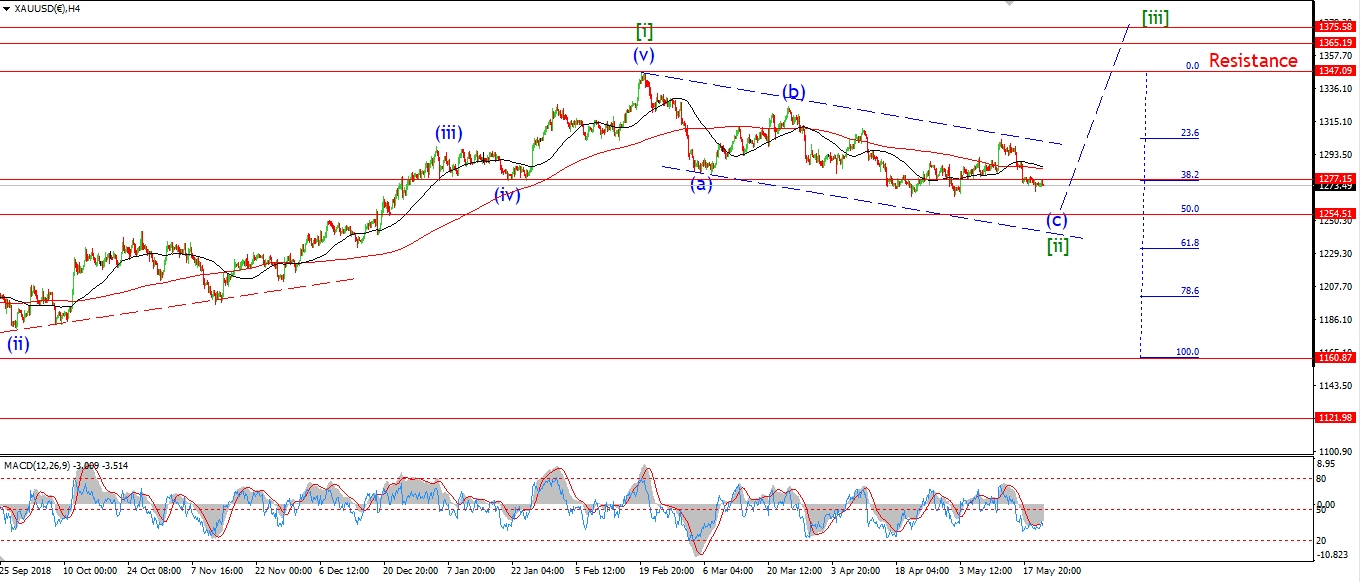 [/vc_column_text][vc_custom_heading text=”Daily” use_theme_fonts=”yes”][vc_column_text]
 [/vc_column_text][/vc_column][/vc_row]
[vc_row][vc_column][vc_column_text]
I had thought that we would see a rally before the end of this week to begin wave ‘i’ up.
But I did not expect wave ‘v’ to complete as a truncated fifth wave above 1266.
The sell-off in stocks today prompted a rally in Gold,
This action is again viewed as the beginning of a much larger run up in wave (i) of [iii].
And todays rally is labelled as the beginning of wave ‘i’ of (i).
Wave ‘i’ should push up above 1300 in five waves over the next few sessions,
and then I want to see a corrective higher low in wave ‘ii’.
That will create a bullish impulse wave higher,
and create a good opportunity on the long side.
Tomorrow;
Watch for wave ‘i’ to continue higher in five waves.
[/vc_column_text][/vc_column][/vc_row]
[vc_row][vc_column][vc_separator border_width=”5″][/vc_column][/vc_row][vc_row][vc_column][vc_column_text]
U.S CRUDE OIL
[/vc_column_text][/vc_column][/vc_row][vc_row][vc_column][vc_separator border_width=”5″][/vc_column][/vc_row][vc_row][vc_column width=”2/3″][vc_custom_heading text=”1 hr” use_theme_fonts=”yes”][vc_column_text]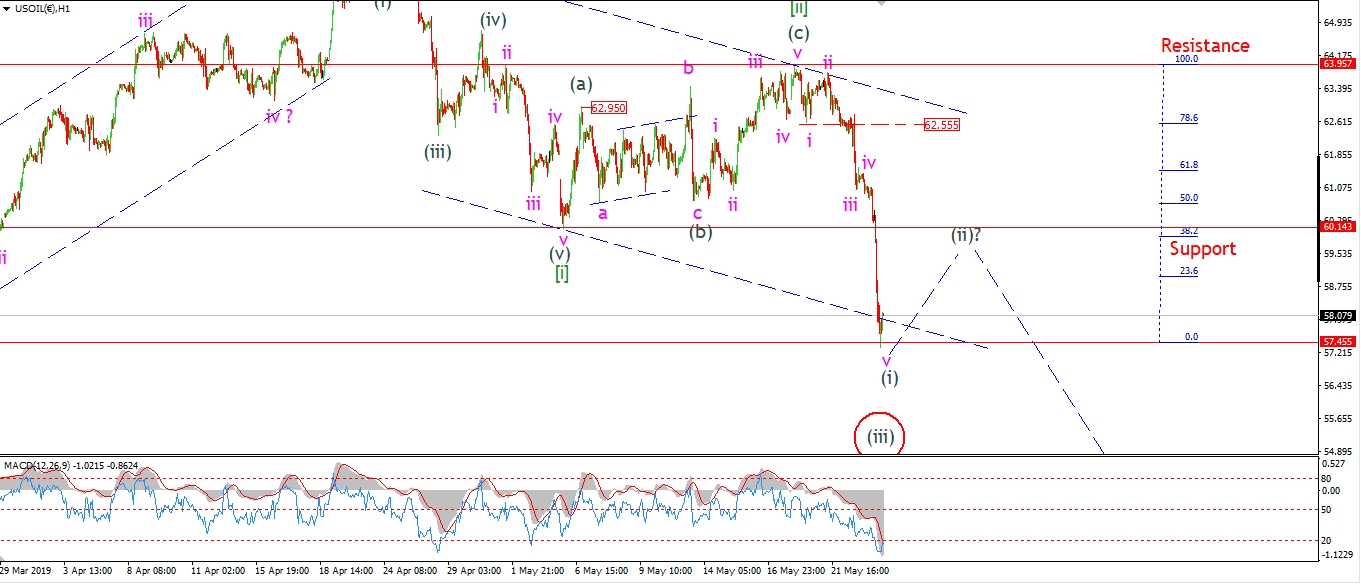 [/vc_column_text][/vc_column][vc_column width=”1/3″][vc_custom_heading text=”4 Hours” use_theme_fonts=”yes”][vc_column_text]
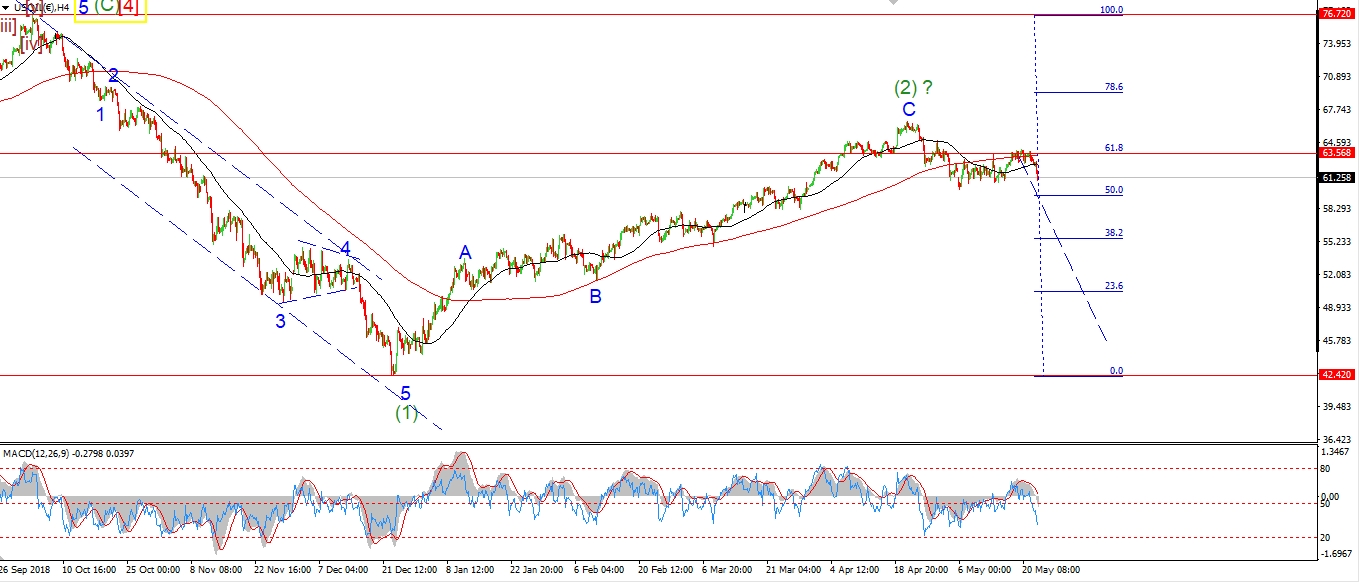 [/vc_column_text][vc_custom_heading text=”Daily” use_theme_fonts=”yes”][vc_column_text]
 [/vc_column_text][/vc_column][/vc_row]
[vc_row][vc_column][vc_column_text]
Crude took a serious hit today along with stocks.
The market is now down 600 points off Mondays highs at wave [ii].
And this weeks declines have actually equaled the decline in wave [i].
This would normally be the minimum target for the larger wave [iii].
With that in mind,
it is possible that the drop today was wave (iii) of [iii],
rather than wave (i) of [iii] as shown.
This is now the first alternate count.
Tomorrow;
Overall the market has traced out a three wave decline off the high.
So we do need to see further declines in wave [iii] to rule out a large correction off the highs.
Watch for a correction higher to begin soon in either wave (ii) or wave (iv) of [iii].
The size of the correction off the lows will determine the correct labeling in wave [iii].
I will go over that in more detail in tomorrows video.
[/vc_column_text][/vc_column][/vc_row]
[vc_row][vc_column][vc_separator border_width=”5″][/vc_column][/vc_row][vc_row][vc_column][vc_column_text]
US 10 yr Treasuries.
[/vc_column_text][/vc_column][/vc_row][vc_row][vc_column][vc_separator border_width=”5″][/vc_column][/vc_row][vc_row][vc_column width=”2/3″][vc_custom_heading text=”1 hr” use_theme_fonts=”yes”][vc_column_text]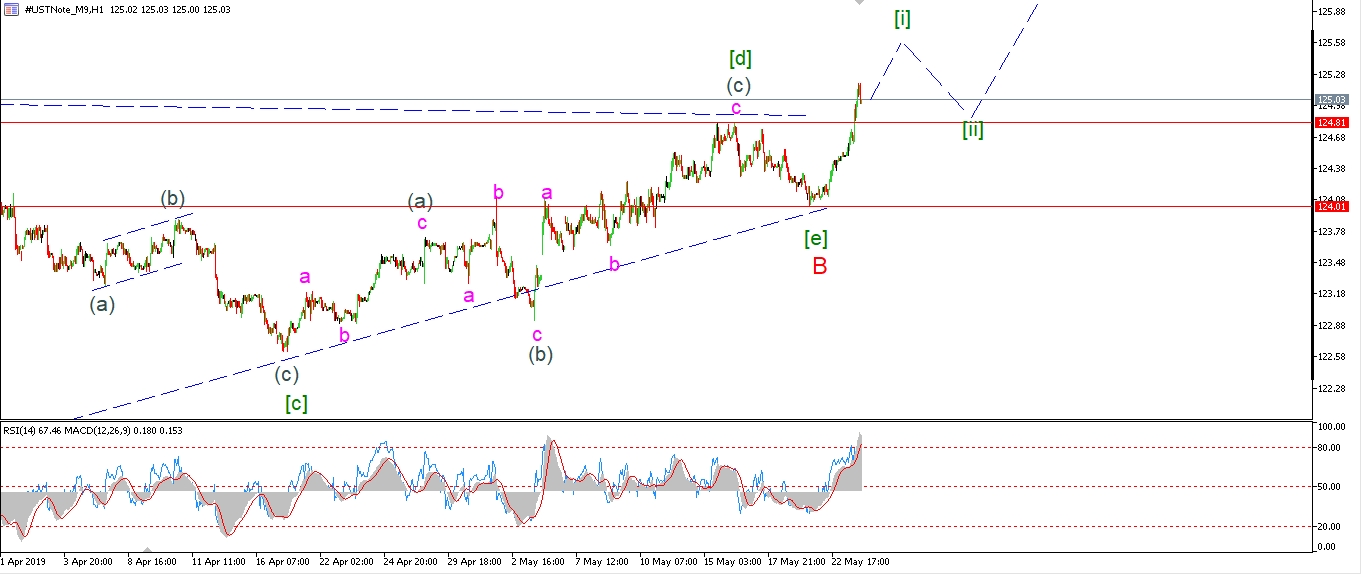 [/vc_column_text][/vc_column][vc_column width=”1/3″][vc_custom_heading text=”4 Hours” use_theme_fonts=”yes”][vc_column_text]
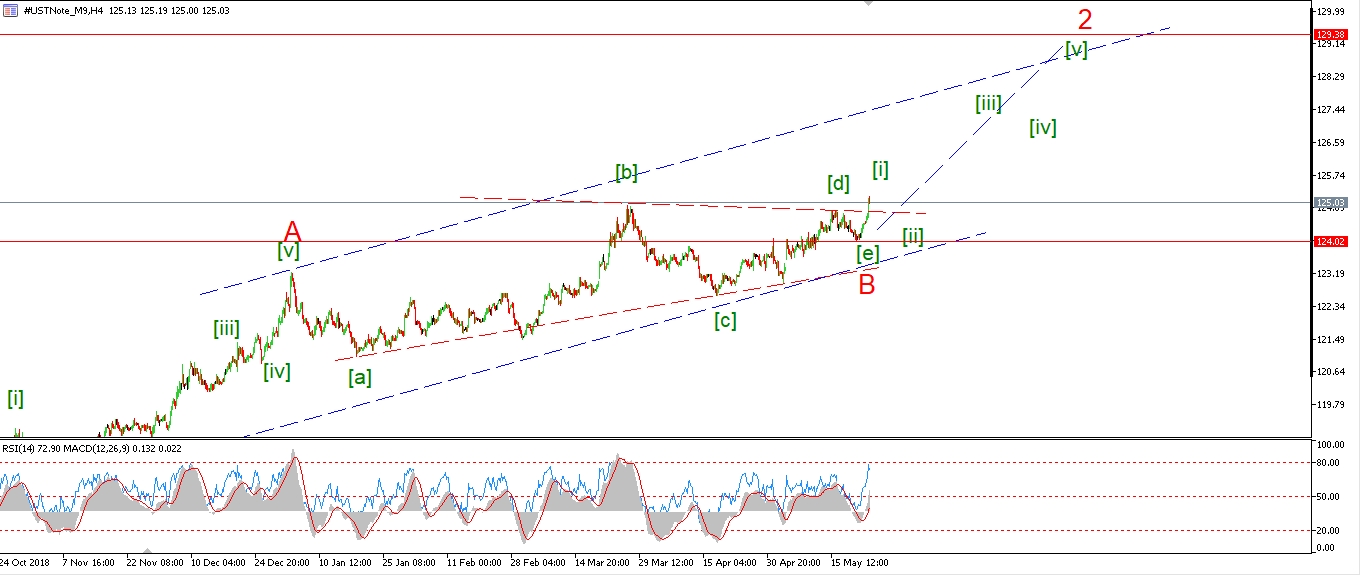 [/vc_column_text][vc_custom_heading text=”Daily” use_theme_fonts=”yes”][vc_column_text]
 [/vc_column_text][/vc_column][/vc_row]
[vc_row][vc_column][vc_column_text]
Todays rally has forced me to rethink the wave count completely for the 10YR.
Lets start on the daily chart.
I have shown the decline into the September lows last year as wave (1),
and the rally off that low as wave (2).
I was under the impression that wave (2) was already complete,
but todays rally broke to a new high and has ruled out that idea.
You can now see a large barrier triangle as the likely pattern for wave ‘B’ red,
And wave ‘C’ red now underway.
Wave ‘C’ should hit the previous wave ‘2’ high at 127.80 to complete the correction in wave (2).
On the 4HR chart;
you can see that triangle more clearly.
The lower waves [a], [c] and [e] all rose
to meet a flat top top of the triangle at waves [b] and [d].
The rally out of the triangle today is viewed as part of wave [i] of ‘C’.
On the hourly chart;
The rally today looks very impulsive and is labelled wave [i].
Wave [ii] should now create a bullish higher low and setup for a rally in wave [iii] of ‘C’ over the coming few weeks.
Wave ‘B’ completed at the low of 124.01.
That low should now hold.
[/vc_column_text][/vc_column][/vc_row]
[vc_row][vc_column][vc_separator border_width=”5″][/vc_column][/vc_row][vc_row][vc_column][vc_column_text]
SILVER
[/vc_column_text][/vc_column][/vc_row][vc_row][vc_column][vc_separator border_width=”5″][/vc_column][/vc_row][vc_row][vc_column width=”2/3″][vc_custom_heading text=”1 hr” use_theme_fonts=”yes”][vc_column_text]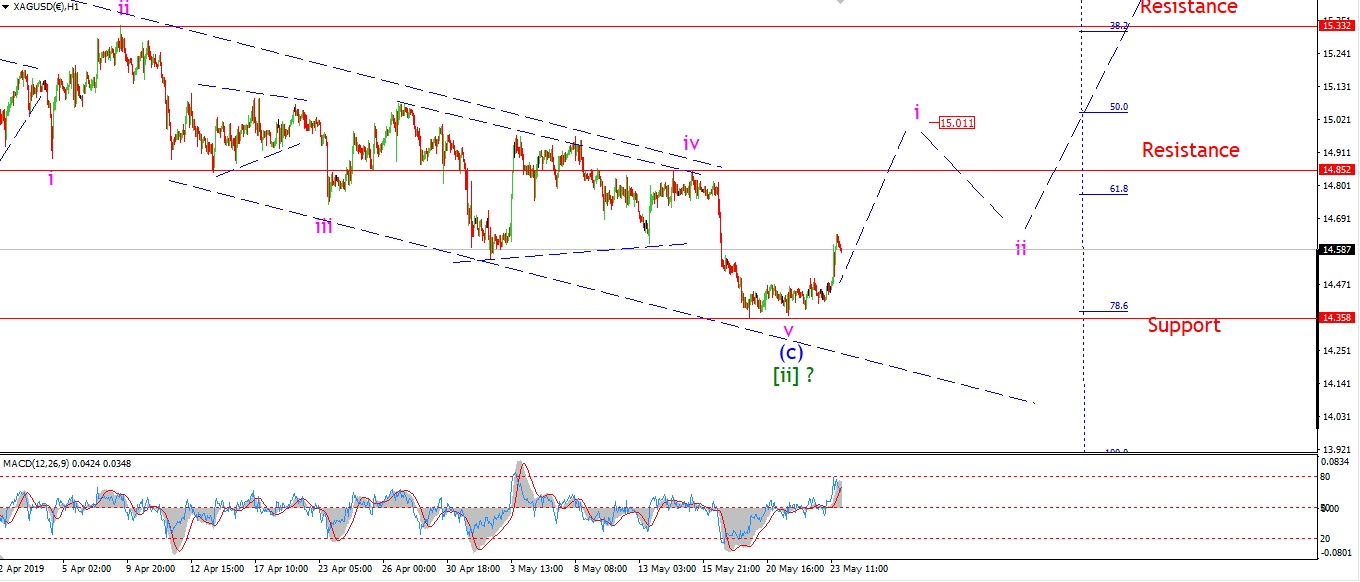 [/vc_column_text][/vc_column][vc_column width=”1/3″][vc_custom_heading text=”4 Hours” use_theme_fonts=”yes”][vc_column_text]
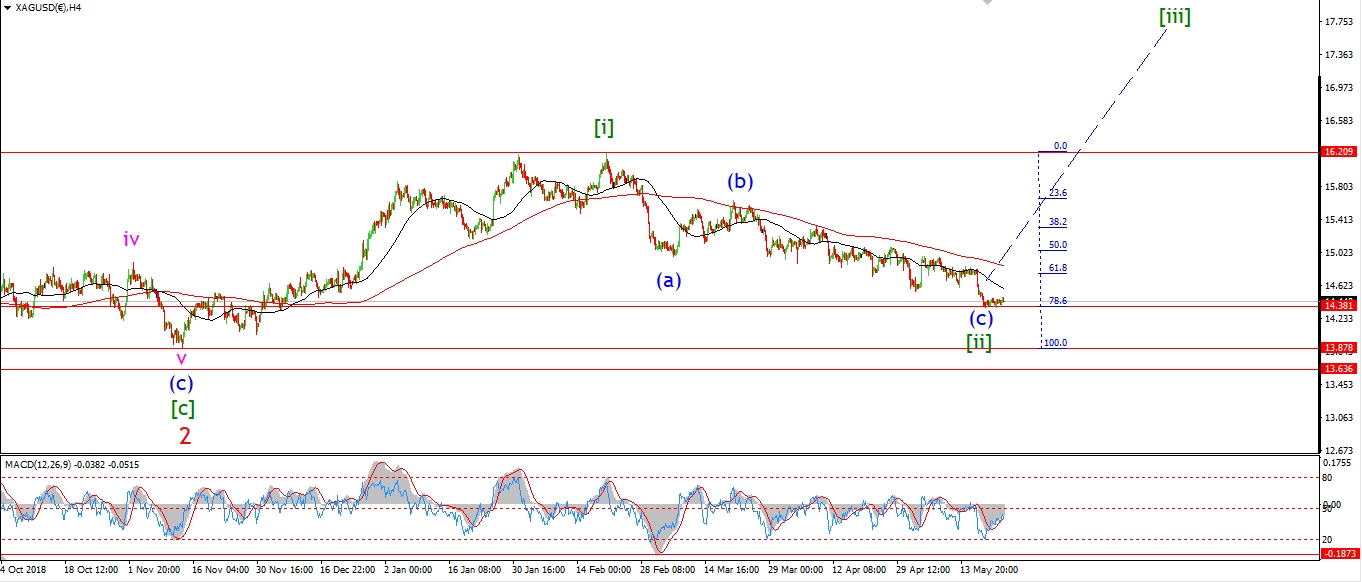 [/vc_column_text][vc_custom_heading text=”Daily” use_theme_fonts=”yes”][vc_column_text]
 [/vc_column_text][/vc_column][/vc_row]
[vc_row][vc_column][vc_column_text]
Unlike Gold,
Silver did make a new low in wave ‘v’ this week.
So the pattern in wave (c) is a clear five waves down.
And this suggests a completed correction in wave [ii].
Todays rally is likely the beginning of wave (i) of [iii] to the upside.
Even though the recent sideways action was corrective looking,
the market has rallied out of that formation quite impulsively today.
If this rally continues above 14.85 again in five waves.
That should be enough to call wave [ii] complete
and the next leg up underway.
Tomorrow;
Watch for wave ‘i’ to continue higher in five waves.
14.35 should hold.
[/vc_column_text][/vc_column][/vc_row]
[vc_row][vc_column][vc_separator border_width=”5″][/vc_column][/vc_row][vc_row][vc_column][vc_column_text]
S&P 500.
[/vc_column_text][/vc_column][/vc_row][vc_row][vc_column][vc_separator border_width=”5″][/vc_column][/vc_row][vc_row][vc_column width=”2/3″][vc_custom_heading text=”1 hr” use_theme_fonts=”yes”][vc_column_text]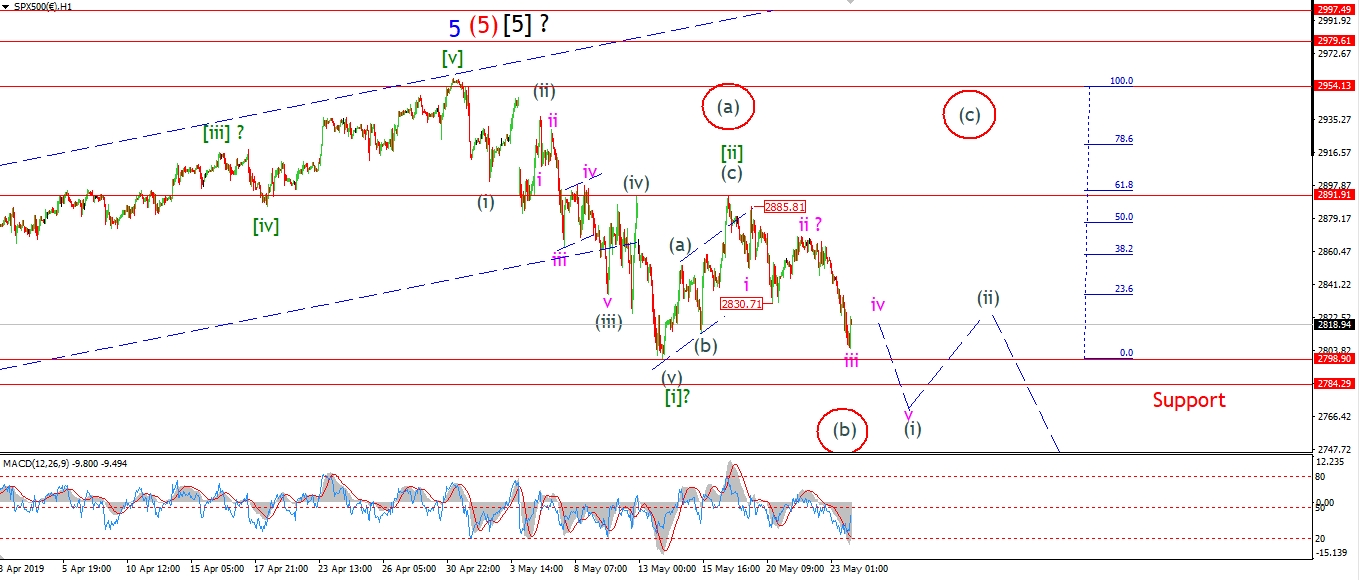 [/vc_column_text][/vc_column][vc_column width=”1/3″][vc_custom_heading text=”4 Hours” use_theme_fonts=”yes”][vc_column_text]
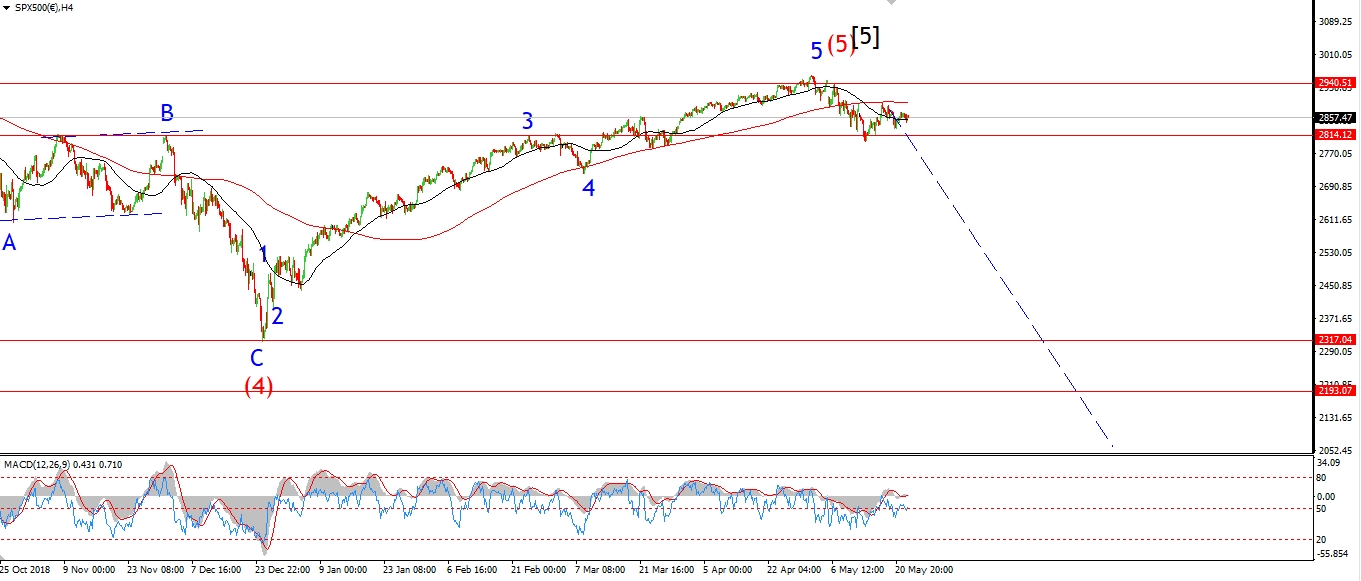 [/vc_column_text][vc_custom_heading text=”Daily” use_theme_fonts=”yes”][vc_column_text]
 [/vc_column_text][/vc_column][/vc_row]
[vc_row][vc_column][vc_column_text]
The S&P fell sharply today in a possible wave ‘iii’ of (i),
but the price did not break support yet.
I suspect that wav (i) will complete below support,
possibly even by tomorrow evening.
As with the DOW,
the alternate count is still a possibility at this moment.
If we see further selling tomorrow and a clear five waves down in wave (i),
that action will rule out the alternate count.
Tomorrow;
At the moment we are on track for a large decline phase in wave [iii]
to carry the market significantly lower for the remainder of the month.
Watch for wave (i) to continue lower in a five wave pattern.
Wave ‘iv’ of (i) may now be underway with the rally off the lows this evening.
[/vc_column_text][/vc_column][/vc_row]
[vc_row][vc_column][vc_column_text]
[/vc_column_text][/vc_column][/vc_row]
[vc_row][vc_column][vc_separator border_width=”5″][/vc_column][/vc_row]