
[vc_row][vc_column][vc_separator border_width=”5″][/vc_column][/vc_row]
[vc_row][vc_column][vc_column_text]
Hi there everyone.
[/vc_column_text][/vc_column][/vc_row]
[vc_row][vc_column][vc_separator border_width=”5″][/vc_column][/vc_row]
[vc_row][vc_column][vc_column_text]
EURUSD
[/vc_column_text][/vc_column][/vc_row]
[vc_row][vc_column][vc_separator border_width=”5″][/vc_column][/vc_row][vc_row][vc_column width=”2/3″][vc_custom_heading text=”1 hr” use_theme_fonts=”yes”][vc_column_text]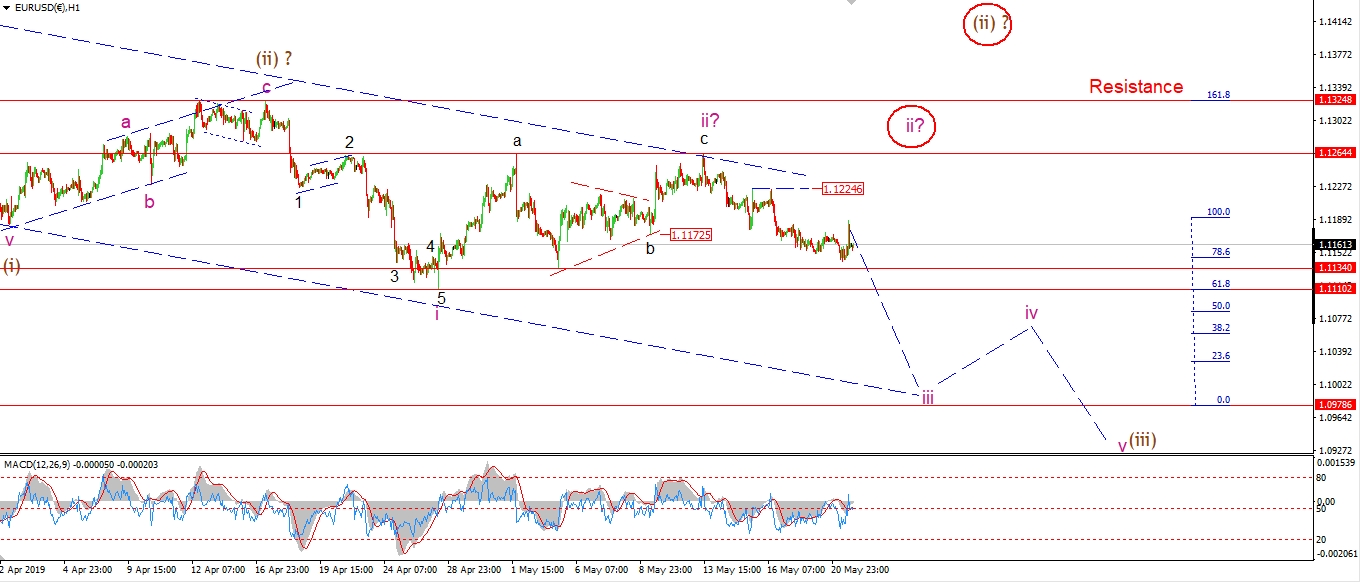 [/vc_column_text][/vc_column][vc_column width=”1/3″][vc_custom_heading text=”4 Hours” use_theme_fonts=”yes”][vc_column_text]
 [/vc_column_text][vc_custom_heading text=”Daily” use_theme_fonts=”yes”][vc_column_text]
 [/vc_column_text][/vc_column][/vc_row]
[vc_row][vc_column][vc_column_text]
Another day without breaking support at 1.1110 and accelerating down into a third.
There was a small spike higher this afternoon,
the market has sold off again this evening
which probably negates this move as the beginning of a larger rally.
But the fact is,
that both alternate counts are still viable at this point.
Only an acceleration below 1.1110 will rule out these alternate counts.
Tomorrow;
Watch for a break of 1.1110 to confirm wave ‘iii’ down with an initial target at about 1.1000.
1.12254 must hold.
[/vc_column_text][/vc_column][/vc_row]
[vc_row][vc_column][vc_separator border_width=”5″][/vc_column][/vc_row][vc_row][vc_column][vc_column_text]
GBPUSD
[/vc_column_text][/vc_column][/vc_row][vc_row][vc_column][vc_separator border_width=”5″][/vc_column][/vc_row][vc_row][vc_column width=”2/3″][vc_custom_heading text=”1 hr” use_theme_fonts=”yes”][vc_column_text]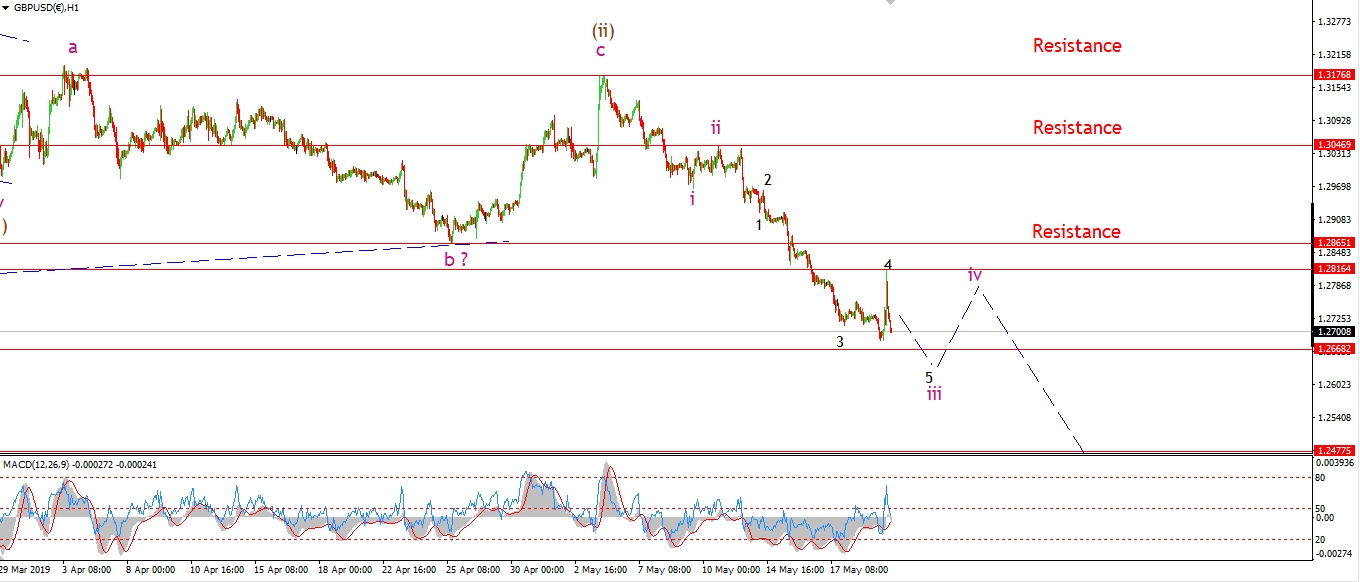 [/vc_column_text][/vc_column][vc_column width=”1/3″][vc_custom_heading text=”4 Hours” use_theme_fonts=”yes”][vc_column_text]
 [/vc_column_text][vc_custom_heading text=”Daily” use_theme_fonts=”yes”][vc_column_text]
 [/vc_column_text][/vc_column][/vc_row]
[vc_row][vc_column][vc_column_text]
Cable first dropped off Mondays high in three waves,
And then came a large spike higher which reached 1.2816,
but almost immediately sold off again this evening.
The price is now back near the lows of the session again.
I have labelled this action as an expanded flat correction within wave ‘4’ of ‘iii’.
Wave ‘5’ should push lower to create a new low at about 1.2650
before the larger wave ‘iv’ correction gets underway.
Tomorrow;
Wave ‘iii’ of (iii) is now nearing completion and wave ‘iv’ will likely begin before the end of the week.
Watch for a low in the area of 1.2650 in wave ‘5’ of ‘iii’.
[/vc_column_text][/vc_column][/vc_row]
[vc_row][vc_column][vc_separator border_width=”5″][/vc_column][/vc_row][vc_row][vc_column][vc_column_text]
USDJPY
[/vc_column_text][/vc_column][/vc_row][vc_row][vc_column][vc_separator border_width=”5″][/vc_column][/vc_row][vc_row][vc_column width=”2/3″][vc_custom_heading text=”1 hr” use_theme_fonts=”yes”][vc_column_text]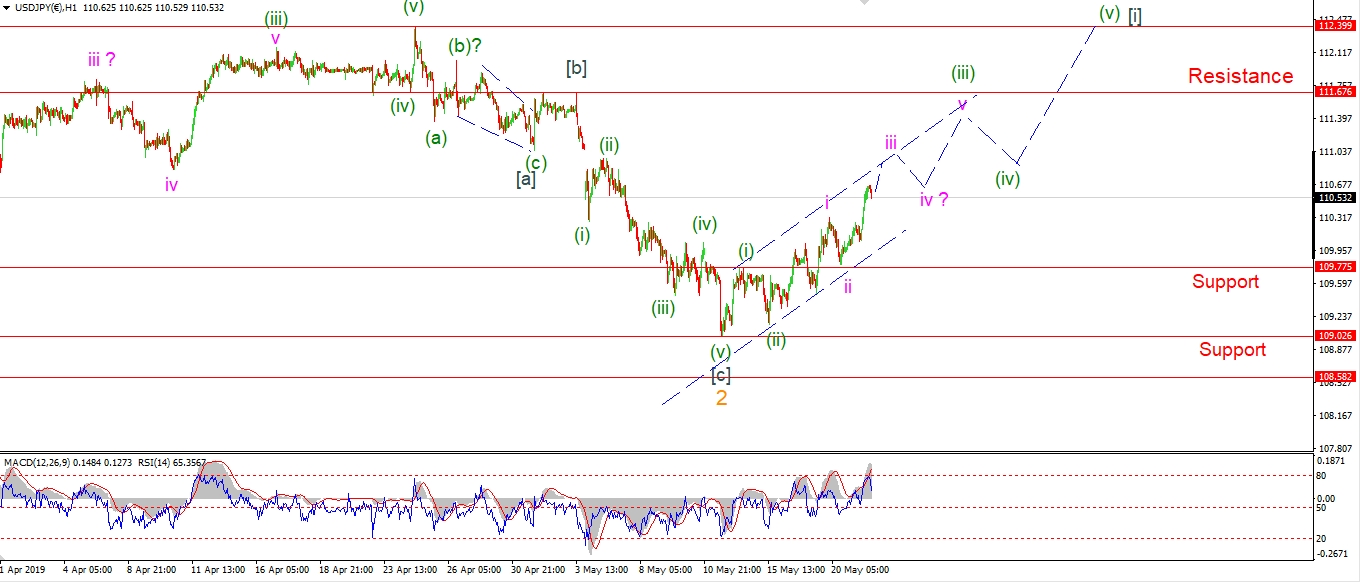 [/vc_column_text][/vc_column][vc_column width=”1/3″][vc_custom_heading text=”4 Hours” use_theme_fonts=”yes”][vc_column_text]
 [/vc_column_text][vc_custom_heading text=”Daily” use_theme_fonts=”yes”][vc_column_text]
 [/vc_column_text][/vc_column][/vc_row]
[vc_row][vc_column][vc_column_text]
USDJPY pushed higher again today in a possible wave ‘iii’ of (iii) as shown.
It looks like wave ‘iii’ is extending higher now,
and should break out above 111.00 before completing.
The high of wave (i) at 109.77,
should now act as support in this ongoing rally.
Tomorrow;
Watch for wave ‘iii’ of (iii) to continue higher and break above the rising trend channel line to complete.
[/vc_column_text][/vc_column][/vc_row]
[vc_row][vc_column][vc_separator border_width=”5″][/vc_column][/vc_row][vc_row][vc_column][vc_column_text]
DOW JONES INDUSTRIALS
[/vc_column_text][/vc_column][/vc_row][vc_row][vc_column][vc_separator border_width=”5″][/vc_column][/vc_row][vc_row][vc_column width=”2/3″][vc_custom_heading text=”1 hr” use_theme_fonts=”yes”][vc_column_text]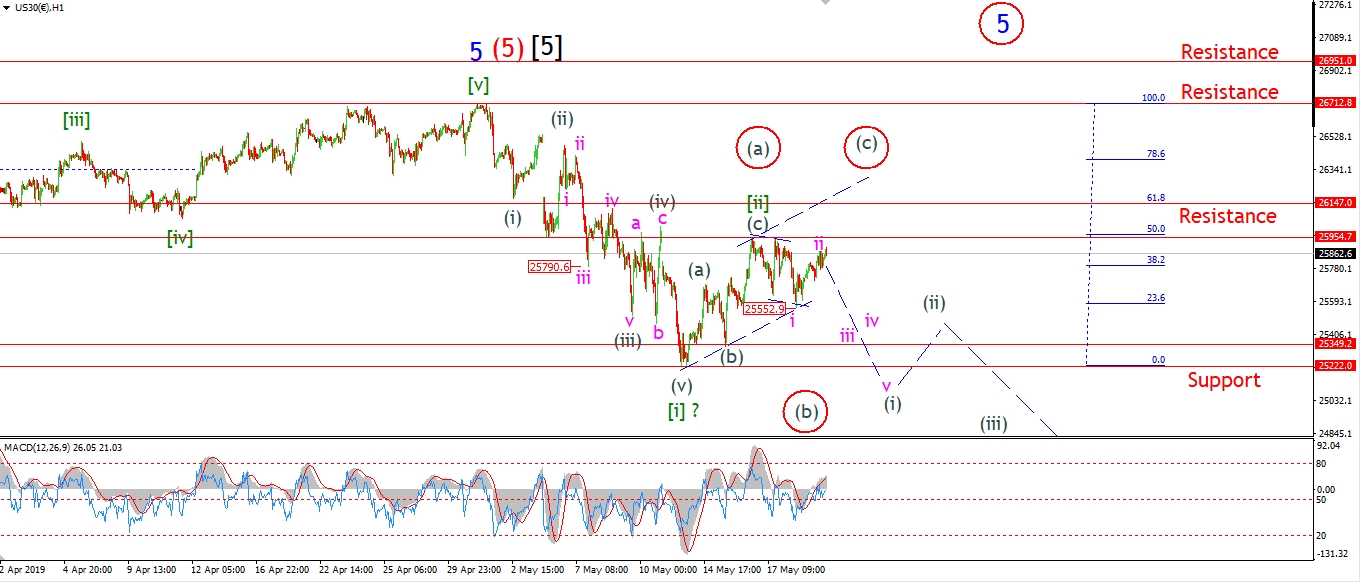 [/vc_column_text][/vc_column][vc_column width=”1/3″][vc_custom_heading text=”4 Hours” use_theme_fonts=”yes”][vc_column_text]
 [/vc_column_text][vc_custom_heading text=”Daily” use_theme_fonts=”yes”][vc_column_text]
 [/vc_column_text][/vc_column][/vc_row]
[vc_row][vc_column][vc_column_text]
The wave count is in flux this evening after a rally today.
Todays rally in the DOW has raised the probability of that alternate count for wave [ii] green.
The price rose towards the initial resistance level at 25954,
The high of the session reached 25886 so far.
A break of the wave [ii] high at 25954
will trigger the larger wave [ii] scenario.
And then we can expect a rally into the 62% retracement level again at 26147 in wave (c) of [ii].
Tomorrow;
Watch for 25954 to hold.
If we see further selling tomorrow to break 25552 again,
that will most likely rule out the alternate count.
While a break of 25222 will confirm that wave [iii] has begun.
[/vc_column_text][/vc_column][/vc_row]
[vc_row][vc_column][vc_separator border_width=”5″][/vc_column][/vc_row][vc_row][vc_column][vc_column_text]
GOLD
[/vc_column_text][/vc_column][/vc_row][vc_row][vc_column][vc_separator border_width=”5″][/vc_column][/vc_row][vc_row][vc_column width=”2/3″][vc_custom_heading text=”1 hr” use_theme_fonts=”yes”][vc_column_text]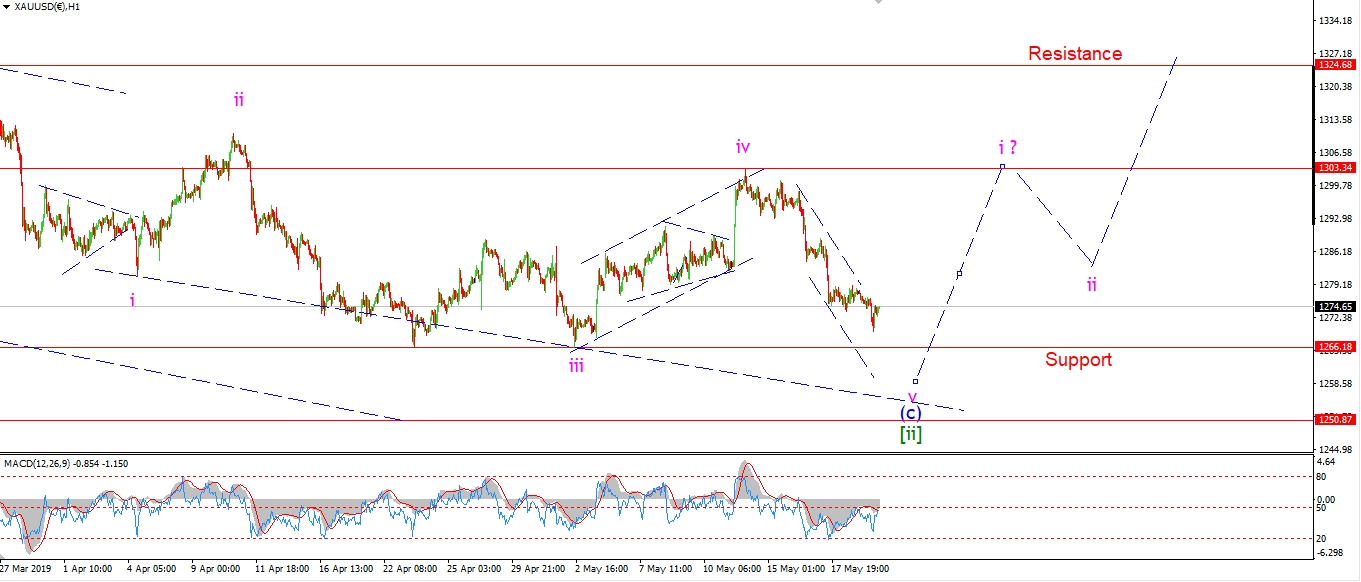 [/vc_column_text][/vc_column][vc_column width=”1/3″][vc_custom_heading text=”4 Hours” use_theme_fonts=”yes”][vc_column_text]
 [/vc_column_text][vc_custom_heading text=”Daily” use_theme_fonts=”yes”][vc_column_text]
 [/vc_column_text][/vc_column][/vc_row]
[vc_row][vc_column][vc_column_text]
I have switched to the alternate count for GOLD today as the selling continues unabated.
The price has not broken support yet at 1266.18,
but a fifth wave should achieve at least that level before turning higher again.
The pattern in wave (c) is still an ending diagonal where wave ‘i’ and wave ‘iv’ overlap.
This recent decline is now labelled as wave ‘v’ of (c).
And I do not expect this decline to last very long.
We should see the initial turn up in wave ‘i’ by the end of trading this week.
Tomorrow;
Watch for initial support to break at 1266 to complete wave ‘v’.
the lower support level at 1250 should be the low end of the range for wave ‘v’.
[/vc_column_text][/vc_column][/vc_row]
[vc_row][vc_column][vc_separator border_width=”5″][/vc_column][/vc_row][vc_row][vc_column][vc_column_text]
U.S CRUDE OIL
[/vc_column_text][/vc_column][/vc_row][vc_row][vc_column][vc_separator border_width=”5″][/vc_column][/vc_row][vc_row][vc_column width=”2/3″][vc_custom_heading text=”1 hr” use_theme_fonts=”yes”][vc_column_text]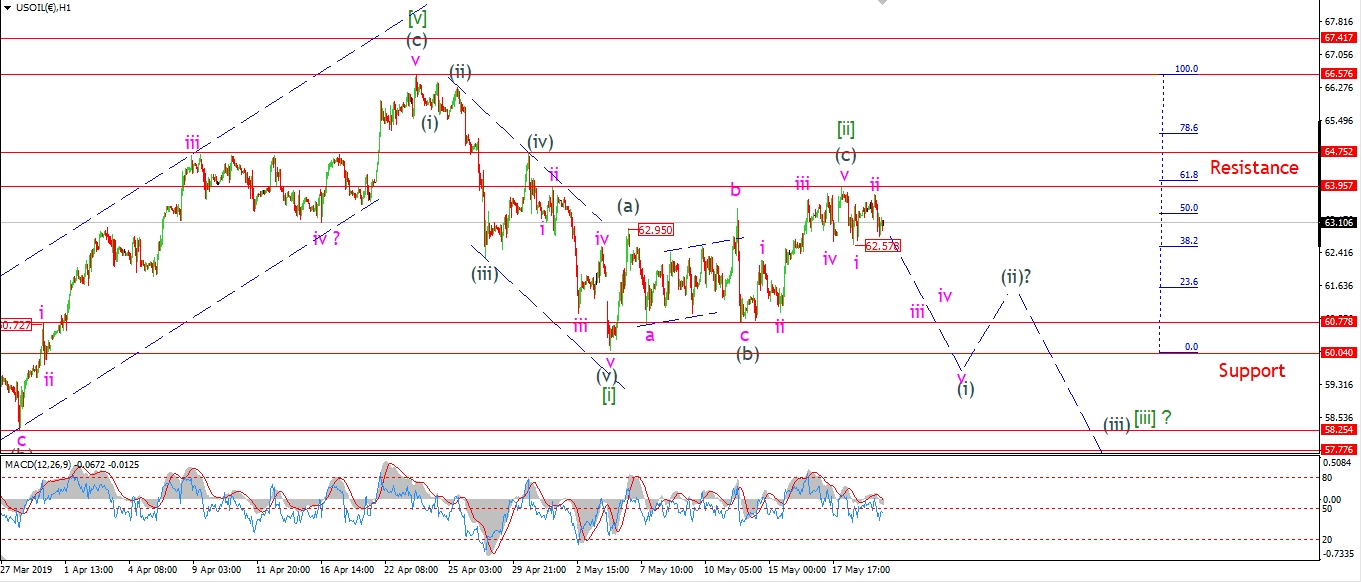 [/vc_column_text][/vc_column][vc_column width=”1/3″][vc_custom_heading text=”4 Hours” use_theme_fonts=”yes”][vc_column_text]
 [/vc_column_text][vc_custom_heading text=”Daily” use_theme_fonts=”yes”][vc_column_text]
 [/vc_column_text][/vc_column][/vc_row]
[vc_row][vc_column][vc_column_text]
Crude is off the highs again today in what may be the beginning of wave ‘iii’ of (i).
The price created a lower high today in a possible wave ‘ii’ of (i) at 62.76.
This level must hold now as wave ‘iii’ down gets underway.
A break of 62.57 again will signal that wave ‘iii’ down has begun.
And the larger wave (i) itself should break below the 60.00 handle again before completing.
Tomorrow;
Watch for 62.76 to hold and wave ‘iii’ to continue lower for the next few sessions.
[/vc_column_text][/vc_column][/vc_row]
[vc_row][vc_column][vc_separator border_width=”5″][/vc_column][/vc_row][vc_row][vc_column][vc_column_text]
US 10 yr Treasuries.
[/vc_column_text][/vc_column][/vc_row][vc_row][vc_column][vc_separator border_width=”5″][/vc_column][/vc_row][vc_row][vc_column width=”2/3″][vc_custom_heading text=”1 hr” use_theme_fonts=”yes”][vc_column_text]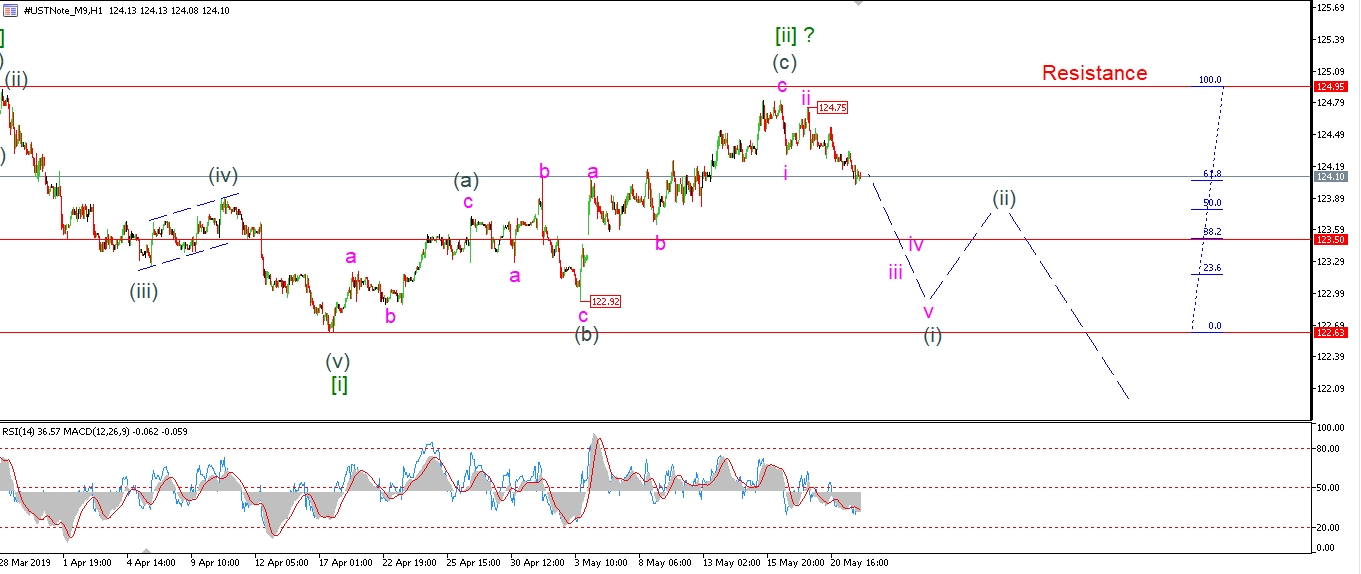 [/vc_column_text][/vc_column][vc_column width=”1/3″][vc_custom_heading text=”4 Hours” use_theme_fonts=”yes”][vc_column_text]
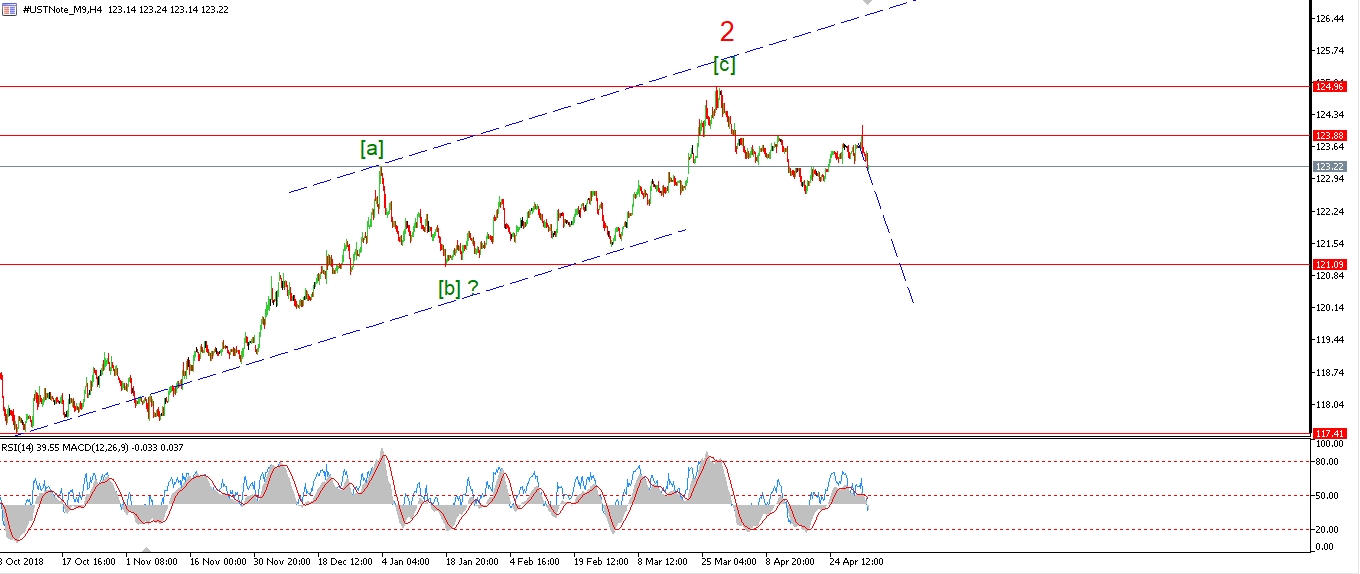 [/vc_column_text][vc_custom_heading text=”Daily” use_theme_fonts=”yes”][vc_column_text]
 [/vc_column_text][/vc_column][/vc_row]
[vc_row][vc_column][vc_column_text]
I have labelled the recent declines as a developing five wave structure in wave (i) grey.
Wave ‘i’ and ‘ii’ are complete,
and wave ‘iii’ down is now subdividing lower.
this should develop further to trace out a five wave decline within wave ‘iii’ itself.
Tomorrow;
Watch for wave ‘iii’ of (i) to continue lower and push below 123.50 again.
[/vc_column_text][/vc_column][/vc_row]
[vc_row][vc_column][vc_separator border_width=”5″][/vc_column][/vc_row][vc_row][vc_column][vc_column_text]
SILVER
[/vc_column_text][/vc_column][/vc_row][vc_row][vc_column][vc_separator border_width=”5″][/vc_column][/vc_row][vc_row][vc_column width=”2/3″][vc_custom_heading text=”1 hr” use_theme_fonts=”yes”][vc_column_text]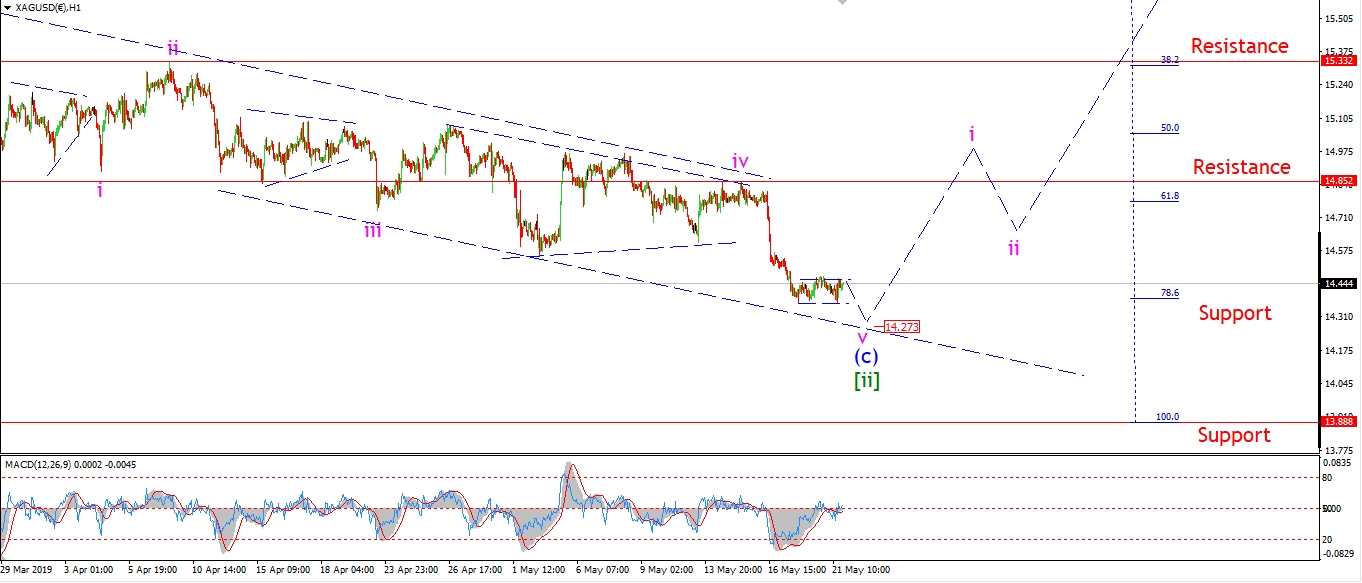 [/vc_column_text][/vc_column][vc_column width=”1/3″][vc_custom_heading text=”4 Hours” use_theme_fonts=”yes”][vc_column_text]
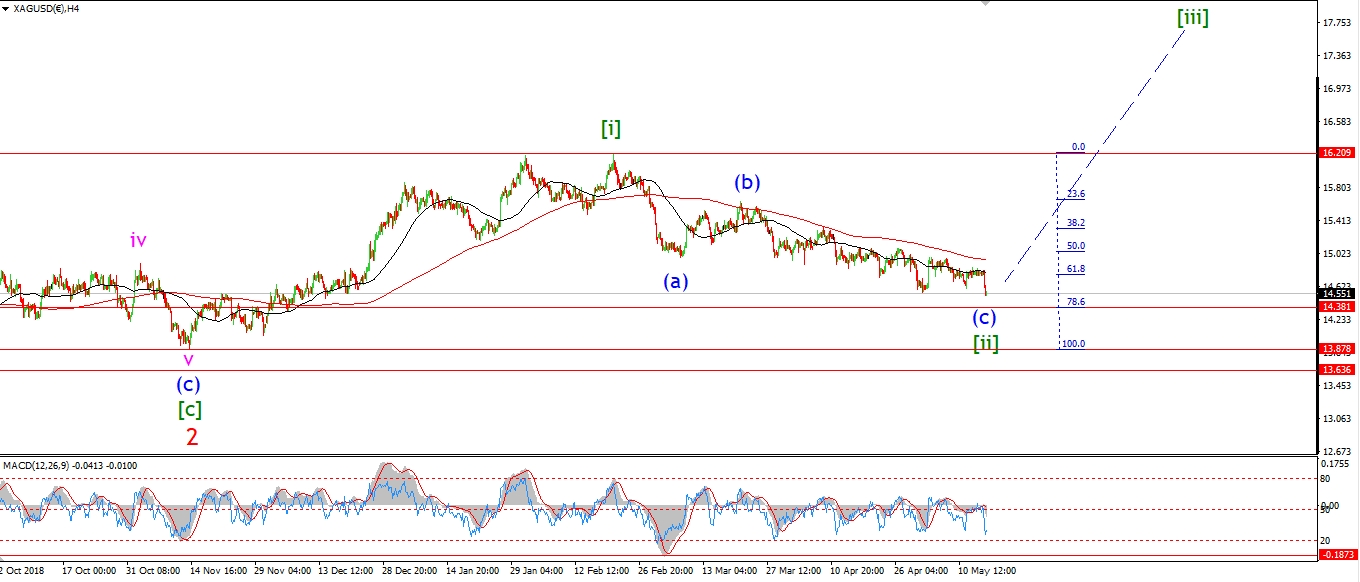 [/vc_column_text][vc_custom_heading text=”Daily” use_theme_fonts=”yes”][vc_column_text]
 [/vc_column_text][/vc_column][/vc_row]
[vc_row][vc_column][vc_column_text]
It looks like silver will complete this decline in wave ‘v’ at the lower trend channel line again over the coming days.
The action over the last few sessions is a small flat correction within wave ‘v’.
this suggests wave ‘v’ will make a new low at about 14.27 again to complete a five wave internal pattern.
And then we can begin to look higher again in wave ‘i’ of (i).
Tomorrow;
Watch for this decline in wave ‘v’ to close out with a small drop into 14.27.
[/vc_column_text][/vc_column][/vc_row]
[vc_row][vc_column][vc_separator border_width=”5″][/vc_column][/vc_row][vc_row][vc_column][vc_column_text]
S&P 500.
[/vc_column_text][/vc_column][/vc_row][vc_row][vc_column][vc_separator border_width=”5″][/vc_column][/vc_row][vc_row][vc_column width=”2/3″][vc_custom_heading text=”1 hr” use_theme_fonts=”yes”][vc_column_text]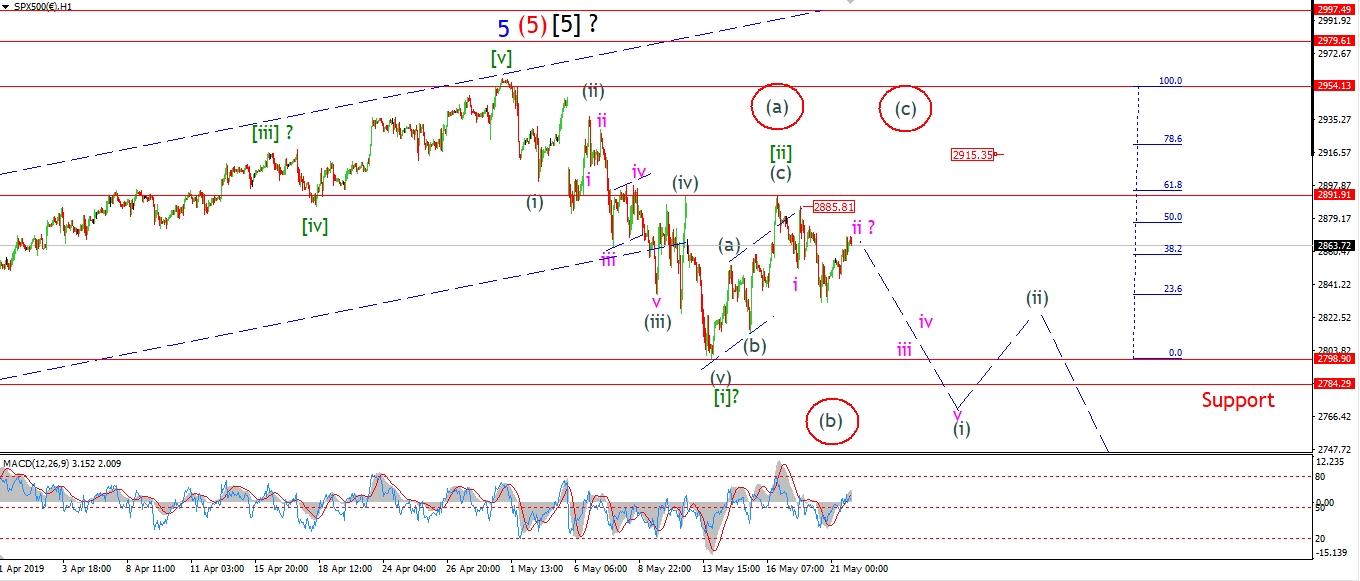 [/vc_column_text][/vc_column][vc_column width=”1/3″][vc_custom_heading text=”4 Hours” use_theme_fonts=”yes”][vc_column_text]
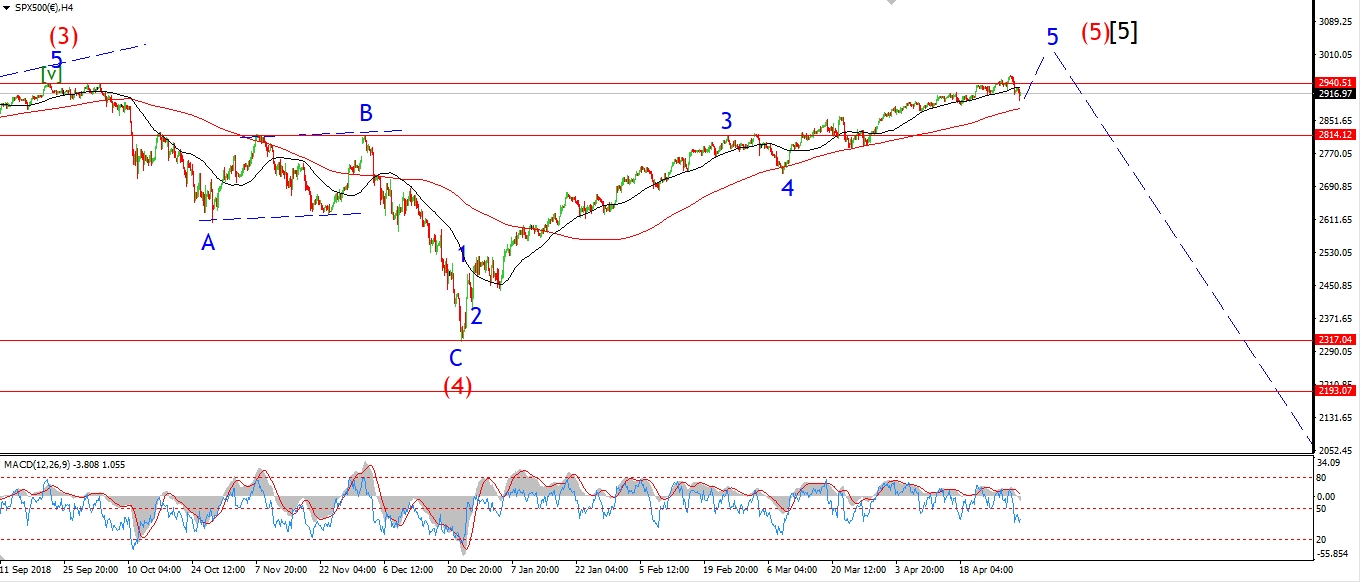 [/vc_column_text][vc_custom_heading text=”Daily” use_theme_fonts=”yes”][vc_column_text]
 [/vc_column_text][/vc_column][/vc_row]
[vc_row][vc_column][vc_column_text]
The S&P rallied also today although it looks more like a corrective rise at this point.
There is a good chance that this rally is part of a running flat wave ‘ii’ pink.
With wave ‘iii’ of (i) now set to carry price lower again.
A break of the low at 2830 again will confirm wave ‘iii’ of (i) is in force.
The high at 2885 must hold for this interpretation to remain valid.
Tomorrow;
watch for Wave ‘ii’ to complete another lower high below 2885,
and then turn lower again in wave ‘iii’ of (i).
[/vc_column_text][/vc_column][/vc_row]
[vc_row][vc_column][vc_column_text]
[/vc_column_text][/vc_column][/vc_row]
[vc_row][vc_column][vc_separator border_width=”5″][/vc_column][/vc_row]