
[vc_row][vc_column][vc_separator border_width=”5″][/vc_column][/vc_row]
[vc_row][vc_column][vc_column_text]
Hello everyone, I hope the weekend went well for you.
We begin a new week,
and boy this one has some real potential to kick of a large decline across a few different markets!
So here we go, down to business.
[/vc_column_text][/vc_column][/vc_row]
[vc_row][vc_column][vc_separator border_width=”5″][/vc_column][/vc_row]
[vc_row][vc_column][vc_column_text]
EURUSD
[/vc_column_text][/vc_column][/vc_row]
[vc_row][vc_column][vc_separator border_width=”5″][/vc_column][/vc_row][vc_row][vc_column width=”2/3″][vc_custom_heading text=”1 hr” use_theme_fonts=”yes”][vc_column_text]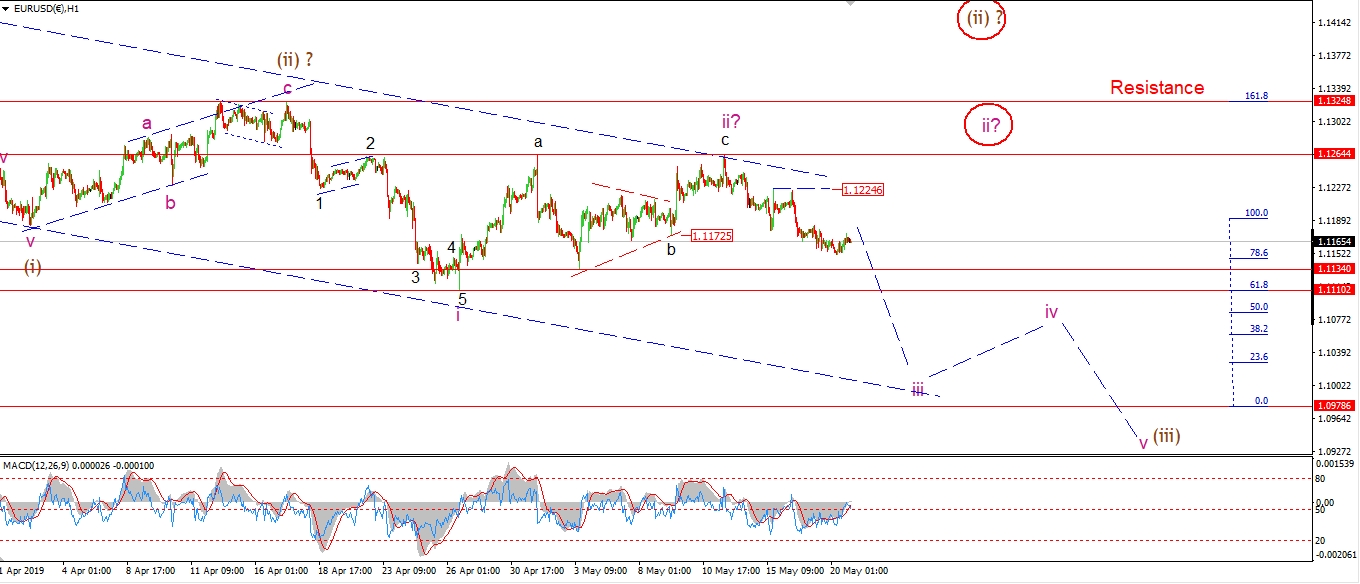 [/vc_column_text][/vc_column][vc_column width=”1/3″][vc_custom_heading text=”4 Hours” use_theme_fonts=”yes”][vc_column_text]
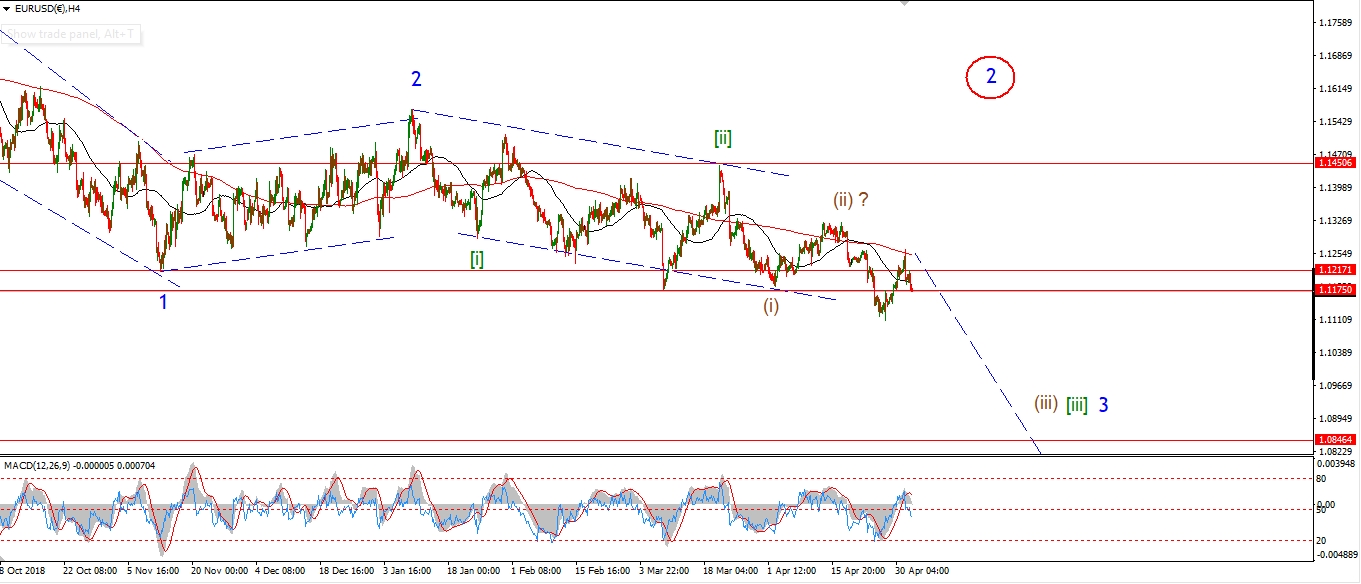 [/vc_column_text][vc_custom_heading text=”Daily” use_theme_fonts=”yes”][vc_column_text]
 [/vc_column_text][/vc_column][/vc_row]
[vc_row][vc_column][vc_column_text]
The action in EURUSD today has flattened out considerably.
This is viewed as a short term correction within wave ‘iii’ down.
A break of the lower support at 1.1110 should coincide with an acceleration lower in wave ‘iii’.
And wave ‘iii’ itself should target the lower trendline of the channel at about 1.1000 at a minimum.
1.1224 should hold as wave ‘iii’ develops,
but the price must not break above 1.1264 as that would invalidate the short term count.
Tomorrow;
Watch for a break of initial support at 1.1134 in wave ‘iii’ down.
[/vc_column_text][/vc_column][/vc_row]
[vc_row][vc_column][vc_separator border_width=”5″][/vc_column][/vc_row][vc_row][vc_column][vc_column_text]
GBPUSD
[/vc_column_text][/vc_column][/vc_row][vc_row][vc_column][vc_separator border_width=”5″][/vc_column][/vc_row][vc_row][vc_column width=”2/3″][vc_custom_heading text=”1 hr” use_theme_fonts=”yes”][vc_column_text]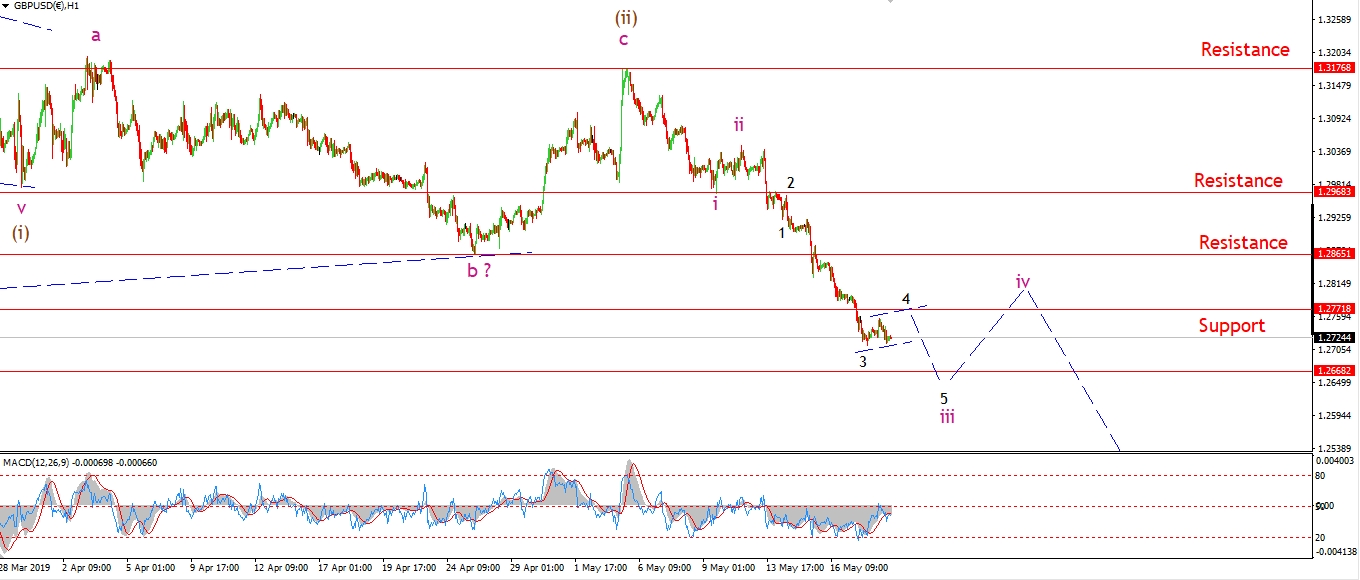 [/vc_column_text][/vc_column][vc_column width=”1/3″][vc_custom_heading text=”4 Hours” use_theme_fonts=”yes”][vc_column_text]
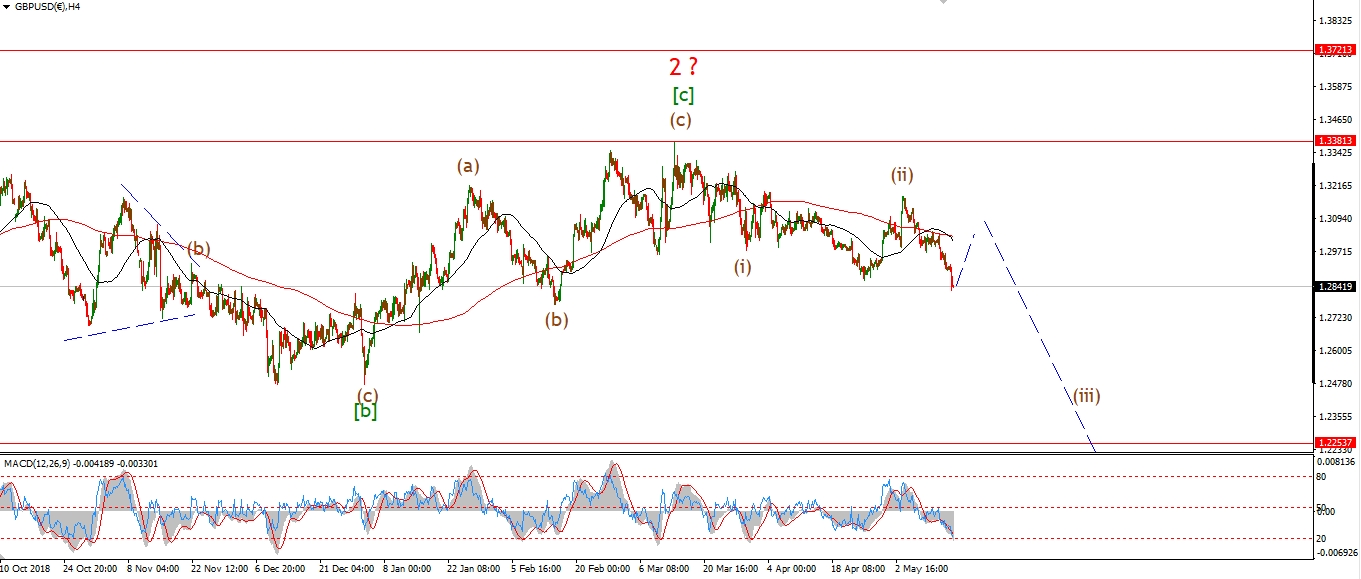 [/vc_column_text][vc_custom_heading text=”Daily” use_theme_fonts=”yes”][vc_column_text]
 [/vc_column_text][/vc_column][/vc_row]
[vc_row][vc_column][vc_column_text]
Cable is in correction mode also today.
The short term price action seems to be tracing out a three wave flat correction.
I have labelled this as wave ‘4’ of ‘iii’.
And this wave should complete within the small trend channel shown at about 1.2770.
Wave ‘5’ of three is expected to then decline again to complete a five wave structure in wave ‘iii’.
Tomorrow;
Initial resistance lies at the wave (i) low of 1.2865.
Watch for wave ‘4’ of ‘iii’ to complete tomorrow.
[/vc_column_text][/vc_column][/vc_row]
[vc_row][vc_column][vc_separator border_width=”5″][/vc_column][/vc_row][vc_row][vc_column][vc_column_text]
USDJPY
[/vc_column_text][/vc_column][/vc_row][vc_row][vc_column][vc_separator border_width=”5″][/vc_column][/vc_row][vc_row][vc_column width=”2/3″][vc_custom_heading text=”1 hr” use_theme_fonts=”yes”][vc_column_text]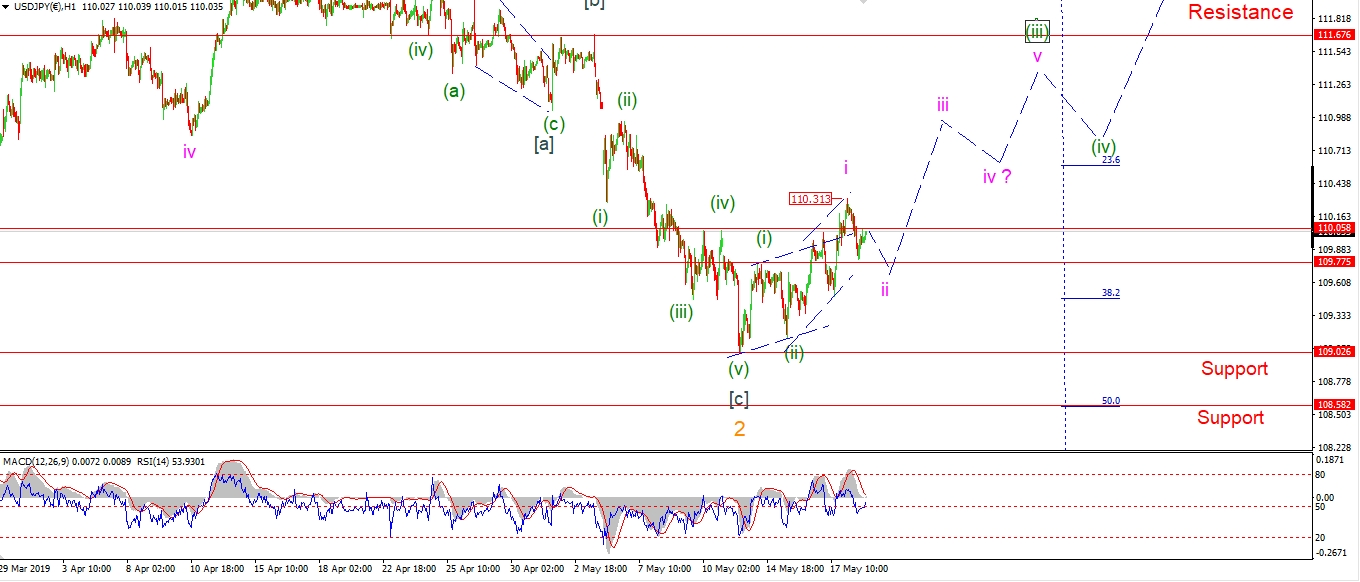 [/vc_column_text][/vc_column][vc_column width=”1/3″][vc_custom_heading text=”4 Hours” use_theme_fonts=”yes”][vc_column_text]
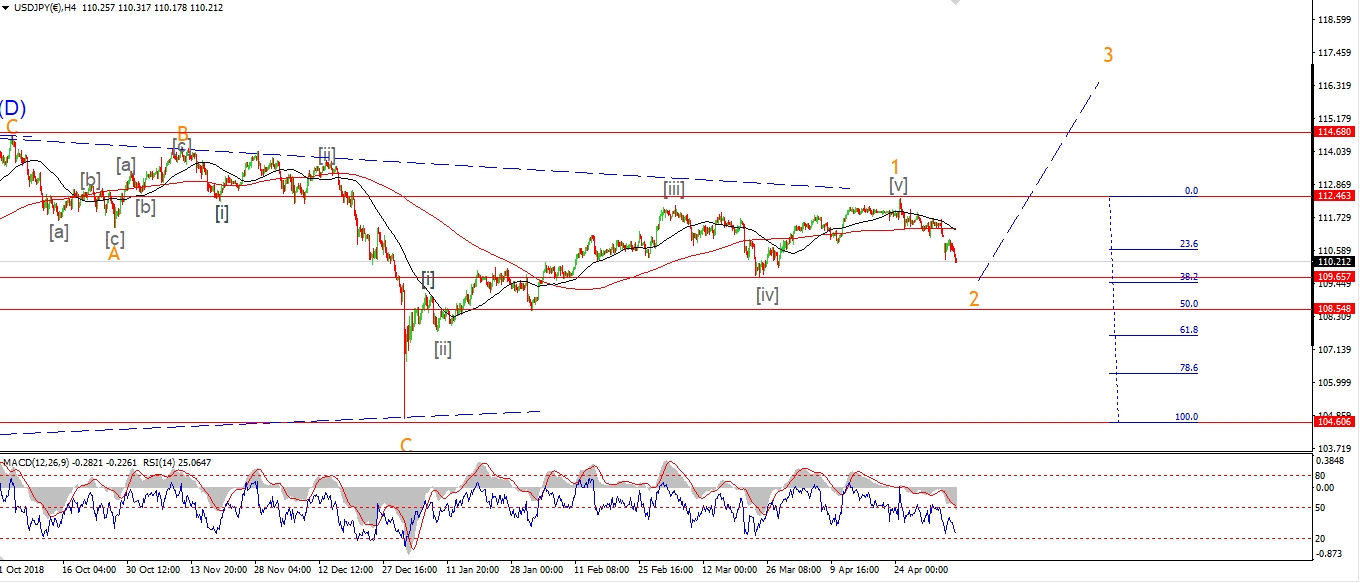 [/vc_column_text][vc_custom_heading text=”Daily” use_theme_fonts=”yes”][vc_column_text]
 [/vc_column_text][/vc_column][/vc_row]
[vc_row][vc_column][vc_column_text]
USDJPY did break above the previous wave (iv) at 110.05 today reaching a high at 110.35.
but again prices have fallen back.
I have shown a variation of Fridays bullish wave count this evening.
This involves a wedge pattern in wave ‘i’ pink.
and now a further decline in wave ‘ii’ pink which should trace out a three wave correction.
I still expect wave ‘iii’ to push towards 111.00 over the coming week.
But It looks like wave ‘ii’ has another drop to go before prices will return higher again.
Tomorrow;
109.77 should again act as support for wave ‘ii’ pink.
Watch for a break above 110.31 in wave ‘iii’.
[/vc_column_text][/vc_column][/vc_row]
[vc_row][vc_column][vc_separator border_width=”5″][/vc_column][/vc_row][vc_row][vc_column][vc_column_text]
DOW JONES INDUSTRIALS
[/vc_column_text][/vc_column][/vc_row][vc_row][vc_column][vc_separator border_width=”5″][/vc_column][/vc_row][vc_row][vc_column width=”2/3″][vc_custom_heading text=”1 hr” use_theme_fonts=”yes”][vc_column_text]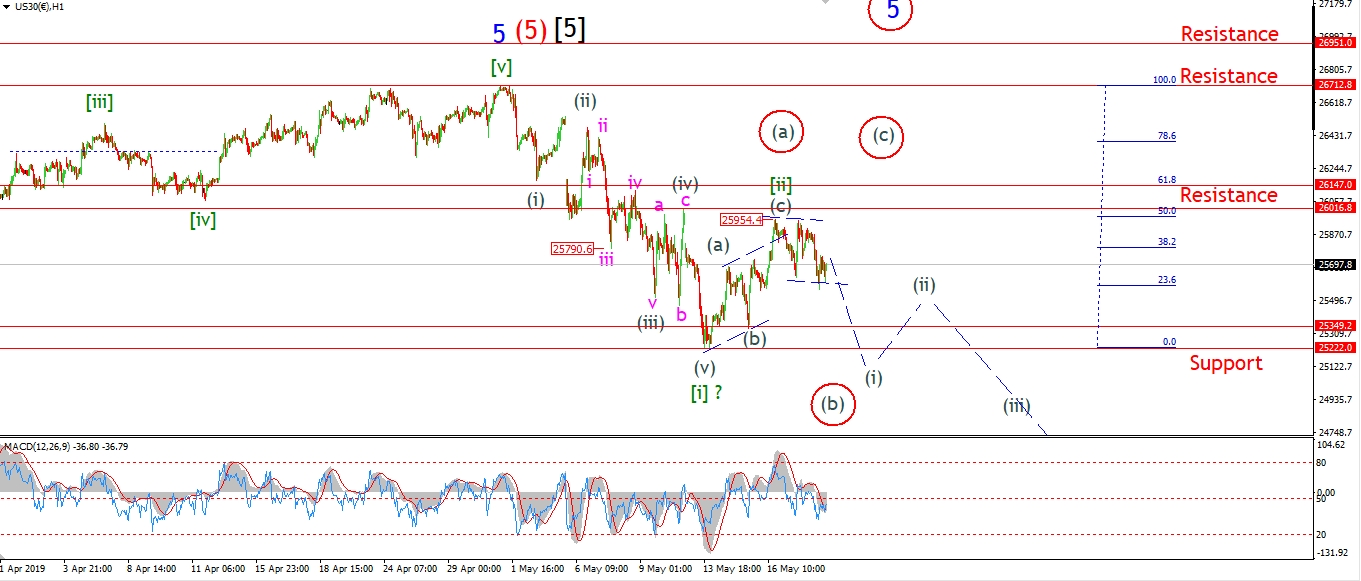 [/vc_column_text][/vc_column][vc_column width=”1/3″][vc_custom_heading text=”4 Hours” use_theme_fonts=”yes”][vc_column_text]
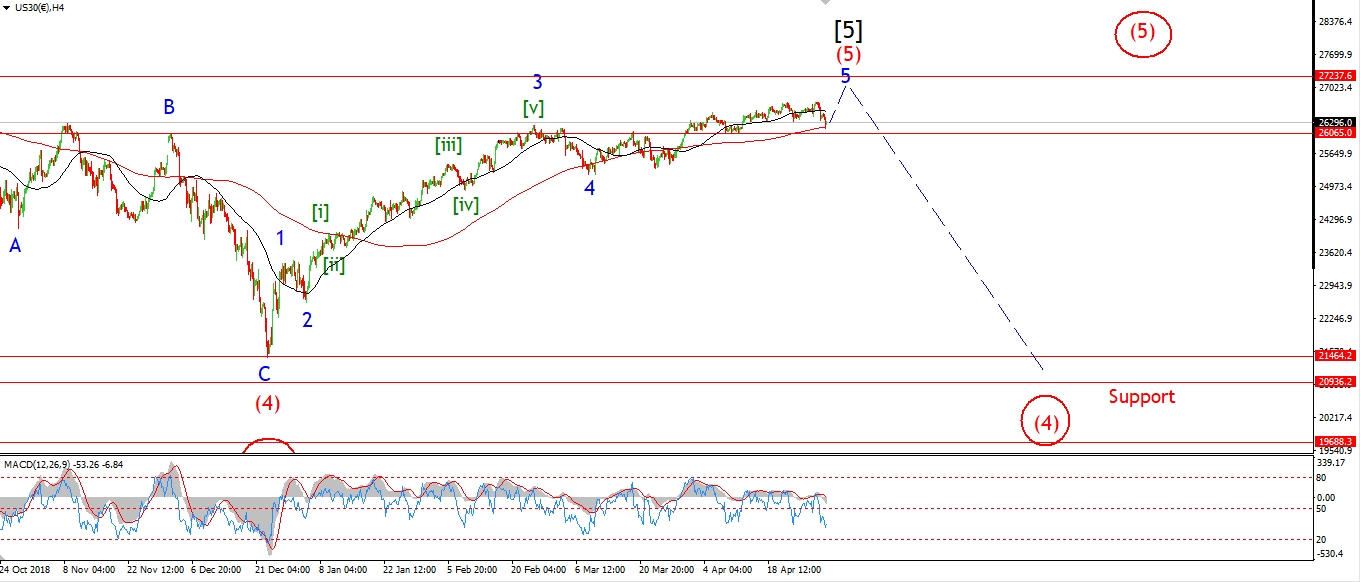 [/vc_column_text][vc_custom_heading text=”Daily” use_theme_fonts=”yes”][vc_column_text]
 [/vc_column_text][/vc_column][/vc_row]
[vc_row][vc_column][vc_column_text]
The DOW dropped off Fridays highs today which suggests that wave (i) of [iii] has begun.
A break of initial support at 25222 will confirm wave (i) of [iii],
and then we can look forward to a significant decline
in wave [iii] over the following weeks.
The price has declined off the wave [ii] high in a three wave pattern.
So we must see further declines in wave (i) over the coming week to create a five wave pattern in order to rule out the alternate count shown.
Both counts call for a decline phase to begin in wave [iii] green.
But the alternate count will allow for a larger three wave pattern to build in wave [ii]
before wave [iii] down begins.
Tomorrow;
Watch for wave (i) to continue lower,
the wave [ii] high at 25954 must hold from here.
[/vc_column_text][/vc_column][/vc_row]
[vc_row][vc_column][vc_separator border_width=”5″][/vc_column][/vc_row][vc_row][vc_column][vc_column_text]
GOLD
[/vc_column_text][/vc_column][/vc_row][vc_row][vc_column][vc_separator border_width=”5″][/vc_column][/vc_row][vc_row][vc_column width=”2/3″][vc_custom_heading text=”1 hr” use_theme_fonts=”yes”][vc_column_text]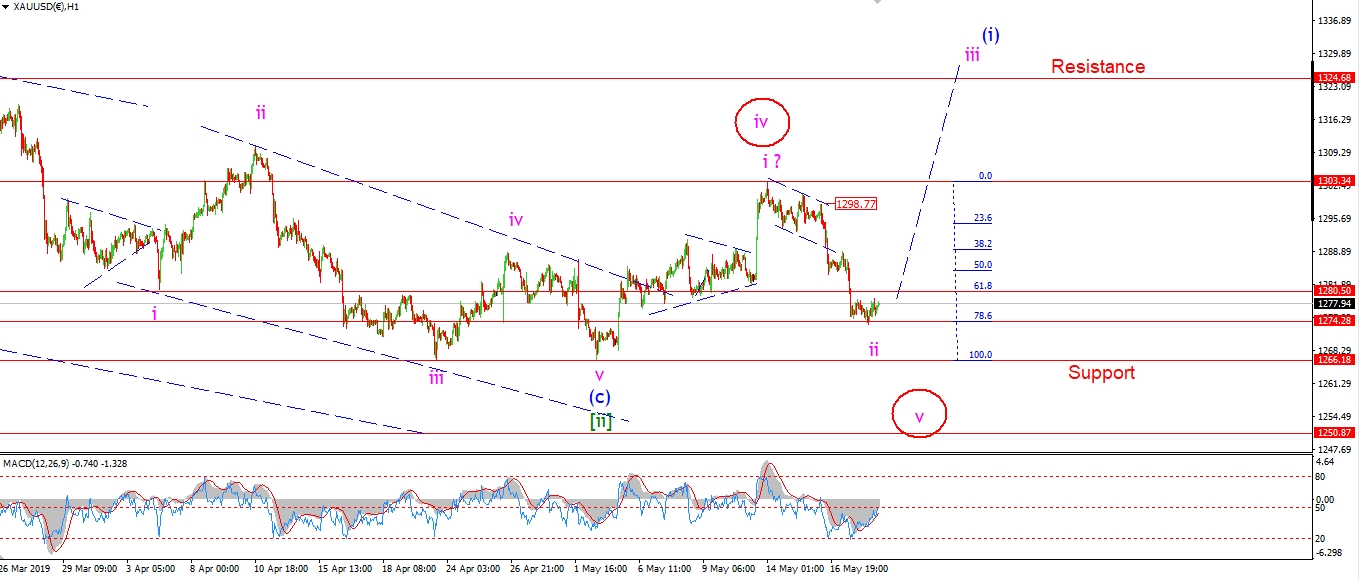 [/vc_column_text][/vc_column][vc_column width=”1/3″][vc_custom_heading text=”4 Hours” use_theme_fonts=”yes”][vc_column_text]
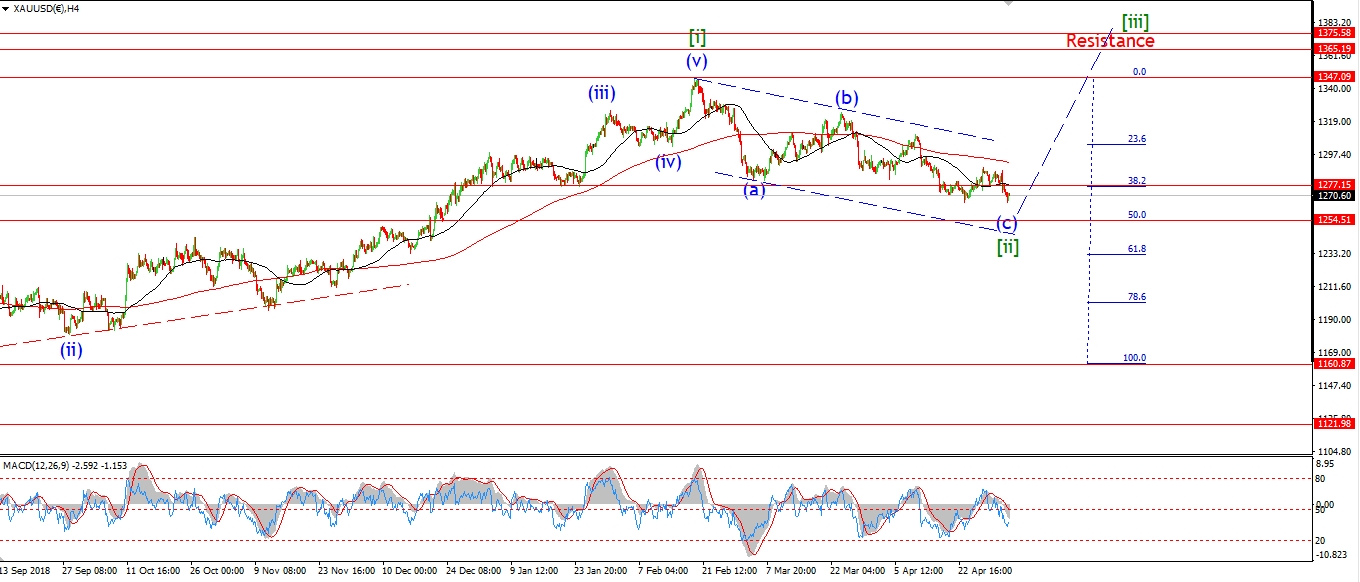 [/vc_column_text][vc_custom_heading text=”Daily” use_theme_fonts=”yes”][vc_column_text]
 [/vc_column_text][/vc_column][/vc_row]
[vc_row][vc_column][vc_column_text]
GOLD is flat today as wave ‘ii’ refuses to let go of the price for the time being.
I am forced to look at the alternate short term count again this evening.
This alternate count views the recent rally as only wave ‘iv’ of (c),
with wave ‘v’ of (c) left to complete the correction.
A rally back above 1300 again will rule out the alternate count.
But that rally will have to come quick!
Tomorrow;
Watch for a sign that wave ‘iii’ of (i) has begun with a push up towards the 1300 handle again.
A break of 1266 will trigger the alternate count.
[/vc_column_text][/vc_column][/vc_row]
[vc_row][vc_column][vc_separator border_width=”5″][/vc_column][/vc_row][vc_row][vc_column][vc_column_text]
U.S CRUDE OIL
[/vc_column_text][/vc_column][/vc_row][vc_row][vc_column][vc_separator border_width=”5″][/vc_column][/vc_row][vc_row][vc_column width=”2/3″][vc_custom_heading text=”1 hr” use_theme_fonts=”yes”][vc_column_text]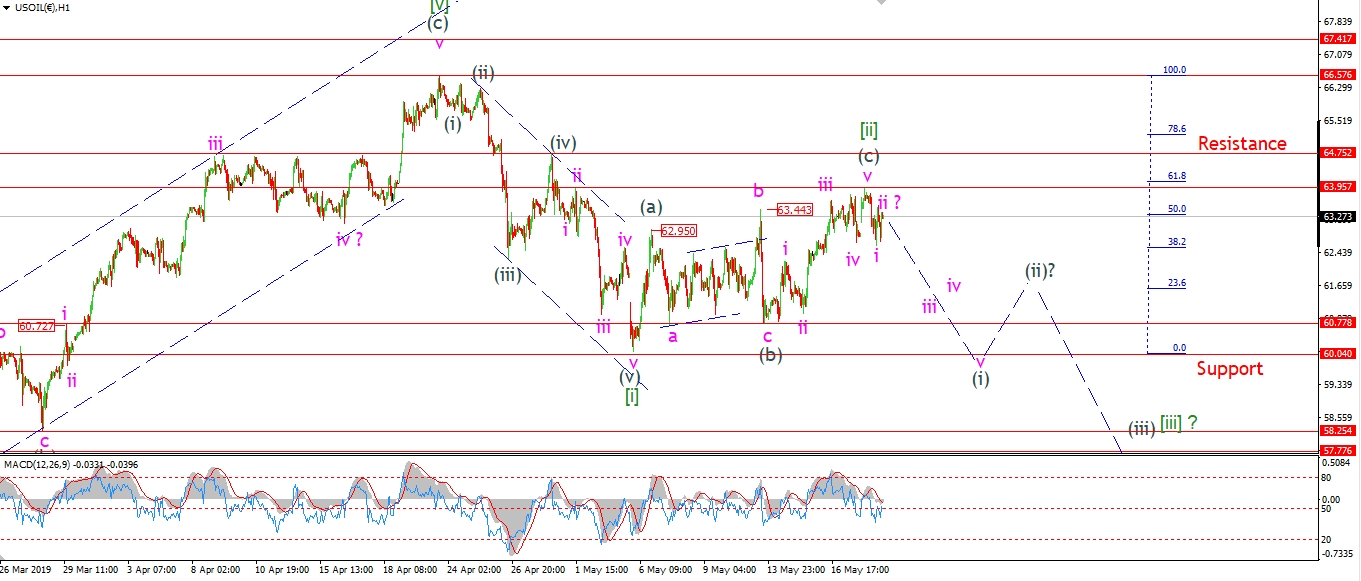 [/vc_column_text][/vc_column][vc_column width=”1/3″][vc_custom_heading text=”4 Hours” use_theme_fonts=”yes”][vc_column_text]
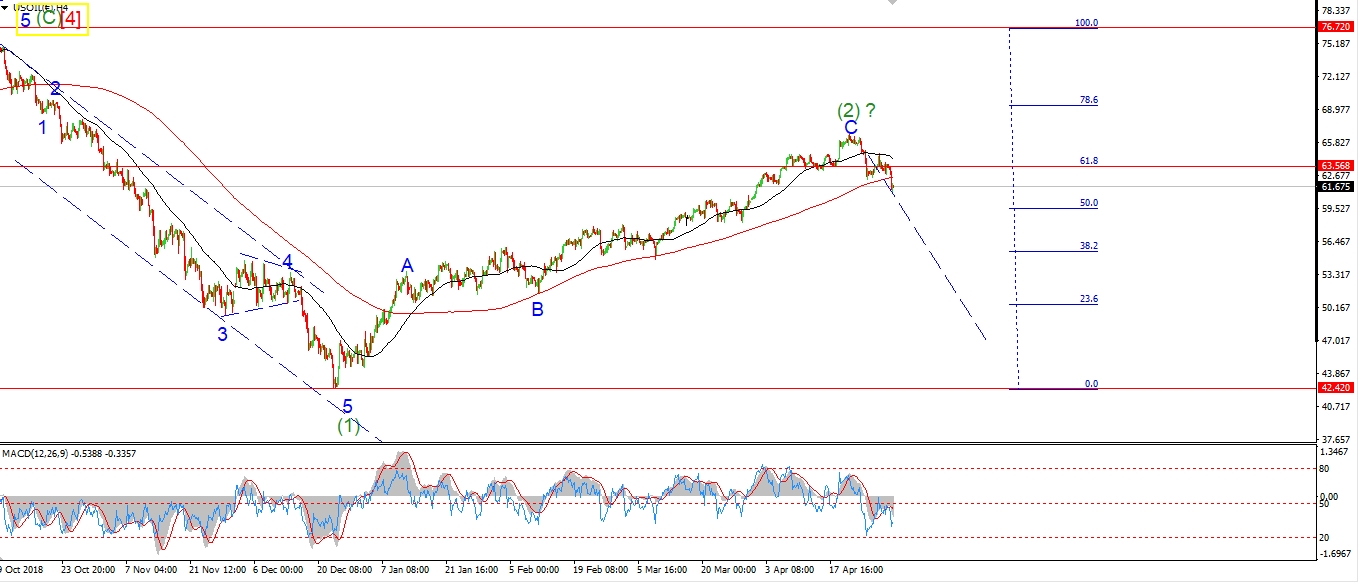 [/vc_column_text][vc_custom_heading text=”Daily” use_theme_fonts=”yes”][vc_column_text]
 [/vc_column_text][/vc_column][/vc_row]
[vc_row][vc_column][vc_column_text]
Crude seems to be tracing out a small head and shoulders pattern over the last few sessions.
This should mark the top of wave [ii] with a lower high again as the right side shoulder.
This will likely complete as wave ‘ii’ pink,
and begin a larger decline in wave (i) grey.
Wave (i) should continue to decline this week.
A break of 60.77 again at wave (b) again will confirm wave (i).
Tomorrow;
Watch for 63.95 to hold at wave [ii] green.
Wave ‘iii’ of (i) should begin by Tuesday evening.
[/vc_column_text][/vc_column][/vc_row]
[vc_row][vc_column][vc_separator border_width=”5″][/vc_column][/vc_row][vc_row][vc_column][vc_column_text]
US 10 yr Treasuries.
[/vc_column_text][/vc_column][/vc_row][vc_row][vc_column][vc_separator border_width=”5″][/vc_column][/vc_row][vc_row][vc_column width=”2/3″][vc_custom_heading text=”1 hr” use_theme_fonts=”yes”][vc_column_text]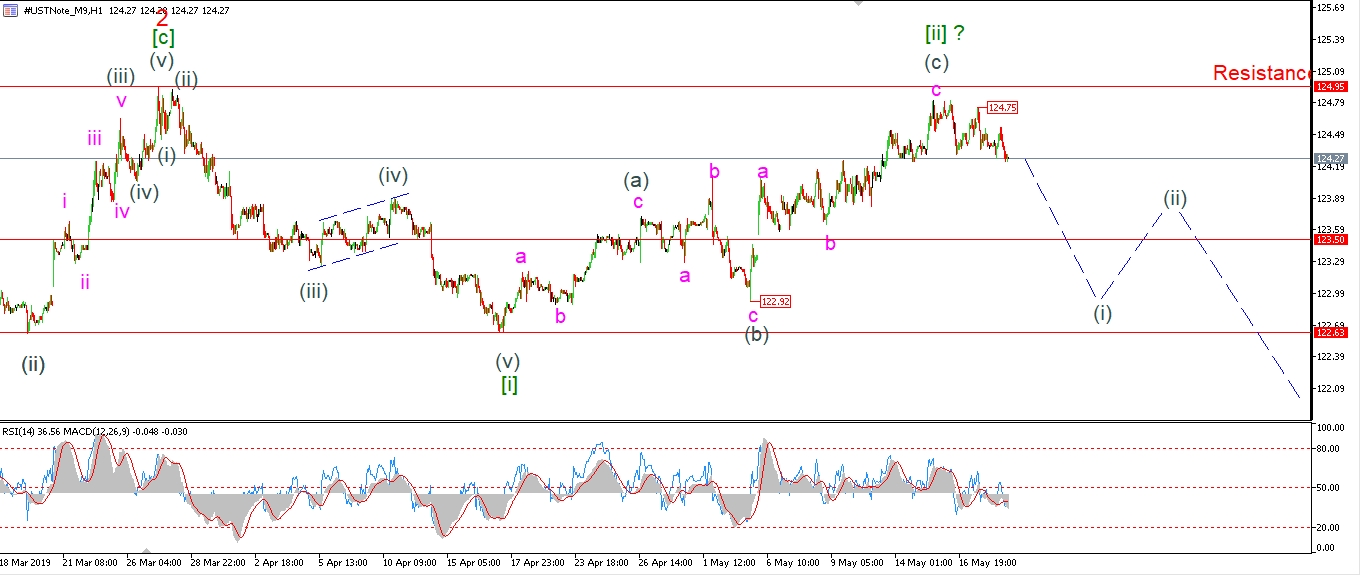 [/vc_column_text][/vc_column][vc_column width=”1/3″][vc_custom_heading text=”4 Hours” use_theme_fonts=”yes”][vc_column_text]
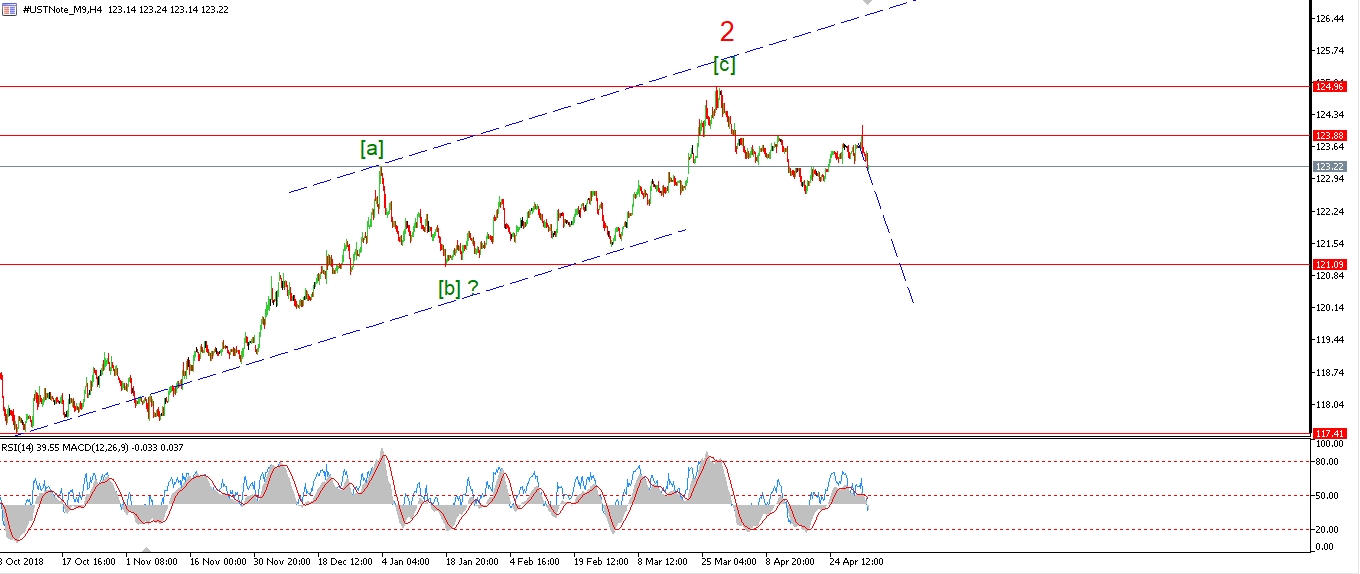 [/vc_column_text][vc_custom_heading text=”Daily” use_theme_fonts=”yes”][vc_column_text]
 [/vc_column_text][/vc_column][/vc_row]
[vc_row][vc_column][vc_column_text]
The 10YR is down again today and pushing lower
into what should be wave (i) of [iii] beginning this week.
It is early days in this decline phase,
so I have not labelled this decline just yet.
But if we see a drop below that 123.50 level again,
where a gap higher happened to begin wave (c) up,
that should signal the turn is in for the 10YR.
Tomorrow;
Watch for wave (i) down to continue lower tomorrow.
Fridays high at 124.75 should hold.
[/vc_column_text][/vc_column][/vc_row]
[vc_row][vc_column][vc_separator border_width=”5″][/vc_column][/vc_row][vc_row][vc_column][vc_column_text]
SILVER
[/vc_column_text][/vc_column][/vc_row][vc_row][vc_column][vc_separator border_width=”5″][/vc_column][/vc_row][vc_row][vc_column width=”2/3″][vc_custom_heading text=”1 hr” use_theme_fonts=”yes”][vc_column_text] [/vc_column_text][/vc_column][vc_column width=”1/3″][vc_custom_heading text=”4 Hours” use_theme_fonts=”yes”][vc_column_text]
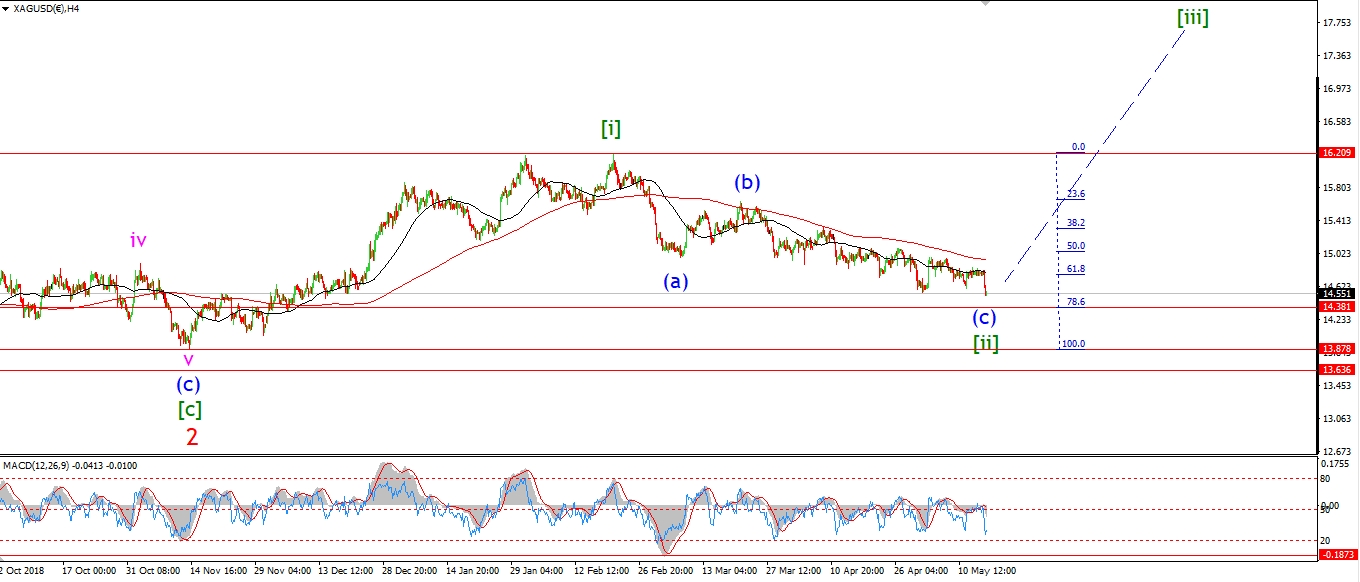 [/vc_column_text][vc_custom_heading text=”Daily” use_theme_fonts=”yes”][vc_column_text]
 [/vc_column_text][/vc_column][/vc_row]
[vc_row][vc_column][vc_column_text]
This weeks trading should see an end to the endless corrective action in the metals!
Both the depressed momentum setup,
and the depressed market sentiment,
are enough to create the perfect environment for a large scale reversal on their own.
Couple this with the clear three wave pattern off the late February highs.
And a 78.6% retracement into this low,
then we have a completed picture in place to retrace above the 16.20 high at the very least.
All we need is a bullish higher low in waves ‘i’ and ‘ii’ to point the way from here.
Tomorrow;
watch for wave ‘v’ of (v) to put in a final low in the next couple of days.
I want to see that rally in wave ‘i’ begin this week.
[/vc_column_text][/vc_column][/vc_row]
[vc_row][vc_column][vc_separator border_width=”5″][/vc_column][/vc_row][vc_row][vc_column][vc_column_text]
S&P 500.
[/vc_column_text][/vc_column][/vc_row][vc_row][vc_column][vc_separator border_width=”5″][/vc_column][/vc_row][vc_row][vc_column width=”2/3″][vc_custom_heading text=”1 hr” use_theme_fonts=”yes”][vc_column_text]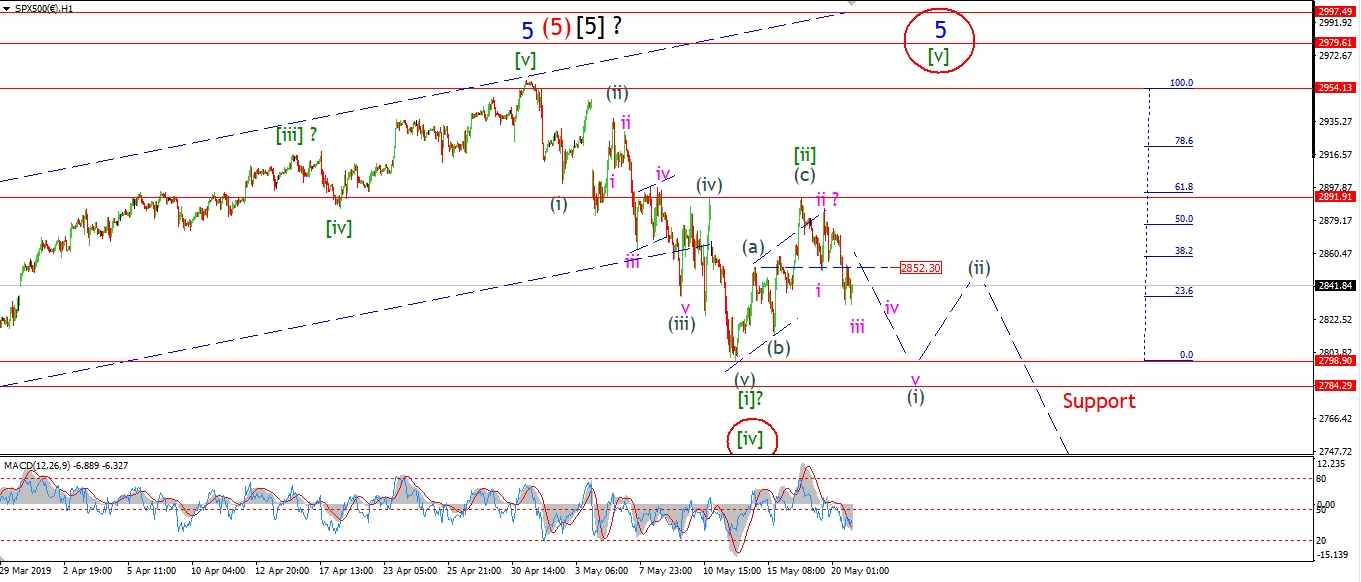 [/vc_column_text][/vc_column][vc_column width=”1/3″][vc_custom_heading text=”4 Hours” use_theme_fonts=”yes”][vc_column_text]
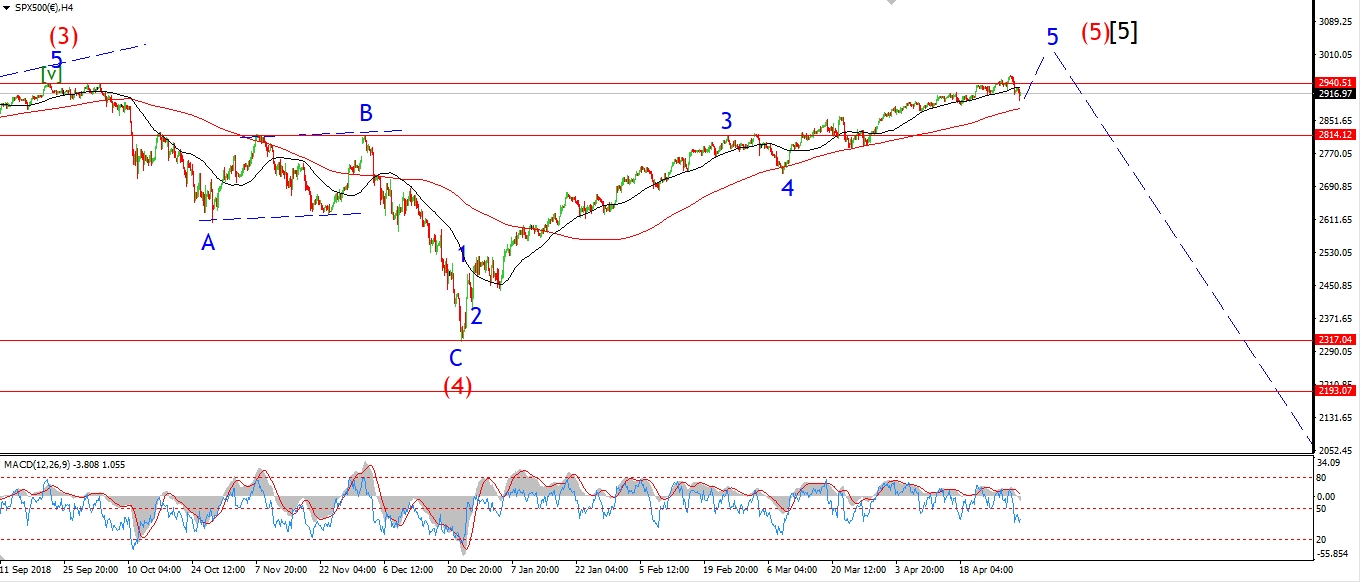 [/vc_column_text][vc_custom_heading text=”Daily” use_theme_fonts=”yes”][vc_column_text]
 [/vc_column_text][/vc_column][/vc_row]
[vc_row][vc_column][vc_column_text]
The S&P is down again today and has broken below the previous wave (a) high at 2852.
This action is a signal that wave (i) of [iii] has begun.
And todays decline is viewed as wave ‘iii’ of a small five wave pattern in wave (i) grey as shown.
If the short term count is correct,
then this week will be another bad week for stocks.
And the recent low at wave [i] will break as wave (i) of [iii] completes.
If we do break below 2798 again,
That should be enough to confirm wave [iii] green has begun.
Tomorrow;
Watch for wave ‘iii’ of (i) to continue lower and hold below 2852.
2891 must not break from here.
[/vc_column_text][/vc_column][/vc_row]
[vc_row][vc_column][vc_column_text]
[/vc_column_text][/vc_column][/vc_row]
[vc_row][vc_column][vc_separator border_width=”5″][/vc_column][/vc_row]