
[vc_row][vc_column][vc_separator border_width=”5″][/vc_column][/vc_row]
[vc_row][vc_column][vc_column_text]
Hello everyone.
[/vc_column_text][/vc_column][/vc_row]
[vc_row][vc_column][vc_separator border_width=”5″][/vc_column][/vc_row]
[vc_row][vc_column][vc_column_text]
EURUSD
[/vc_column_text][/vc_column][/vc_row]
[vc_row][vc_column][vc_separator border_width=”5″][/vc_column][/vc_row][vc_row][vc_column width=”2/3″][vc_custom_heading text=”1 hr” use_theme_fonts=”yes”][vc_column_text]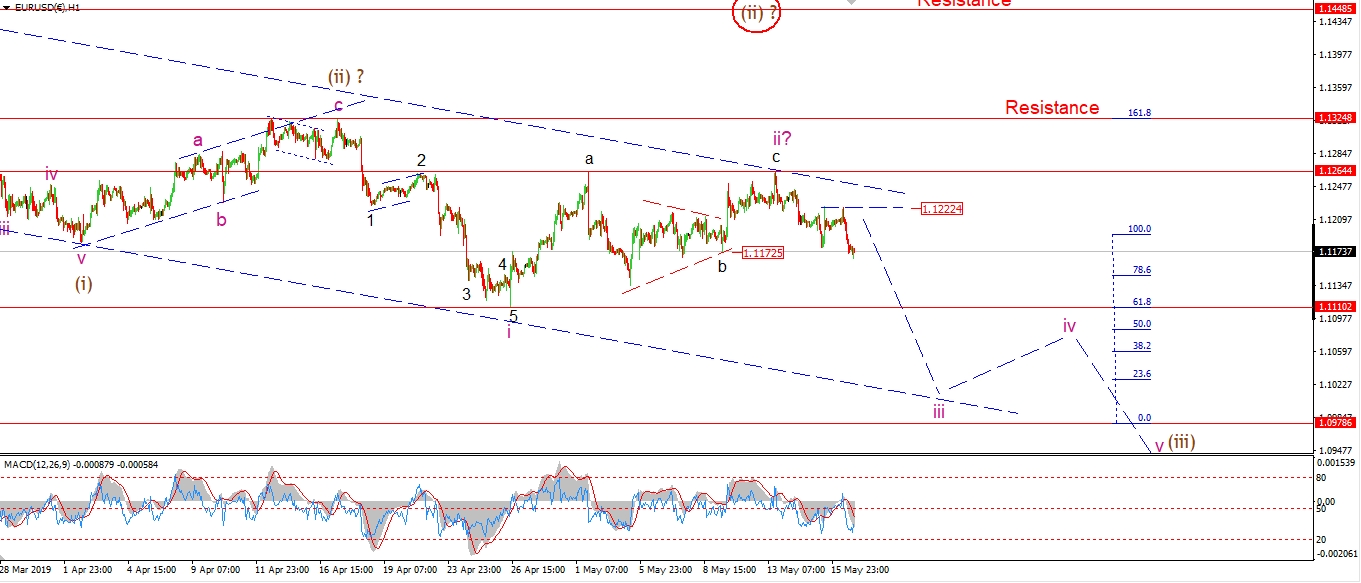 [/vc_column_text][/vc_column][vc_column width=”1/3″][vc_custom_heading text=”4 Hours” use_theme_fonts=”yes”][vc_column_text]
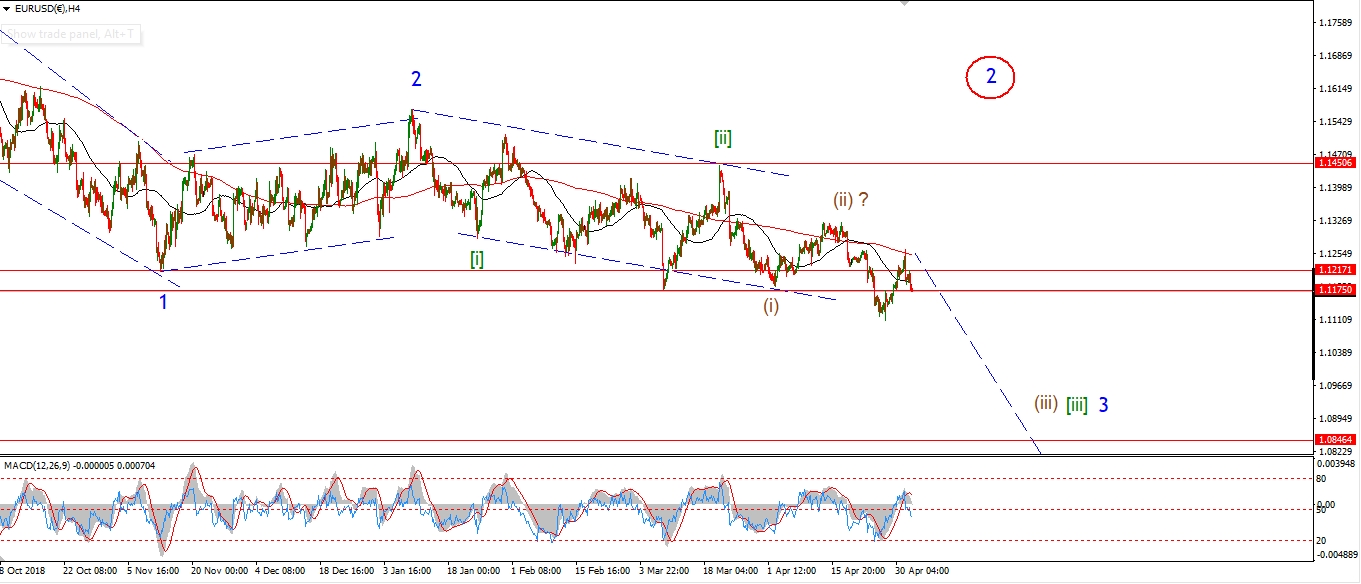 [/vc_column_text][vc_custom_heading text=”Daily” use_theme_fonts=”yes”][vc_column_text]
 [/vc_column_text][/vc_column][/vc_row]
[vc_row][vc_column][vc_column_text]
There is a slight reluctance to break that 1.1172 level at the triangle wave ‘b’ low.
Price has moved lower into that level today,
but, the market has stalled there for the moment this evening.
It is possible that there is still a small correction underway in wave ‘iii’.
And this might push back up to 1.1222 again before turning lower into wave ‘ii’ properly.
I will have to wait and see on that front.
If we see a further decline early tomorrow,
that will be a clear signal that wave ‘iii’ down has begun.
Tomorrow;
Watch for 1.1222 to hold and wave ‘iii’ to continue lower in the trend channel.
[/vc_column_text][/vc_column][/vc_row]
[vc_row][vc_column][vc_separator border_width=”5″][/vc_column][/vc_row][vc_row][vc_column][vc_column_text]
GBPUSD
[/vc_column_text][/vc_column][/vc_row][vc_row][vc_column][vc_separator border_width=”5″][/vc_column][/vc_row][vc_row][vc_column width=”2/3″][vc_custom_heading text=”1 hr” use_theme_fonts=”yes”][vc_column_text]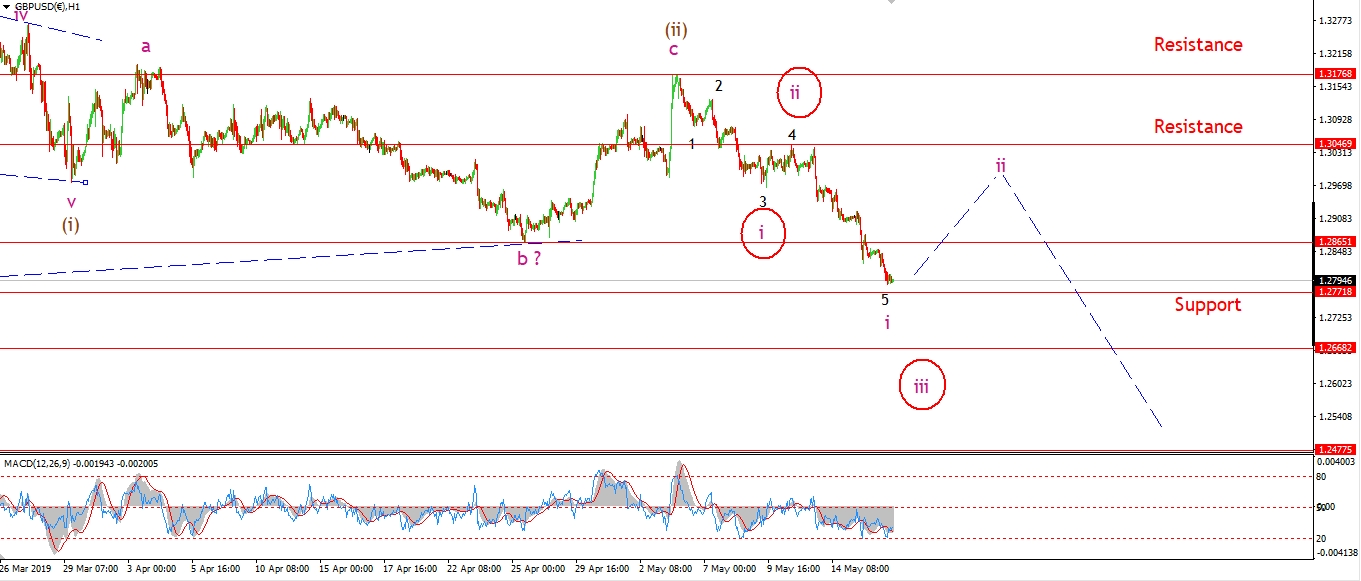 [/vc_column_text][/vc_column][vc_column width=”1/3″][vc_custom_heading text=”4 Hours” use_theme_fonts=”yes”][vc_column_text]
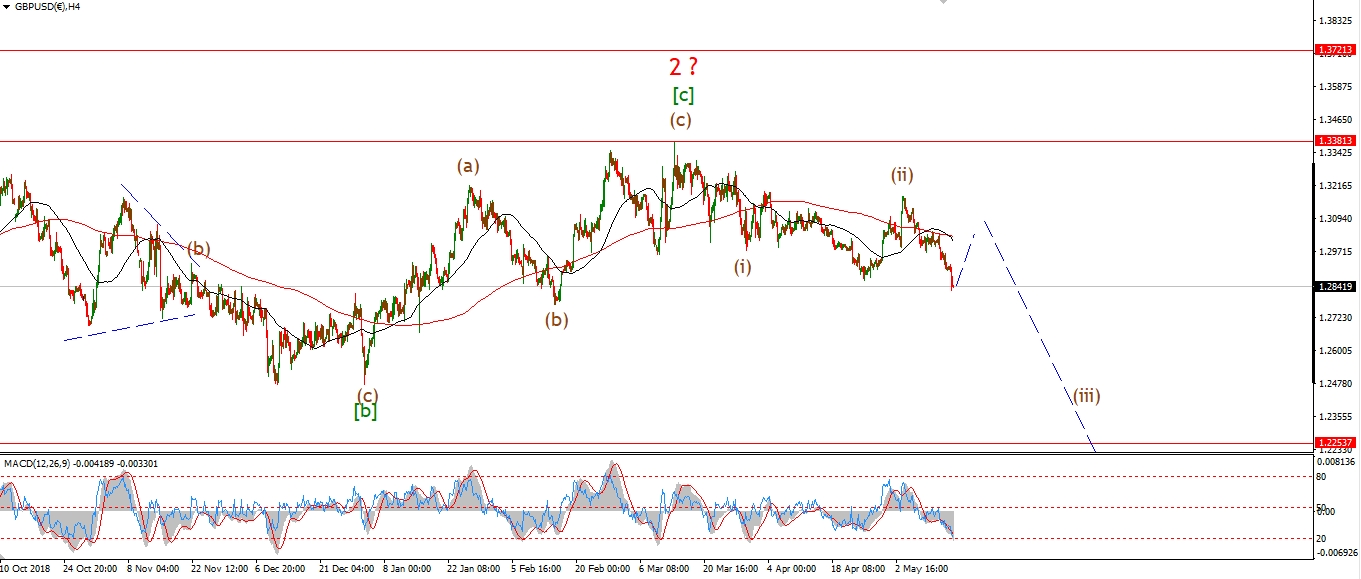 [/vc_column_text][vc_custom_heading text=”Daily” use_theme_fonts=”yes”][vc_column_text]
 [/vc_column_text][/vc_column][/vc_row]
[vc_row][vc_column][vc_column_text]
More sustained selling in Cable today,
opens up the possibility that wave ‘iii’ of (iii) has begun.
This is shown as the alternate count circled in red.
The price is now within pips of the next lower support at 1.2772.
This is wave (ii) of the previous rally.
A solid break below this level will favor the wave ‘iii’ of (iii) scenario.
Tomorrow;
Resistance is now dropped to 1.3046 at wave ‘4’ black.
This level should hold if we see a correction higher in wave ‘ii’ pink.
[/vc_column_text][/vc_column][/vc_row]
[vc_row][vc_column][vc_separator border_width=”5″][/vc_column][/vc_row][vc_row][vc_column][vc_column_text]
USDJPY
[/vc_column_text][/vc_column][/vc_row][vc_row][vc_column][vc_separator border_width=”5″][/vc_column][/vc_row][vc_row][vc_column width=”2/3″][vc_custom_heading text=”1 hr” use_theme_fonts=”yes”][vc_column_text]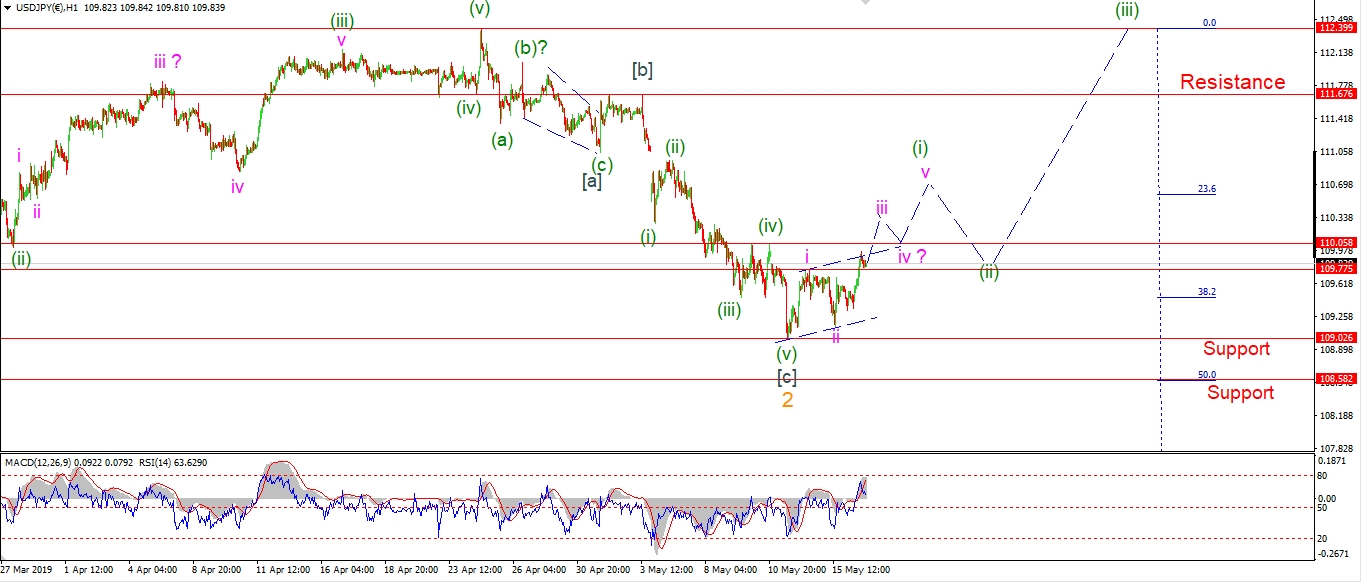 [/vc_column_text][/vc_column][vc_column width=”1/3″][vc_custom_heading text=”4 Hours” use_theme_fonts=”yes”][vc_column_text]
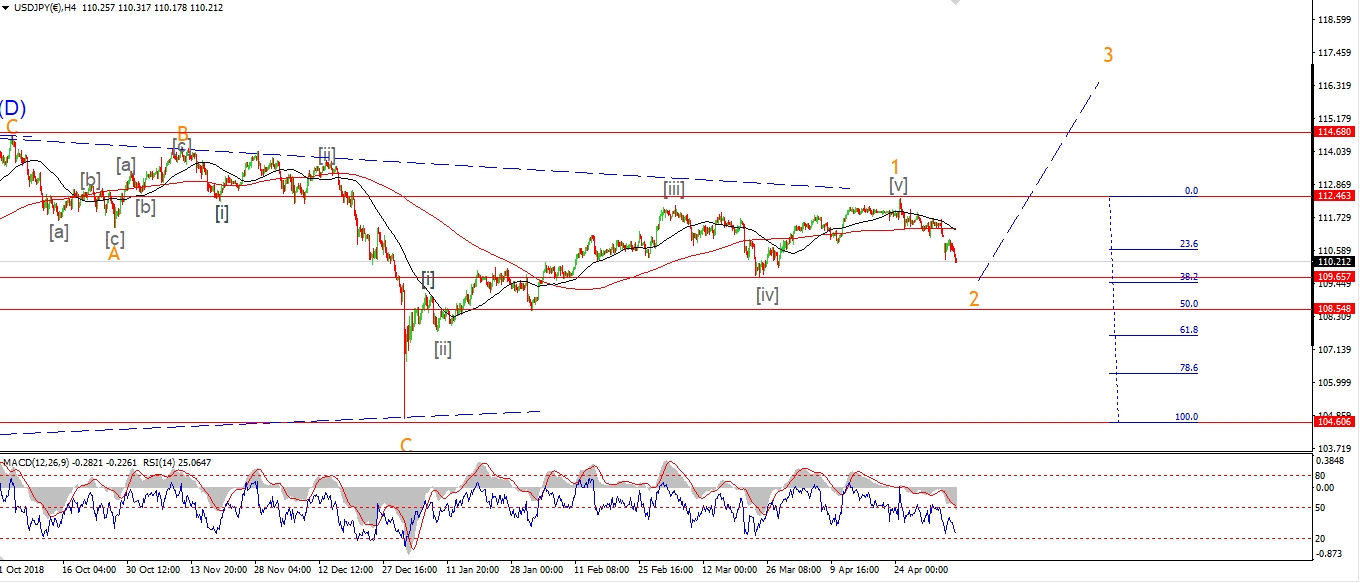 [/vc_column_text][vc_custom_heading text=”Daily” use_theme_fonts=”yes”][vc_column_text]
 [/vc_column_text][/vc_column][/vc_row]
[vc_row][vc_column][vc_column_text]
No break above resistance yet today at 110.05.
But the price did rise into that level to begin a possible wave ‘iii’ up.
The price must break above that level and out of this three wave pattern
in order to add confidence to this short term count.
So far so good though!
Tomorrow;
Watch for wave ‘iii’ to continue higher above 110.05.
The wave ‘i’ high at 109.77 should then become support.
[/vc_column_text][/vc_column][/vc_row]
[vc_row][vc_column][vc_separator border_width=”5″][/vc_column][/vc_row][vc_row][vc_column][vc_column_text]
DOW JONES INDUSTRIALS
[/vc_column_text][/vc_column][/vc_row][vc_row][vc_column][vc_separator border_width=”5″][/vc_column][/vc_row][vc_row][vc_column width=”2/3″][vc_custom_heading text=”1 hr” use_theme_fonts=”yes”][vc_column_text]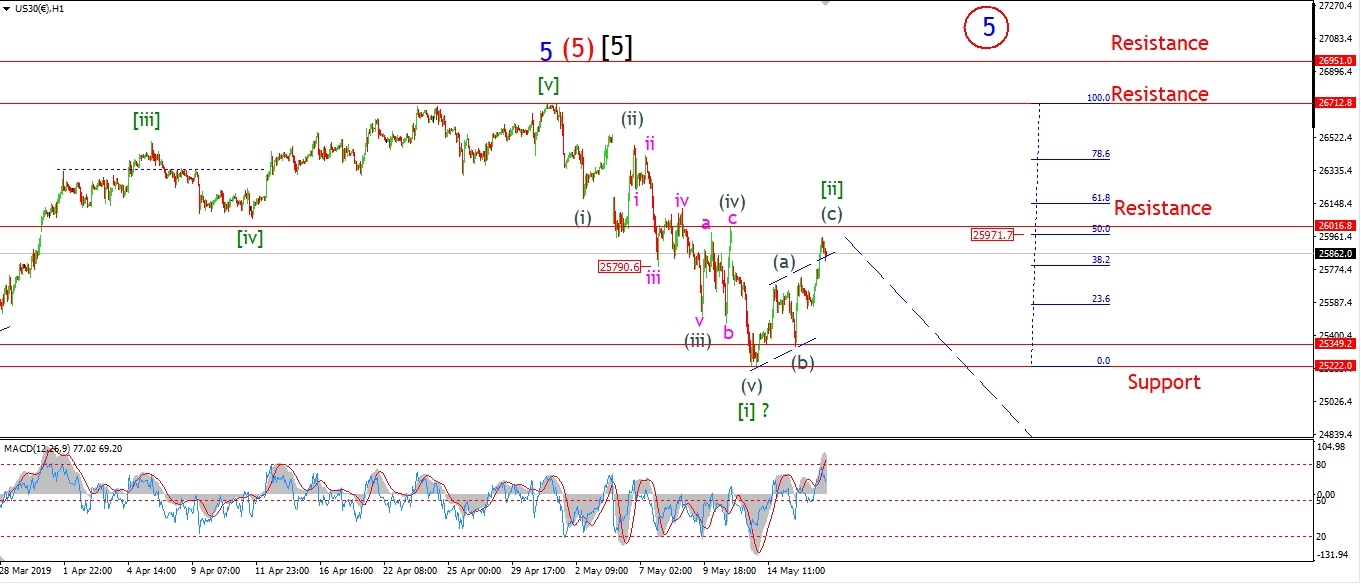 [/vc_column_text][/vc_column][vc_column width=”1/3″][vc_custom_heading text=”4 Hours” use_theme_fonts=”yes”][vc_column_text]
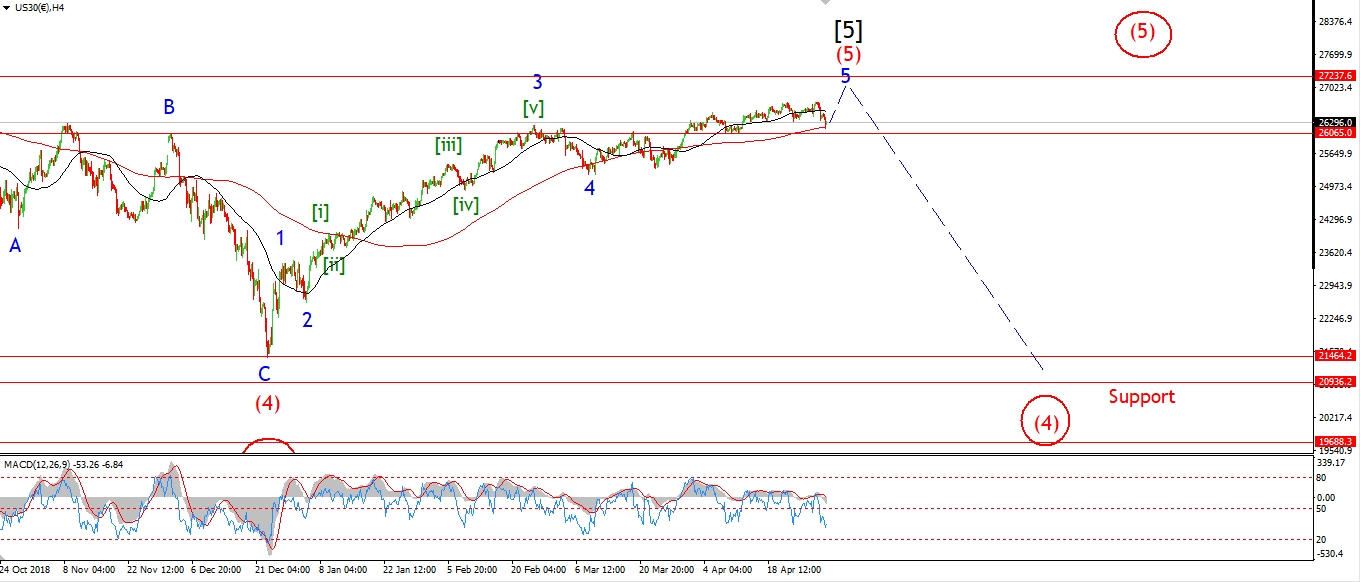 [/vc_column_text][vc_custom_heading text=”Daily” use_theme_fonts=”yes”][vc_column_text]
 [/vc_column_text][/vc_column][/vc_row]
[vc_row][vc_column][vc_column_text]
The DOW broke out above the trend channel to the upside in wave (c) of [ii] today.
The internal pattern has taken a 3,3,3 form so far,
which makes this correction a combination correction rather than a 3,3,5 flat correction.
Another push into resistance at 26016,
would create five internal waves within wave (c) and confirm a flat correction.
Either way,
I think we are in a high probability turning zone right now.
Price is at the 50% retracement level,
and a three wave pattern higher is all but complete.
If we see an impulsive drop off this level,
that will signal that wave [iii] down is getting started.
Tomorrow;
Watch for wave (c) to complete at a nearby level,
We may even get the initial turn down to begin wave [iii] by tomorrow evening.
[/vc_column_text][/vc_column][/vc_row]
[vc_row][vc_column][vc_separator border_width=”5″][/vc_column][/vc_row][vc_row][vc_column][vc_column_text]
GOLD
[/vc_column_text][/vc_column][/vc_row][vc_row][vc_column][vc_separator border_width=”5″][/vc_column][/vc_row][vc_row][vc_column width=”2/3″][vc_custom_heading text=”1 hr” use_theme_fonts=”yes”][vc_column_text]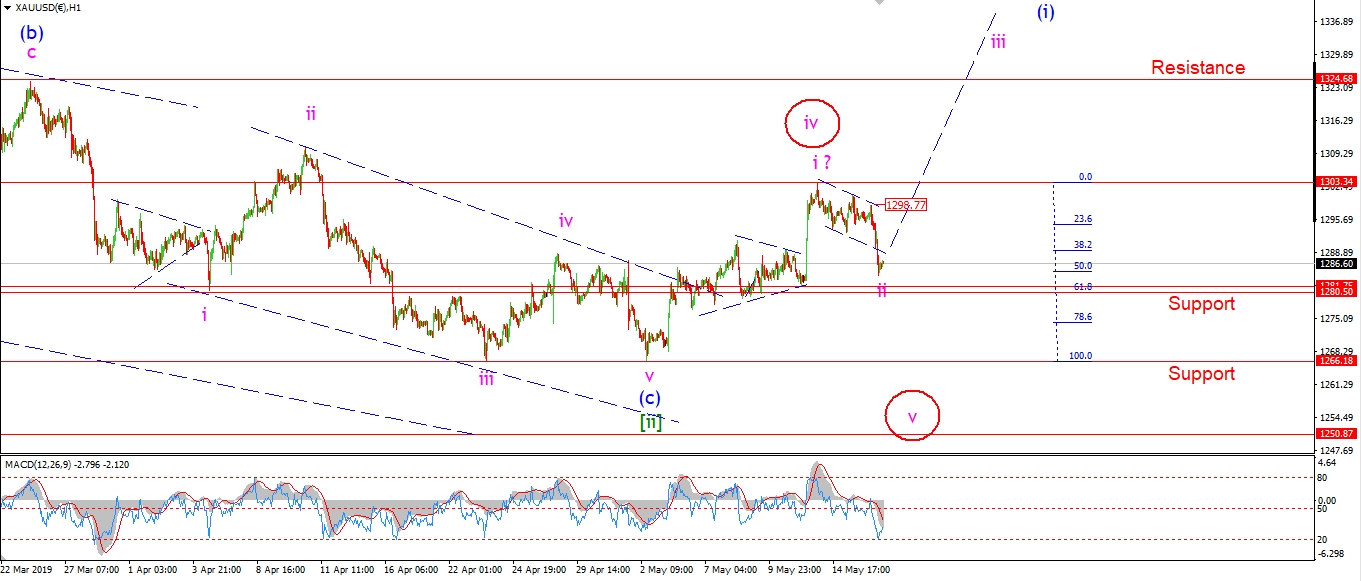 [/vc_column_text][/vc_column][vc_column width=”1/3″][vc_custom_heading text=”4 Hours” use_theme_fonts=”yes”][vc_column_text]
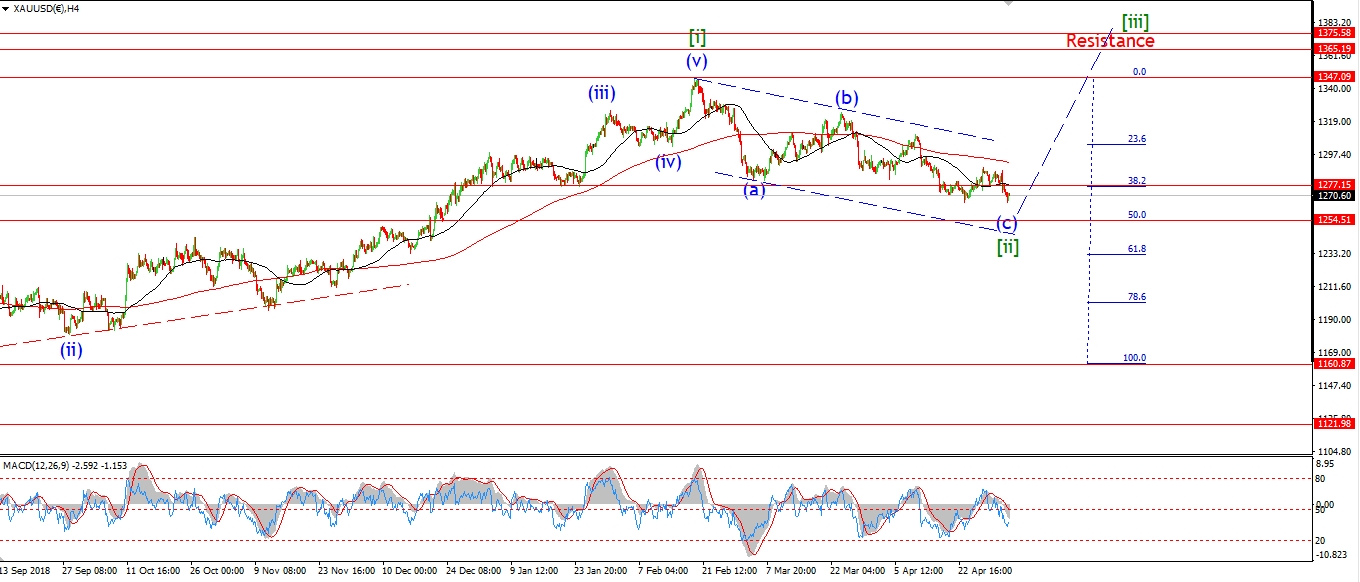 [/vc_column_text][vc_custom_heading text=”Daily” use_theme_fonts=”yes”][vc_column_text]
 [/vc_column_text][/vc_column][/vc_row]
[vc_row][vc_column][vc_column_text]
Gold is dropping into the lower support level at 1281.75 today.
The price has broken out of the small trend channel shown last night,
but this should only be a temporary occurrence.
The 62% retracement of wave ‘i’ lies at 1280.50.
This level is quite close to the initial support also.
So if wave ‘iii’ up is about to begin,
the 1280 level is worth watching from here.
Tomorrow;
Watch for price to find support at 1280 and reverse higher to begin wave ‘iii’ of (i).
[/vc_column_text][/vc_column][/vc_row]
[vc_row][vc_column][vc_separator border_width=”5″][/vc_column][/vc_row][vc_row][vc_column][vc_column_text]
U.S CRUDE OIL
[/vc_column_text][/vc_column][/vc_row][vc_row][vc_column][vc_separator border_width=”5″][/vc_column][/vc_row][vc_row][vc_column width=”2/3″][vc_custom_heading text=”1 hr” use_theme_fonts=”yes”][vc_column_text]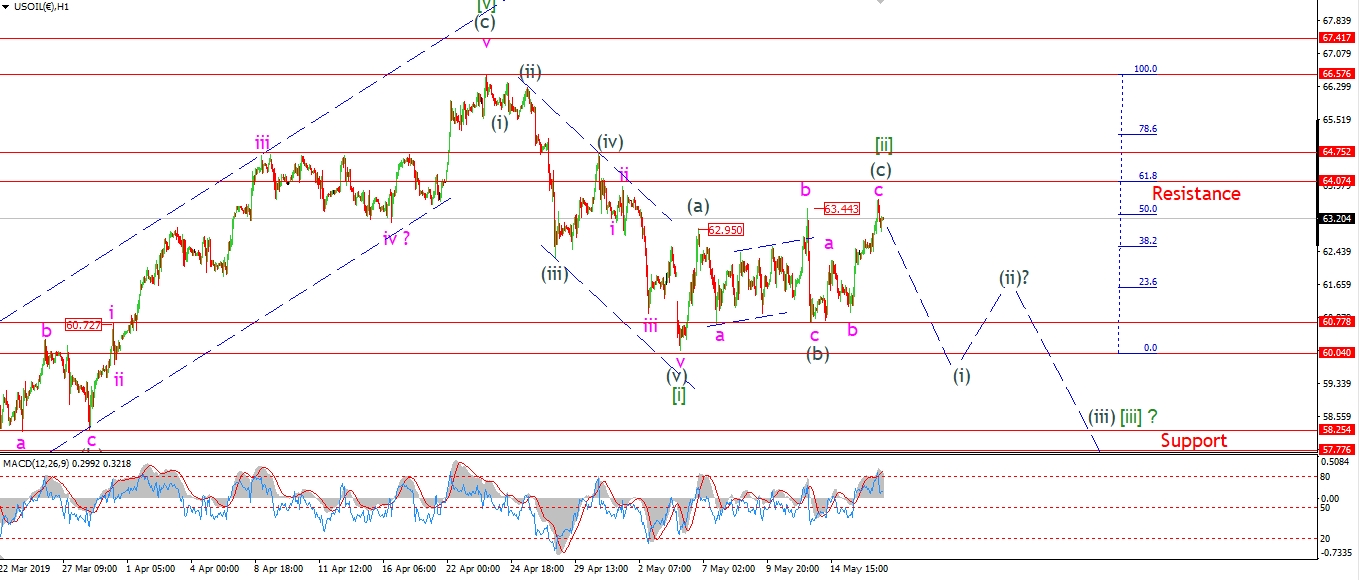 [/vc_column_text][/vc_column][vc_column width=”1/3″][vc_custom_heading text=”4 Hours” use_theme_fonts=”yes”][vc_column_text]
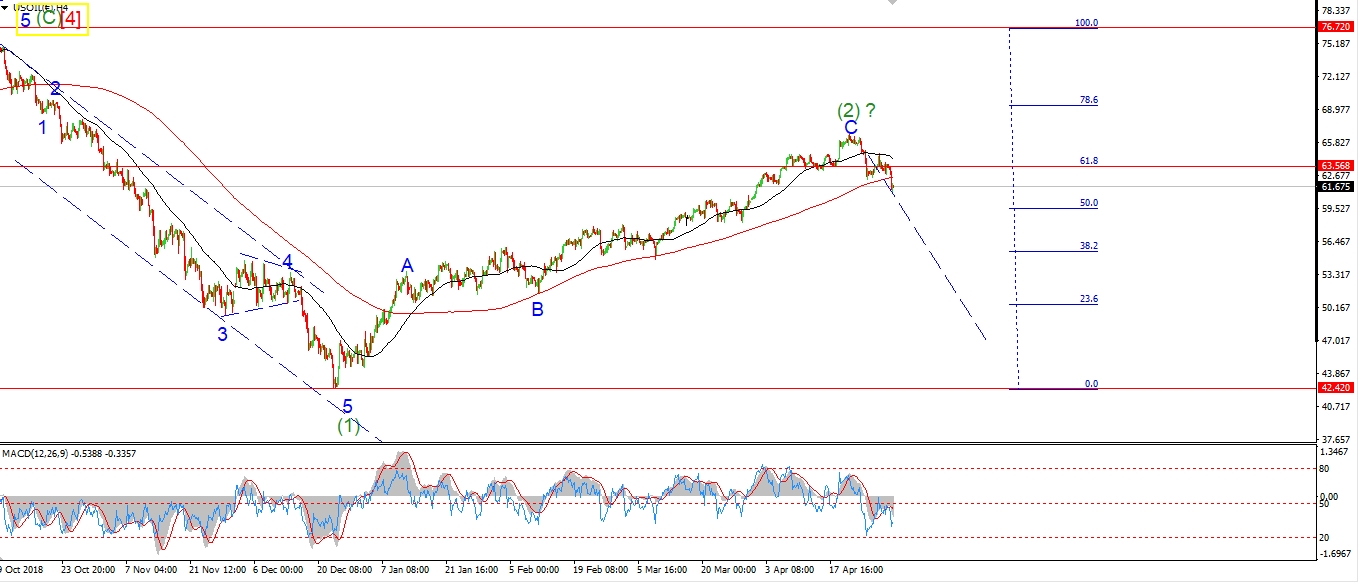 [/vc_column_text][vc_custom_heading text=”Daily” use_theme_fonts=”yes”][vc_column_text]
 [/vc_column_text][/vc_column][/vc_row]
[vc_row][vc_column][vc_column_text]
Crude broke the 63.44 interim high this evening
which invalidated last nights short term count.
I have shown the next most likely pattern for wave [ii] green now.
This involves an expanded flat wave (b),
and now,
a further three wave rise in wave (c) of [ii].
The 62% retracement level of wave [i] lies at 64.75.
This level should offer resistance to any further rally.
The price has dropped back off the highs again this evening.
So again we are looking at the possibility that wave [iii] down is beginning.
The wave (b) low lies at 60.77,
If that level breaks after a five wave decline,
that will be a strong indication that wave (i) of [iii] has begun.
Tomorrow;
We are now in that general reversal zone for wave [ii] to complete and wave [iii] to begin.
Watch for a signal that wave [ii] has completed in the form of another five wave decline.
[/vc_column_text][/vc_column][/vc_row]
[vc_row][vc_column][vc_separator border_width=”5″][/vc_column][/vc_row][vc_row][vc_column][vc_column_text]
US 10 yr Treasuries.
[/vc_column_text][/vc_column][/vc_row][vc_row][vc_column][vc_separator border_width=”5″][/vc_column][/vc_row][vc_row][vc_column width=”2/3″][vc_custom_heading text=”1 hr” use_theme_fonts=”yes”][vc_column_text]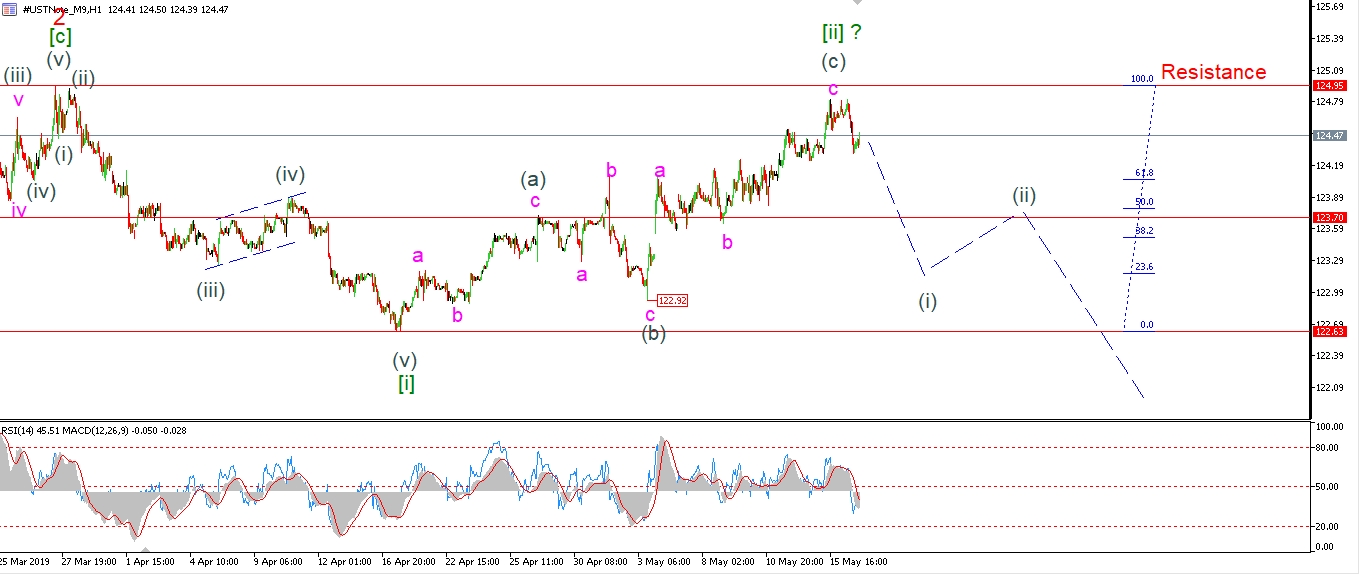 [/vc_column_text][/vc_column][vc_column width=”1/3″][vc_custom_heading text=”4 Hours” use_theme_fonts=”yes”][vc_column_text]
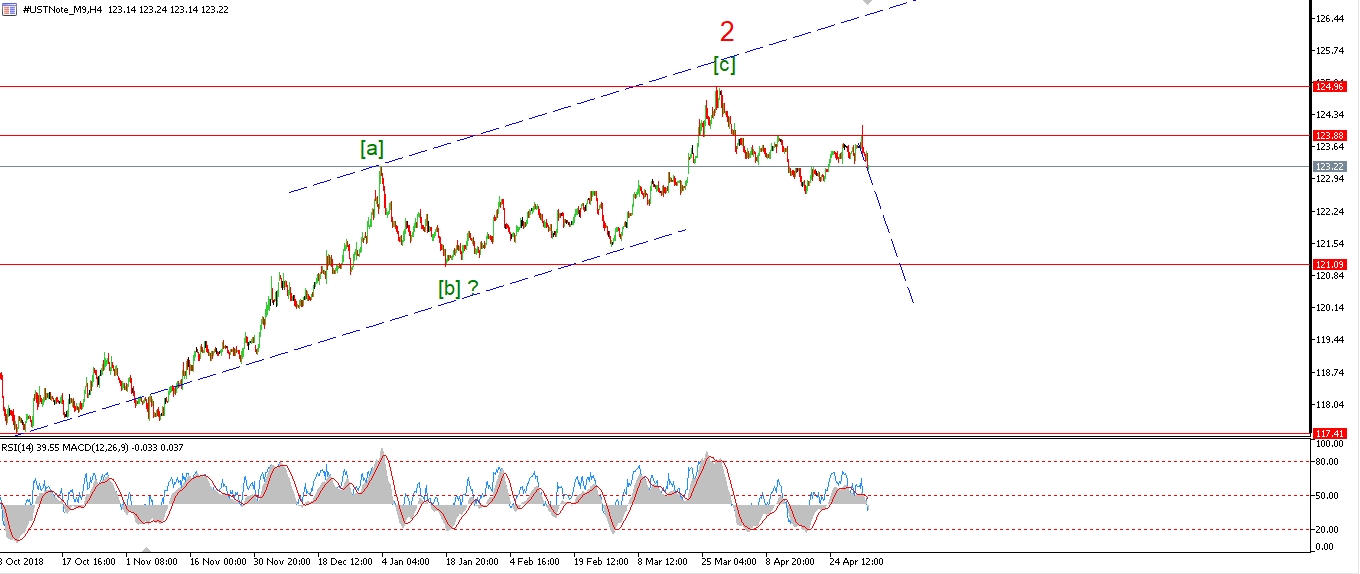 [/vc_column_text][vc_custom_heading text=”Daily” use_theme_fonts=”yes”][vc_column_text]
 [/vc_column_text][/vc_column][/vc_row]
[vc_row][vc_column][vc_column_text]
Saved by the bell in the treasury market!
Prices have declined off the highs today to save the current bearish wave count for now.
But I do want to see a break below 123.50 again in a five wave pattern,
to signal that wave (i) of [iii] has begun.
We should be able to build another impulse wave lower over the coming week,
in wave’s (i) and (ii) to give us that high probability signal that the turn is underway.
Tomorrow;
Watch for the recent top to hold, and price to continue lower again.
124.95 must not break.
[/vc_column_text][/vc_column][/vc_row]
[vc_row][vc_column][vc_separator border_width=”5″][/vc_column][/vc_row][vc_row][vc_column][vc_column_text]
SILVER
[/vc_column_text][/vc_column][/vc_row][vc_row][vc_column][vc_separator border_width=”5″][/vc_column][/vc_row][vc_row][vc_column width=”2/3″][vc_custom_heading text=”1 hr” use_theme_fonts=”yes”][vc_column_text]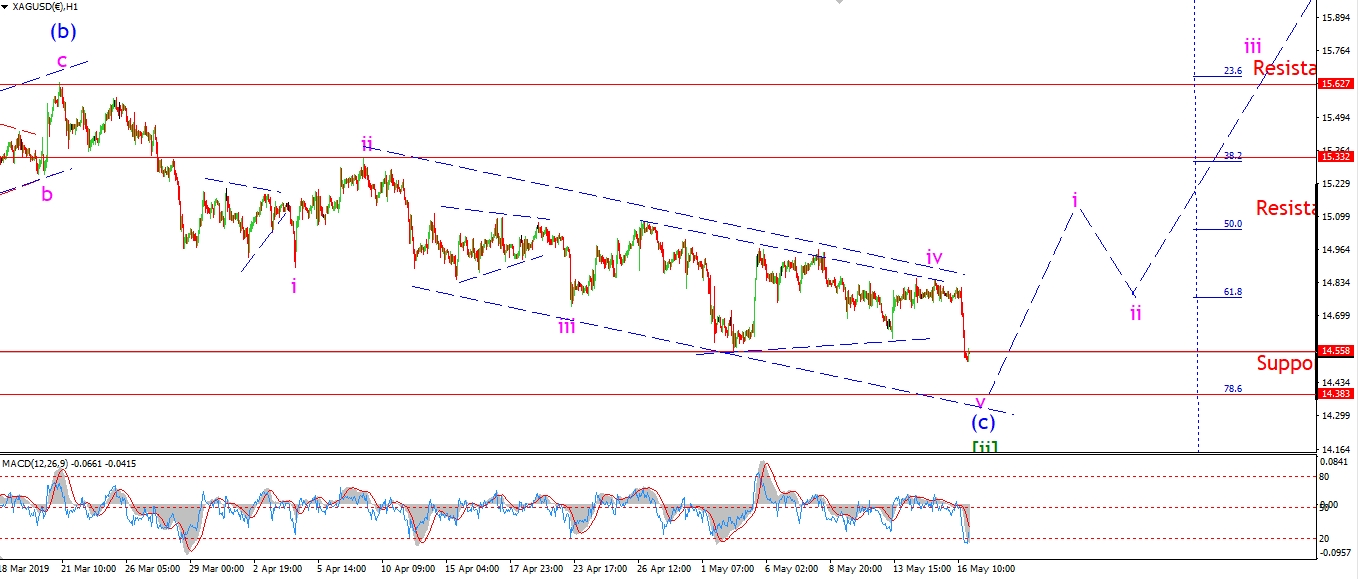 [/vc_column_text][/vc_column][vc_column width=”1/3″][vc_custom_heading text=”4 Hours” use_theme_fonts=”yes”][vc_column_text]
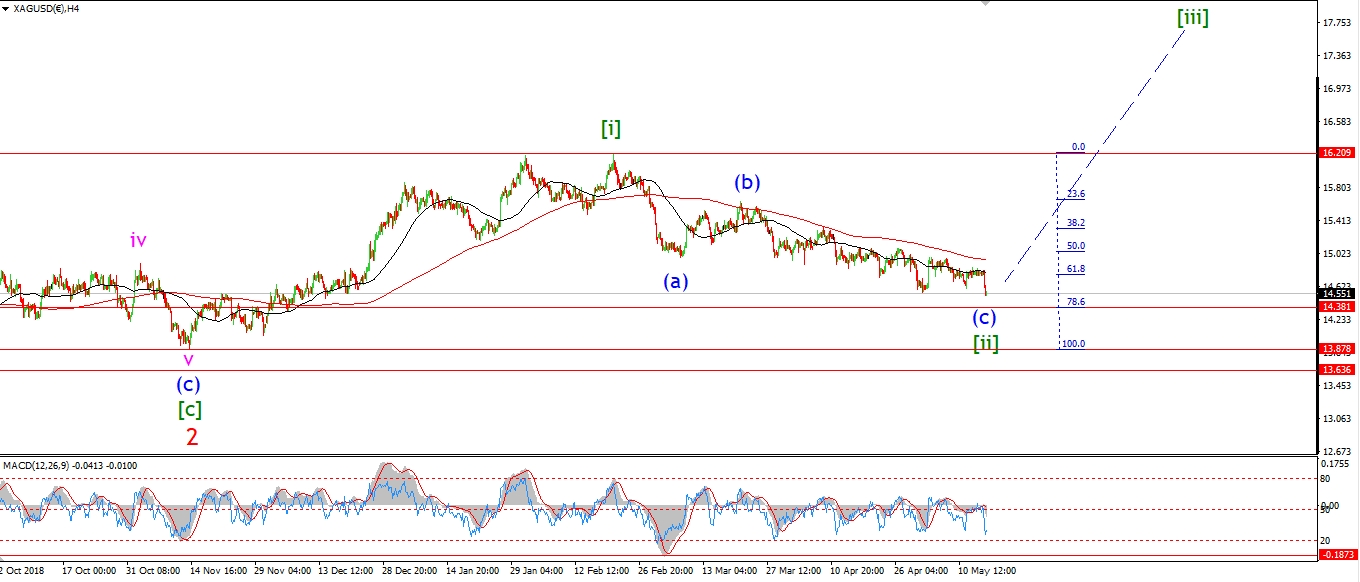 [/vc_column_text][vc_custom_heading text=”Daily” use_theme_fonts=”yes”][vc_column_text]
 [/vc_column_text][/vc_column][/vc_row]
[vc_row][vc_column][vc_column_text]
Silver has again broken out of the bullish mold today,
with a sharp drop below 14.55 that rules out the recent short term bullish count.
I have reverted to the previous wave (c) decline again this evening.
The count shows a triangle forming in wave ‘iv’ of (c),
and now a spike lower in wave ‘v’ to complete wave (c).
On the 4hr chart;
Wave (c) will reach equality with wave (a) at 14.38.
This level is also the 78.6% retracement level of the whole wave [i] up.
Wave (c) is ending now.
And I do believe we will see a bullish move higher sooner rather than later.
Tomorrow;
Wave ‘v’ will complete very soon.
14.38 is the next level to watch for a reversal higher into wave (i) of [iii].
[/vc_column_text][/vc_column][/vc_row]
[vc_row][vc_column][vc_separator border_width=”5″][/vc_column][/vc_row][vc_row][vc_column][vc_column_text]
S&P 500.
[/vc_column_text][/vc_column][/vc_row][vc_row][vc_column][vc_separator border_width=”5″][/vc_column][/vc_row][vc_row][vc_column width=”2/3″][vc_custom_heading text=”1 hr” use_theme_fonts=”yes”][vc_column_text]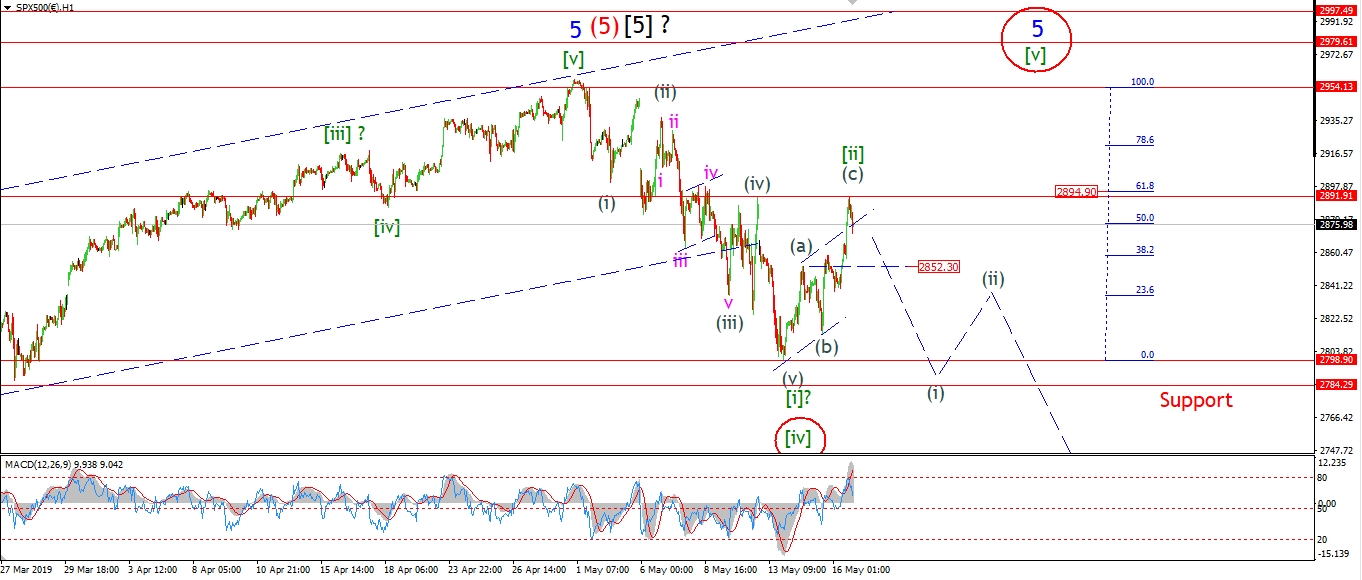 [/vc_column_text][/vc_column][vc_column width=”1/3″][vc_custom_heading text=”4 Hours” use_theme_fonts=”yes”][vc_column_text]
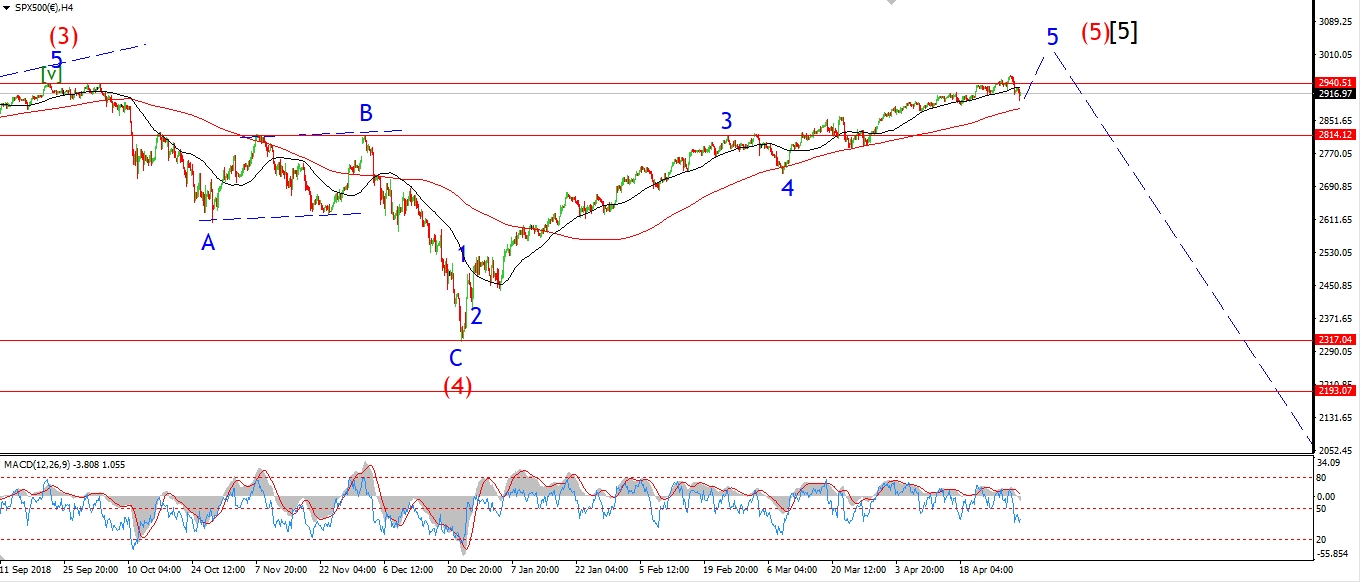 [/vc_column_text][vc_custom_heading text=”Daily” use_theme_fonts=”yes”][vc_column_text]
 [/vc_column_text][/vc_column][/vc_row]
[vc_row][vc_column][vc_column_text]
The S&P has reached the reached the area of the previous fourth wave of one lesser degree at todays high.
In fact I think we matched the high of wave (iv) of [i] to the pip!
And so far the price has dropped again.
Todays high reached 2891,
while the 62% retracement level lies at 2894.
And again the rally has traced out a three wave structure higher off the wave [i] low.
This leads me to believe that wave [ii] is now complete,
and wave [iii] down should begin from here.
Tomorrow;
Watch for wave (i) of [iii] to begin with a break of 2852 again.
[/vc_column_text][/vc_column][/vc_row]
[vc_row][vc_column][vc_column_text]
[/vc_column_text][/vc_column][/vc_row]
[vc_row][vc_column][vc_separator border_width=”5″][/vc_column][/vc_row]