
[vc_row][vc_column][vc_separator border_width=”5″][/vc_column][/vc_row]
[vc_row][vc_column][vc_column_text]
Good evening to you all.
I hope the day was good to you.
[/vc_column_text][/vc_column][/vc_row]
[vc_row][vc_column][vc_separator border_width=”5″][/vc_column][/vc_row]
[vc_row][vc_column][vc_column_text]
EURUSD
[/vc_column_text][/vc_column][/vc_row]
[vc_row][vc_column][vc_separator border_width=”5″][/vc_column][/vc_row][vc_row][vc_column width=”2/3″][vc_custom_heading text=”1 hr” use_theme_fonts=”yes”][vc_column_text]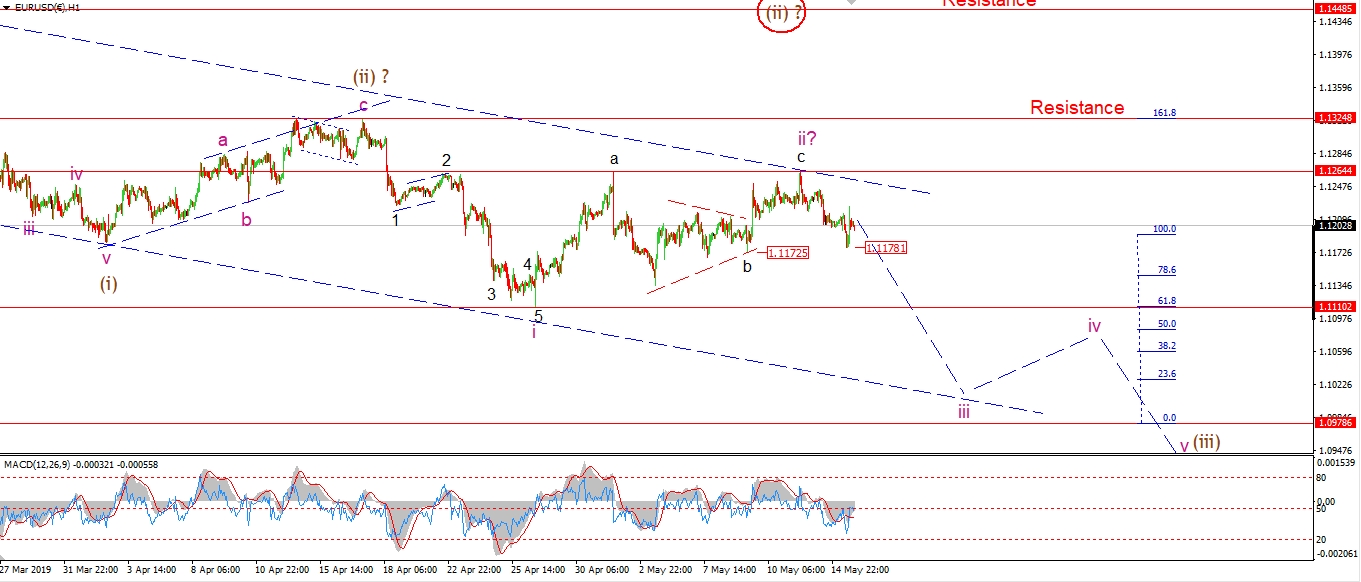 [/vc_column_text][/vc_column][vc_column width=”1/3″][vc_custom_heading text=”4 Hours” use_theme_fonts=”yes”][vc_column_text]
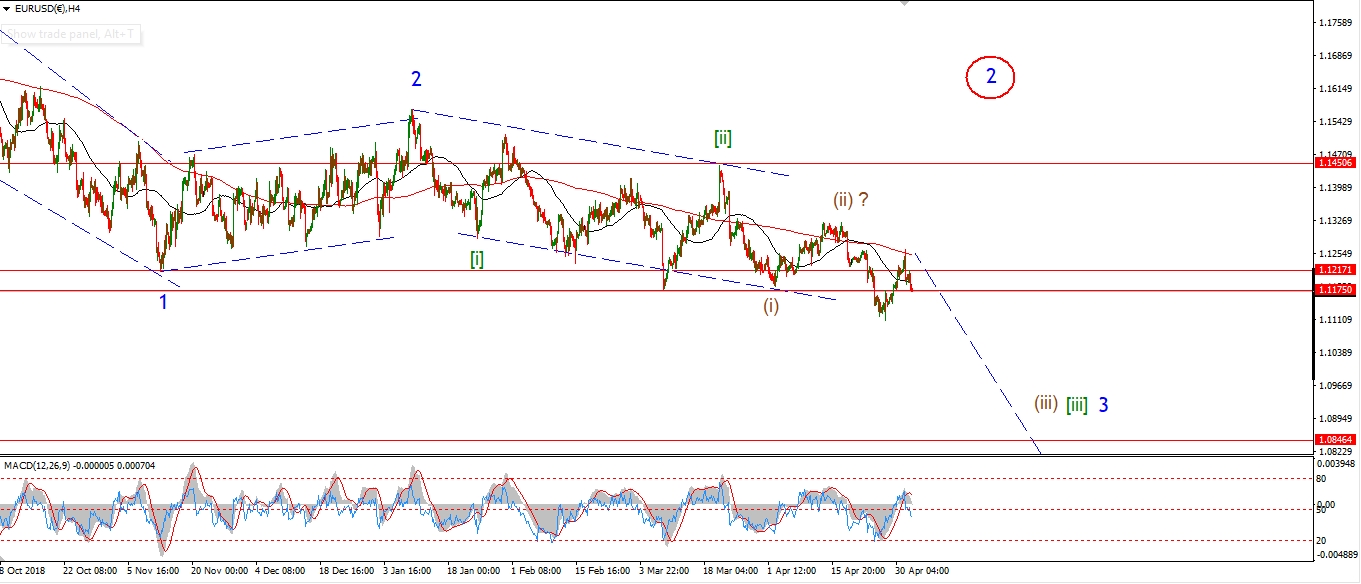 [/vc_column_text][vc_custom_heading text=”Daily” use_theme_fonts=”yes”][vc_column_text]
 [/vc_column_text][/vc_column][/vc_row]
[vc_row][vc_column][vc_column_text]
EURUSD has dropped off the wave ‘ii’ high in five waves.
The price reached a low today at 1.1178,
this is just short of the triangle wave ‘b’ low at 1.1172.
A break of that 1.1172 level will signal that wave ‘iii’ down has begun.
The early indications are that wave ‘iii’ down is now getting started.
A three wave recovery that fails below 1.1264 will complete another lower degree bearish impulse wave.
At that point wave ‘iii’ down will be ready to go.
Tomorrow;
Watch for 1.1264 to hold again and wave ‘iii’ to turn lower again.
A break of 1.1110 will confirm the count.
[/vc_column_text][/vc_column][/vc_row]
[vc_row][vc_column][vc_separator border_width=”5″][/vc_column][/vc_row][vc_row][vc_column][vc_column_text]
GBPUSD
[/vc_column_text][/vc_column][/vc_row][vc_row][vc_column][vc_separator border_width=”5″][/vc_column][/vc_row][vc_row][vc_column width=”2/3″][vc_custom_heading text=”1 hr” use_theme_fonts=”yes”][vc_column_text]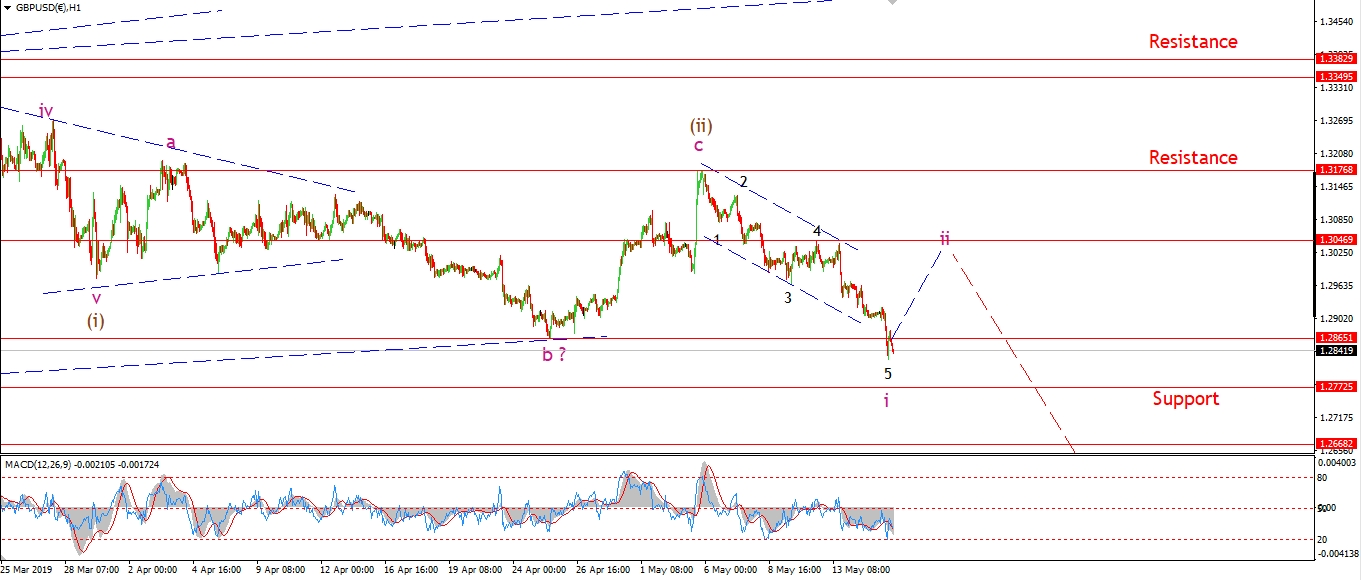 [/vc_column_text][/vc_column][vc_column width=”1/3″][vc_custom_heading text=”4 Hours” use_theme_fonts=”yes”][vc_column_text]
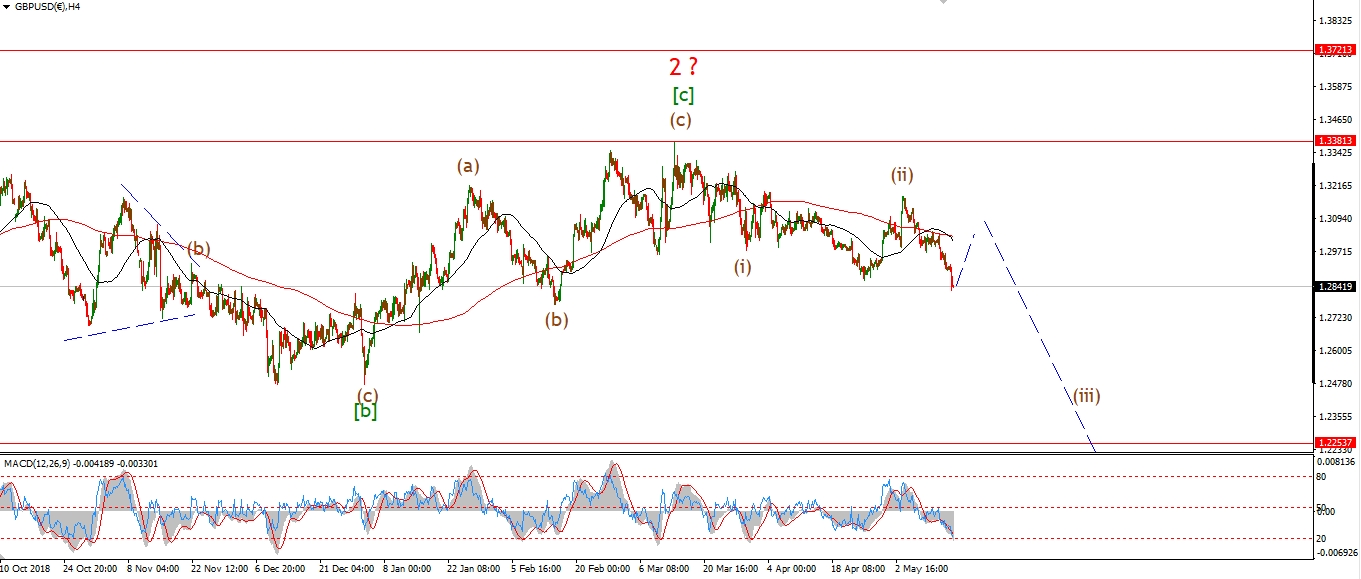 [/vc_column_text][vc_custom_heading text=”Daily” use_theme_fonts=”yes”][vc_column_text]
 [/vc_column_text][/vc_column][/vc_row]
[vc_row][vc_column][vc_column_text]
I am concentrating on the bearish alternate count this evening.
Cable dropped below 1.2865 today,
which rules out the previous wave count.
Also,
the price has created a five wave move into todays low,
this low is labelled wave ‘i’ pink.
Wave ‘ii’ should now follow and complete below 1.3046, shown on the short term chart.
If we see further weakness off that level,
that will signal that wave ‘iii’ down has begun.
Tomorrow;
Watch for a corrective recovery in wave ‘ii’ to complete below 1.3046.
Wave ‘iii’ of (iii) should then take prices lower again.
[/vc_column_text][/vc_column][/vc_row]
[vc_row][vc_column][vc_separator border_width=”5″][/vc_column][/vc_row][vc_row][vc_column][vc_column_text]
USDJPY
[/vc_column_text][/vc_column][/vc_row][vc_row][vc_column][vc_separator border_width=”5″][/vc_column][/vc_row][vc_row][vc_column width=”2/3″][vc_custom_heading text=”1 hr” use_theme_fonts=”yes”][vc_column_text]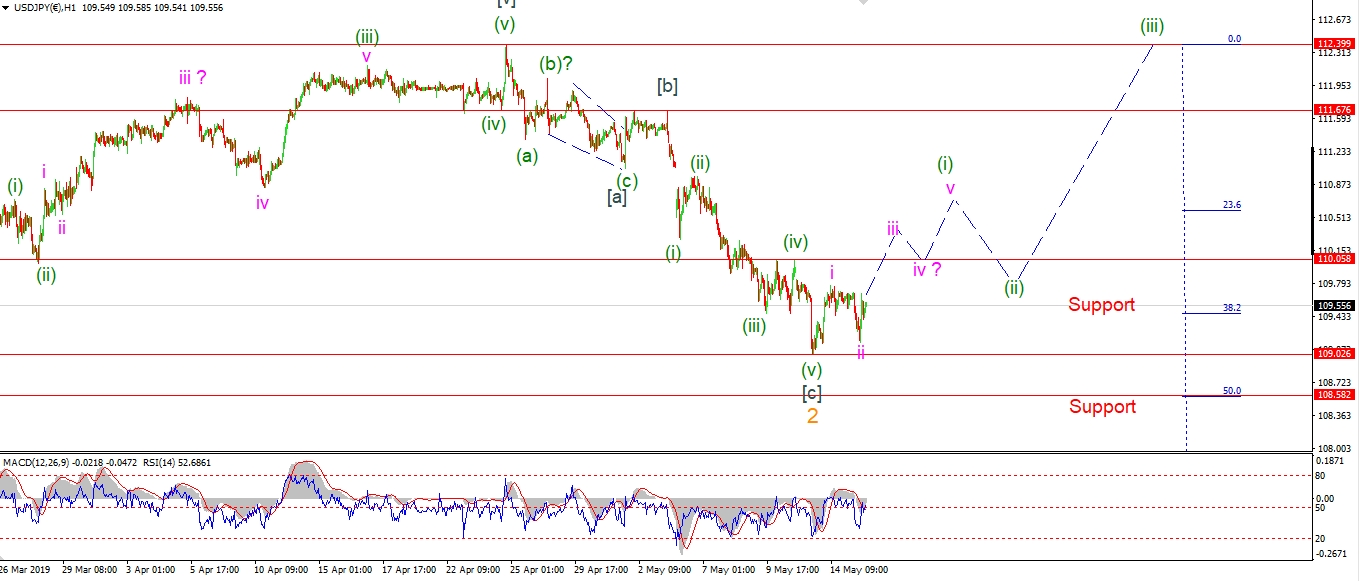 [/vc_column_text][/vc_column][vc_column width=”1/3″][vc_custom_heading text=”4 Hours” use_theme_fonts=”yes”][vc_column_text]
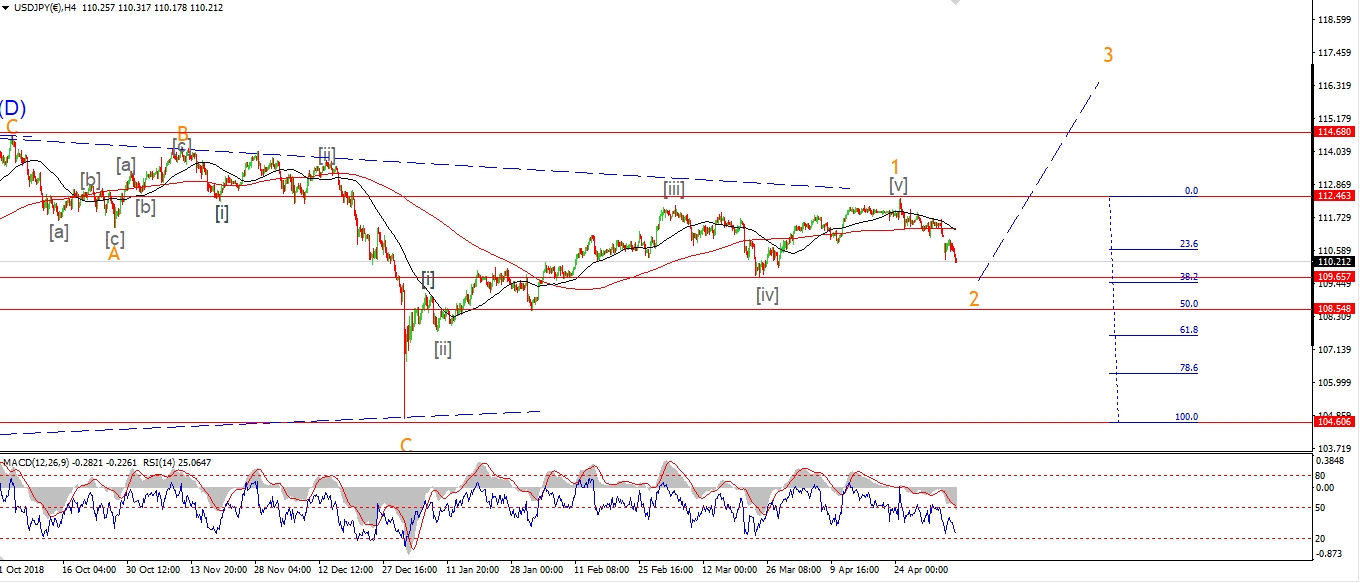 [/vc_column_text][vc_custom_heading text=”Daily” use_theme_fonts=”yes”][vc_column_text]
 [/vc_column_text][/vc_column][/vc_row]
[vc_row][vc_column][vc_column_text]
USDJPY has formed a higher low above 109.02 today.
The decline off Tuesdays high is in three waves,
and the price has again rallied this evening.
All of this action suggests that wave (i) up is now underway.
I have labelled the higher low as waves ‘i’ and ‘ii’ in pink,
Wave ‘iii’ of (i) should now push above 110.05 as shown.
Tomorrow;
Watch for 109.02 to again hold and wave (i) to continue higher in five waves.
If all goes to plan,
there is a significant bullish signal now only days away for USDJPY.
[/vc_column_text][/vc_column][/vc_row]
[vc_row][vc_column][vc_separator border_width=”5″][/vc_column][/vc_row][vc_row][vc_column][vc_column_text]
DOW JONES INDUSTRIALS
[/vc_column_text][/vc_column][/vc_row][vc_row][vc_column][vc_separator border_width=”5″][/vc_column][/vc_row][vc_row][vc_column width=”2/3″][vc_custom_heading text=”1 hr” use_theme_fonts=”yes”][vc_column_text]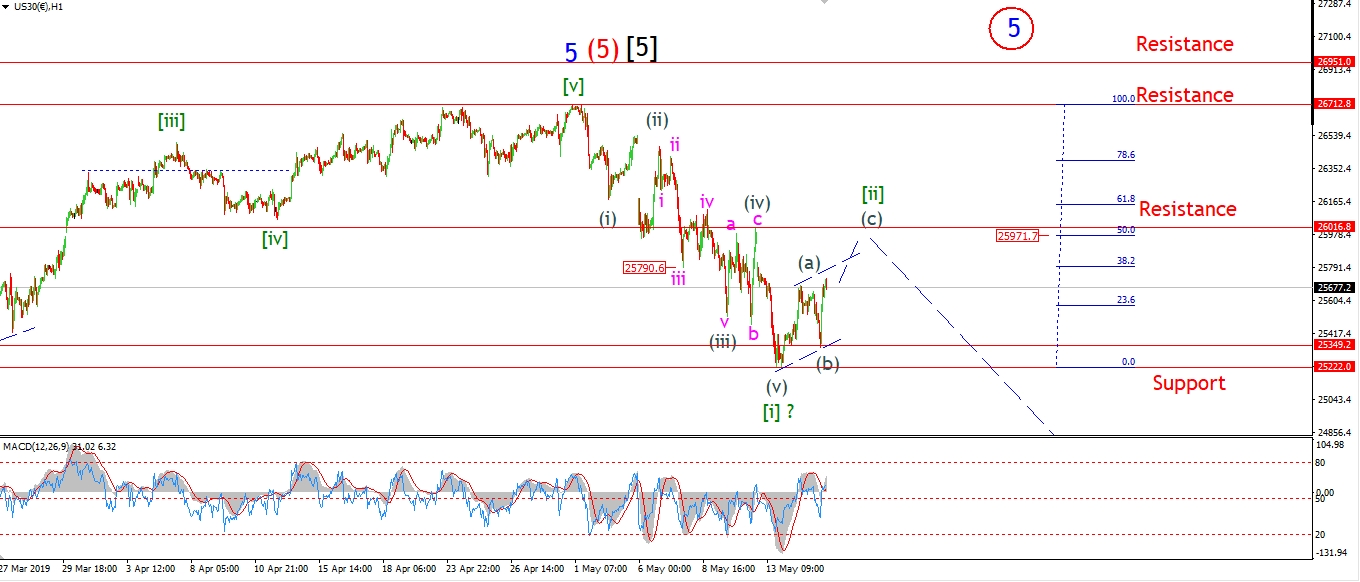 [/vc_column_text][/vc_column][vc_column width=”1/3″][vc_custom_heading text=”4 Hours” use_theme_fonts=”yes”][vc_column_text]
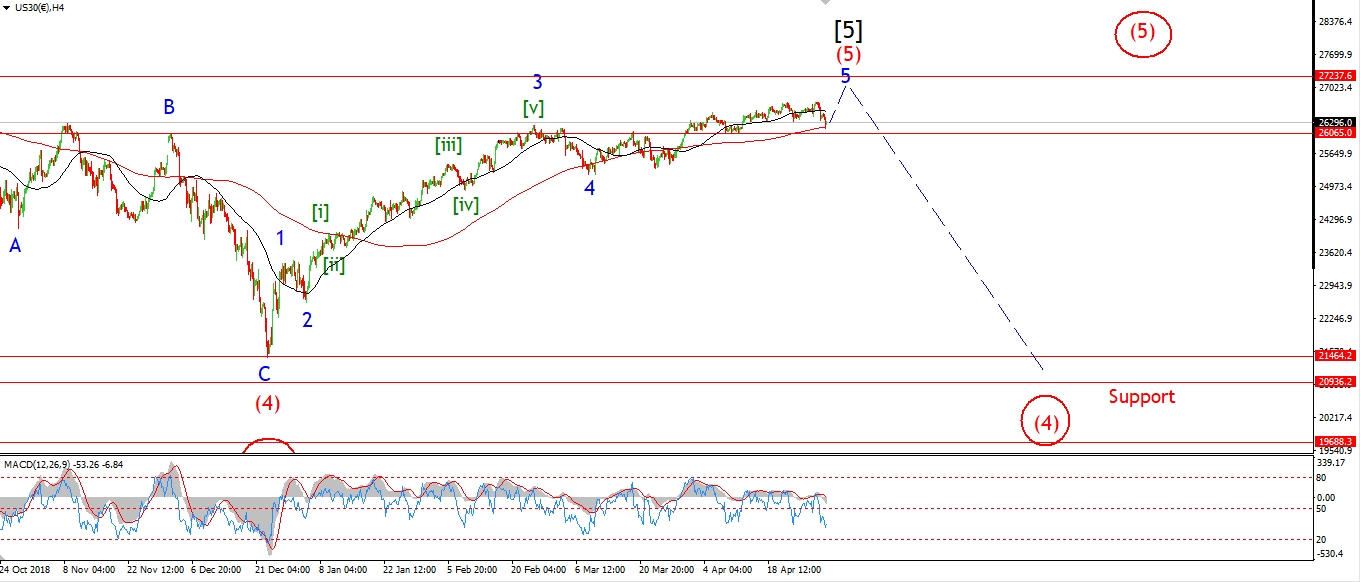 [/vc_column_text][vc_custom_heading text=”Daily” use_theme_fonts=”yes”][vc_column_text]
 [/vc_column_text][/vc_column][/vc_row]
[vc_row][vc_column][vc_column_text]
The market did indeed drop off Tuesdays high in a three wave pattern today.
The DOW fell 350 points off the high at wave (a),
and found support at that longer term support level of 25349.
The wave (b) higher low was in place at that point.
And then out of nowhere,
the market rallied again and has taken out the wave (a) high this evening.
This action is in perfect lockstep with the expected flat correction wave [ii].
Wave (c) of [ii] has met the minimum expected target by breaking out above wave (a).
So technically this correction is complete.
I still think we will see a 50% retracement in wave [ii] at 25971.
And tomorrows session should be enough to get there.
Tomorrow;
Watch for wave (c) of [ii] to break above the upper trend channel line ad complete in the area of the 50% retracement level at 25971.
If this short term wave count is correct,
then we are in for a serious decline in wave [iii] over the coming weeks.
[/vc_column_text][/vc_column][/vc_row]
[vc_row][vc_column][vc_separator border_width=”5″][/vc_column][/vc_row][vc_row][vc_column][vc_column_text]
GOLD
[/vc_column_text][/vc_column][/vc_row][vc_row][vc_column][vc_separator border_width=”5″][/vc_column][/vc_row][vc_row][vc_column width=”2/3″][vc_custom_heading text=”1 hr” use_theme_fonts=”yes”][vc_column_text]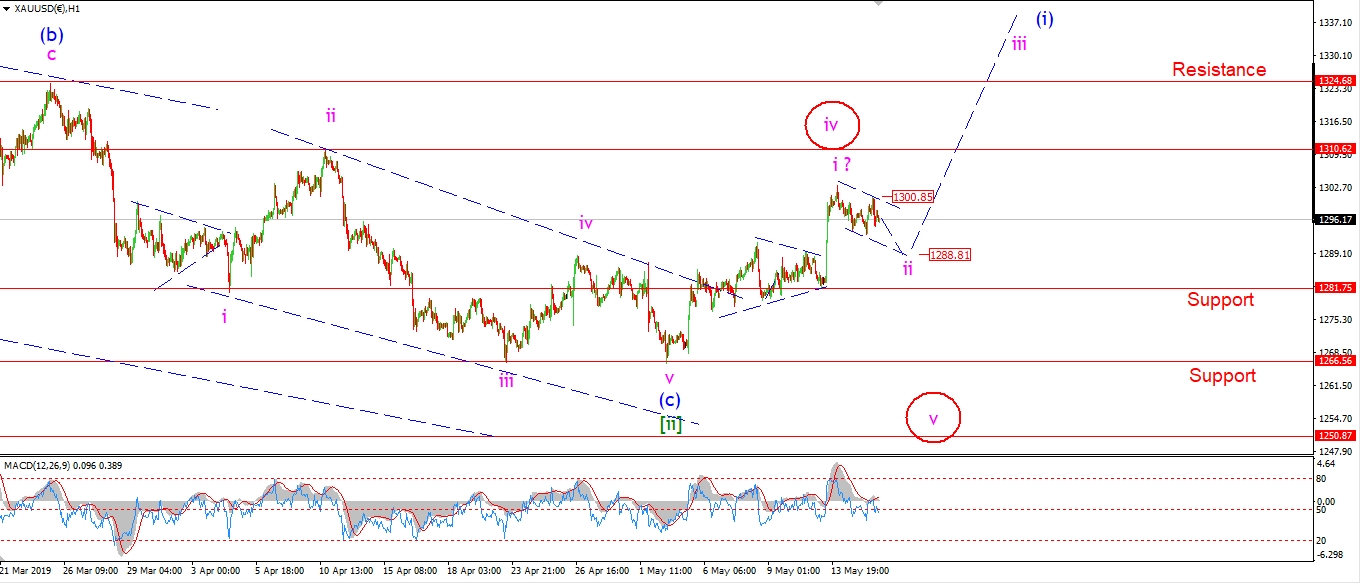 [/vc_column_text][/vc_column][vc_column width=”1/3″][vc_custom_heading text=”4 Hours” use_theme_fonts=”yes”][vc_column_text]
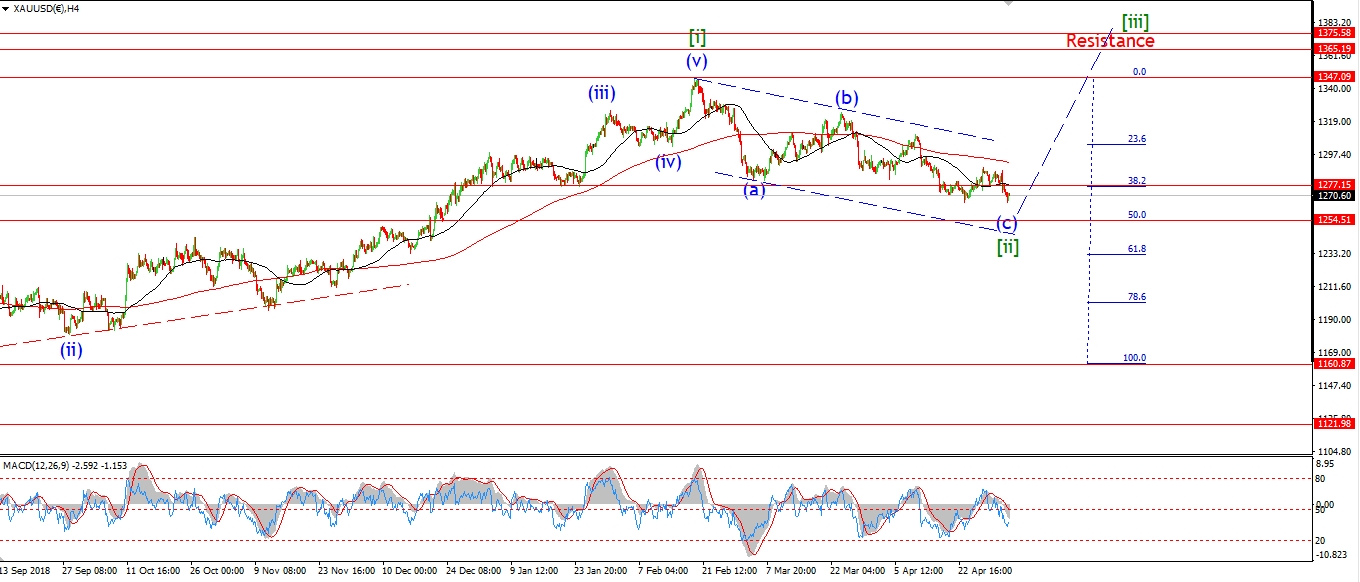 [/vc_column_text][vc_custom_heading text=”Daily” use_theme_fonts=”yes”][vc_column_text]
 [/vc_column_text][/vc_column][/vc_row]
[vc_row][vc_column][vc_column_text]
Gold rose today in three waves and just pipped above 1300 again before turning lower again.
This is likely a small ‘b’ wave lower high.
And the price is falling again this evening in wave ‘c’ of ‘ii’.
The trend channel suggests a target for wave ‘ii’ at about 1288
where price will meet the lower trend channel line.
When that happens,
we will have a bullish impulse wave complete in waves ‘i’ and ‘ii’.
And the market will be set for a rally in wave ‘iii’ back towards 1324.
Tomorrow;
Watch for gold to drop to the lower trend channel line again in wave ‘ii’ pink.
The price should find support at 1281.75 on the lower end.
[/vc_column_text][/vc_column][/vc_row]
[vc_row][vc_column][vc_separator border_width=”5″][/vc_column][/vc_row][vc_row][vc_column][vc_column_text]
U.S CRUDE OIL
[/vc_column_text][/vc_column][/vc_row][vc_row][vc_column][vc_separator border_width=”5″][/vc_column][/vc_row][vc_row][vc_column width=”2/3″][vc_custom_heading text=”1 hr” use_theme_fonts=”yes”][vc_column_text]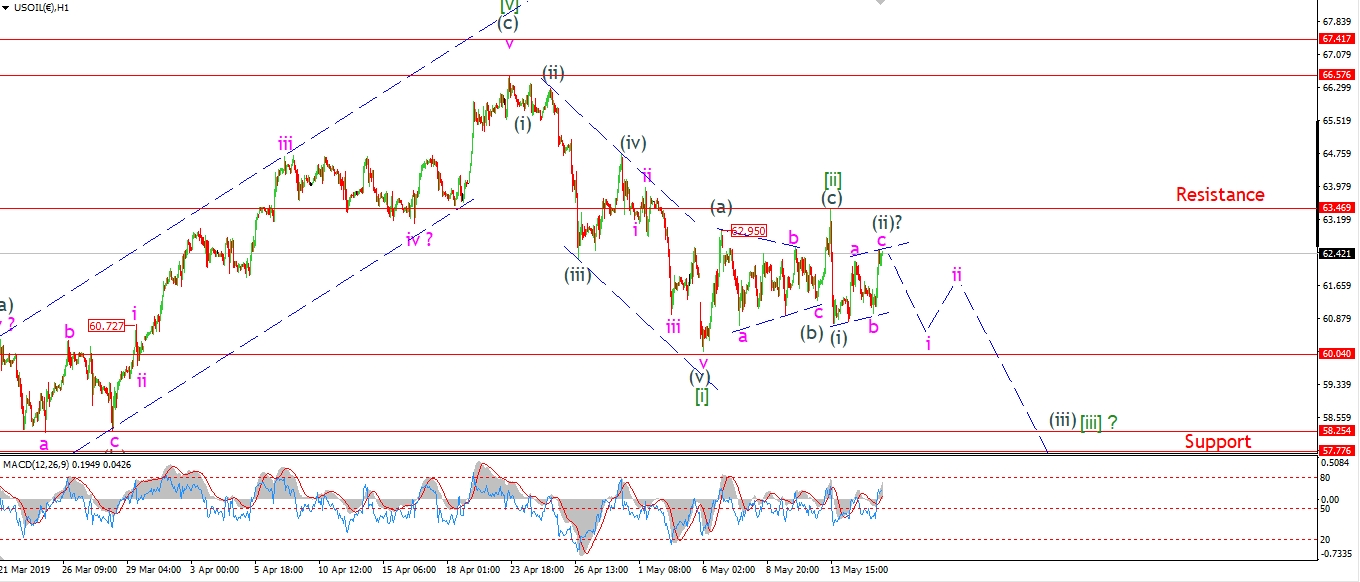 [/vc_column_text][/vc_column][vc_column width=”1/3″][vc_custom_heading text=”4 Hours” use_theme_fonts=”yes”][vc_column_text]
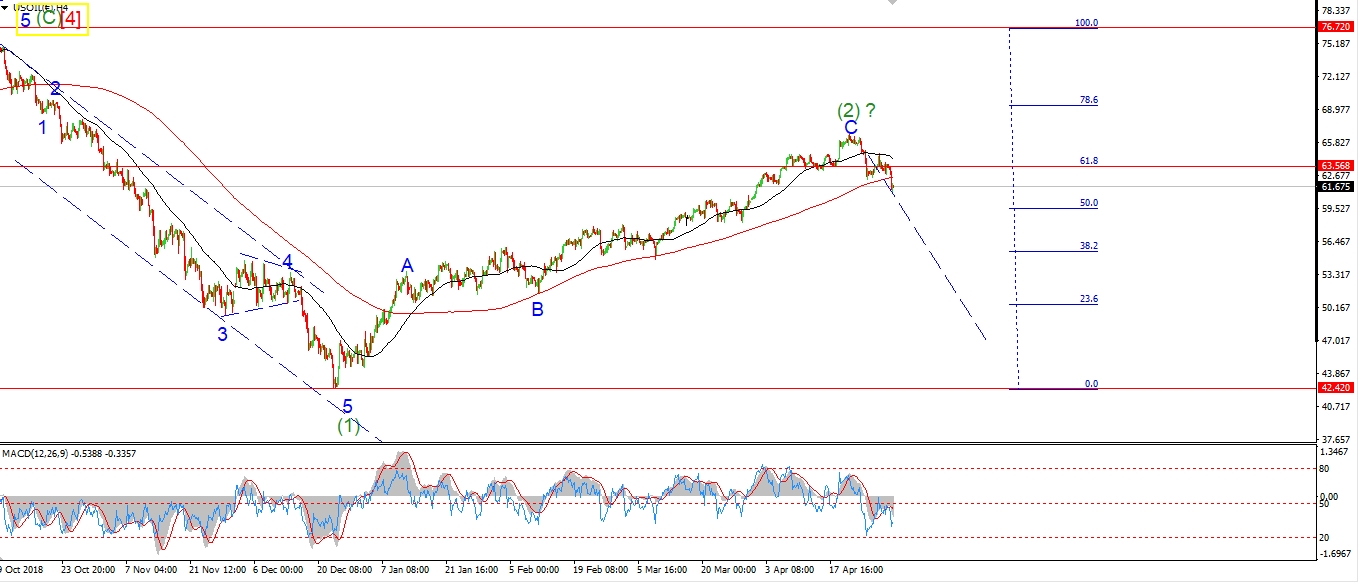 [/vc_column_text][vc_custom_heading text=”Daily” use_theme_fonts=”yes”][vc_column_text]
 [/vc_column_text][/vc_column][/vc_row]
[vc_row][vc_column][vc_column_text]
Crude is now completing a lower degree second wave at todays highs.
Wave (ii) has traced out a three wave flat correction as shown.
And we should now see wave (iii) of [iii] get underway over the coming sessions.
The high at wave [ii] lies at 63.46,
this level must not break for this short term count to remain valid.
And a break below the wave [i] low at 60.04 will confirm wave [iii] has begun.
This decline has been threatened for a while now,
and we should only be getting started on a long decline in wave [5] as shown on the daily chart.
Tomorrow;
Watch for confirmation that wave (ii) has completed
with a decline in wave ‘i’ of (iii) tomorrow.
63.46 must hold.
[/vc_column_text][/vc_column][/vc_row]
[vc_row][vc_column][vc_separator border_width=”5″][/vc_column][/vc_row][vc_row][vc_column][vc_column_text]
US 10 yr Treasuries.
[/vc_column_text][/vc_column][/vc_row][vc_row][vc_column][vc_separator border_width=”5″][/vc_column][/vc_row][vc_row][vc_column width=”2/3″][vc_custom_heading text=”1 hr” use_theme_fonts=”yes”][vc_column_text]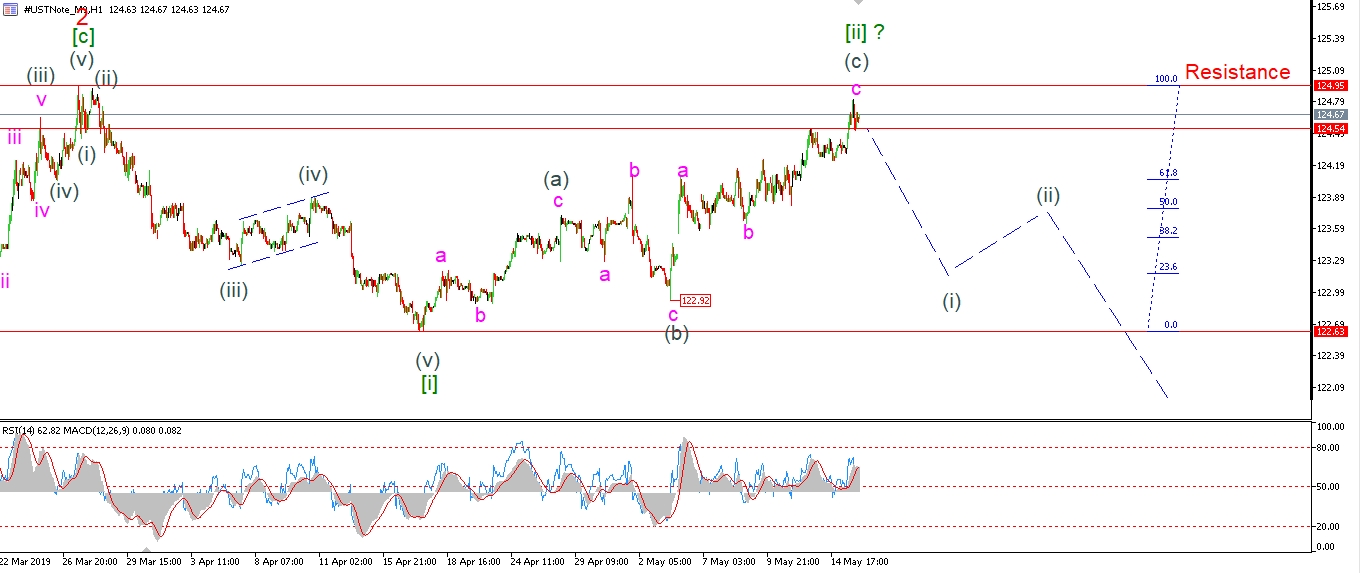 [/vc_column_text][/vc_column][vc_column width=”1/3″][vc_custom_heading text=”4 Hours” use_theme_fonts=”yes”][vc_column_text]
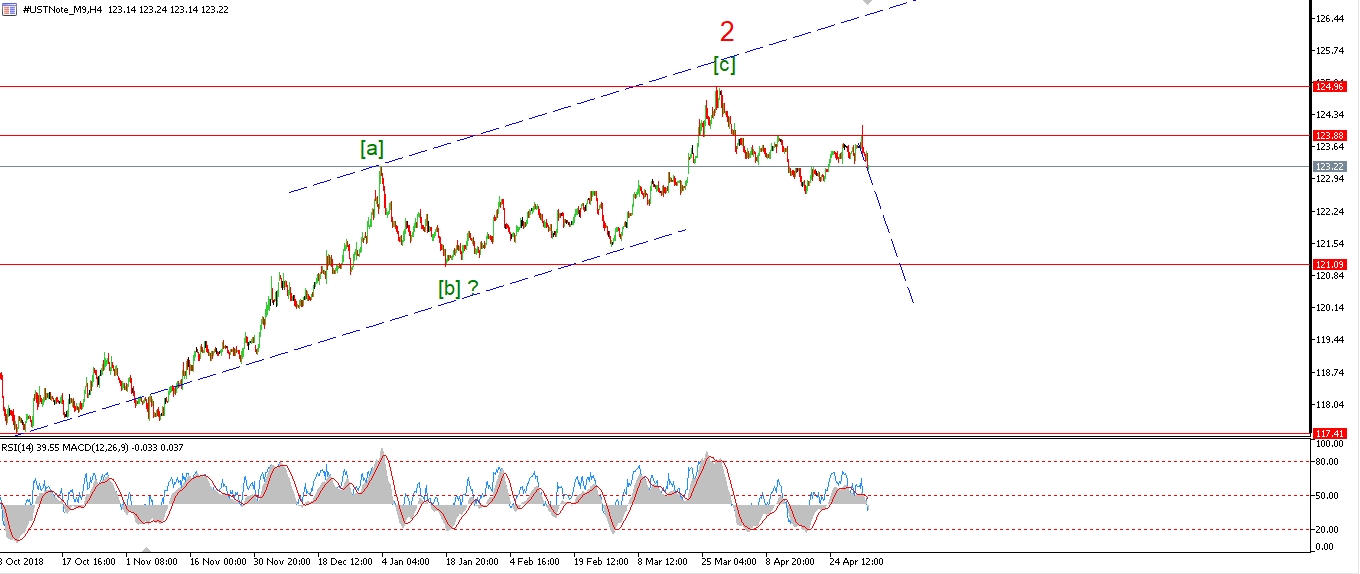 [/vc_column_text][vc_custom_heading text=”Daily” use_theme_fonts=”yes”][vc_column_text]
 [/vc_column_text][/vc_column][/vc_row]
[vc_row][vc_column][vc_column_text]
Although the price has pushed higher again today,
the market has not yet broken resistance at 124.95.
Also,
the action off the low labelled wave [i] is very corrective looking.
So at the moment,
Wave [ii] is still valid.
I cant see this rally continue much higher,
Even if resistance is broken, it will be a brief spike only.
https://www.tradingster.com/cot/futures/fin/043602
The overwhelming majority of the market is net long 10YR treasury notes.
In fact asset managers are net long at an historically bullish extreme.
Reaching a 10Yr high early this year.
They have only begun to trim down their positions in the last few months.
So we have not even seen the slightest hint of bearish market sentiment.
Tomorrow;
I am still looking for that bearish signal to complete.
Watch for resistance to hold and wave [iii] down to begin.
[/vc_column_text][/vc_column][/vc_row]
[vc_row][vc_column][vc_separator border_width=”5″][/vc_column][/vc_row][vc_row][vc_column][vc_column_text]
SILVER
[/vc_column_text][/vc_column][/vc_row][vc_row][vc_column][vc_separator border_width=”5″][/vc_column][/vc_row][vc_row][vc_column width=”2/3″][vc_custom_heading text=”1 hr” use_theme_fonts=”yes”][vc_column_text]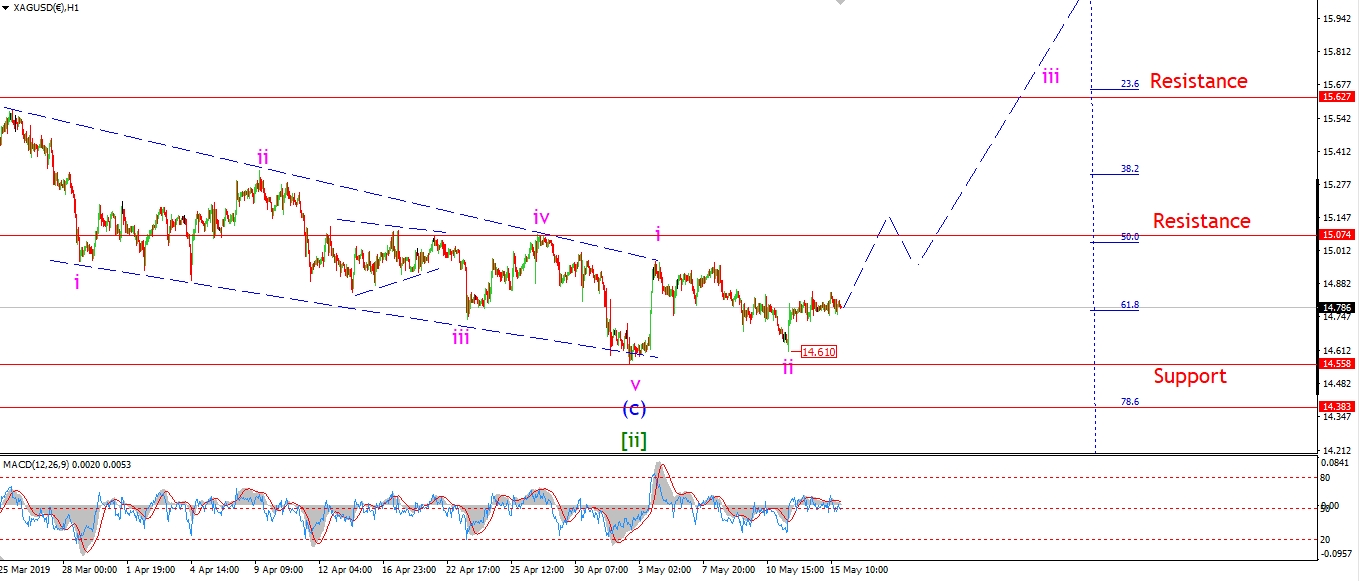 [/vc_column_text][/vc_column][vc_column width=”1/3″][vc_custom_heading text=”4 Hours” use_theme_fonts=”yes”][vc_column_text]
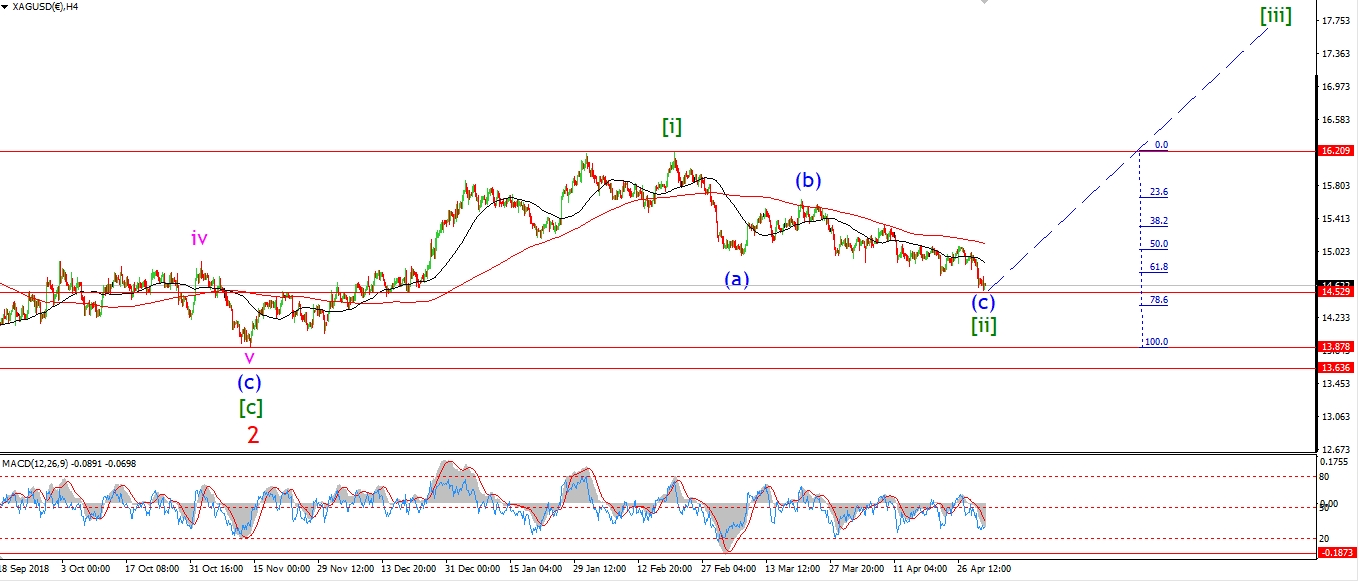 [/vc_column_text][vc_custom_heading text=”Daily” use_theme_fonts=”yes”][vc_column_text]
 [/vc_column_text][/vc_column][/vc_row]
[vc_row][vc_column][vc_column_text]
The action in Silver today was flat as a pancake.
It is as if the market is waiting for a nudge to kick off wave ‘iii’ up.
On a positive note,
the price is holding above 14.61 and the action looks corrective over the last few sessions.
Tomorrow;
All I can do now is await some bullish action to break 15.07 and confirm wave ‘iii’ up has begun.
[/vc_column_text][/vc_column][/vc_row]
[vc_row][vc_column][vc_separator border_width=”5″][/vc_column][/vc_row][vc_row][vc_column][vc_column_text]
S&P 500.
[/vc_column_text][/vc_column][/vc_row][vc_row][vc_column][vc_separator border_width=”5″][/vc_column][/vc_row][vc_row][vc_column width=”2/3″][vc_custom_heading text=”1 hr” use_theme_fonts=”yes”][vc_column_text]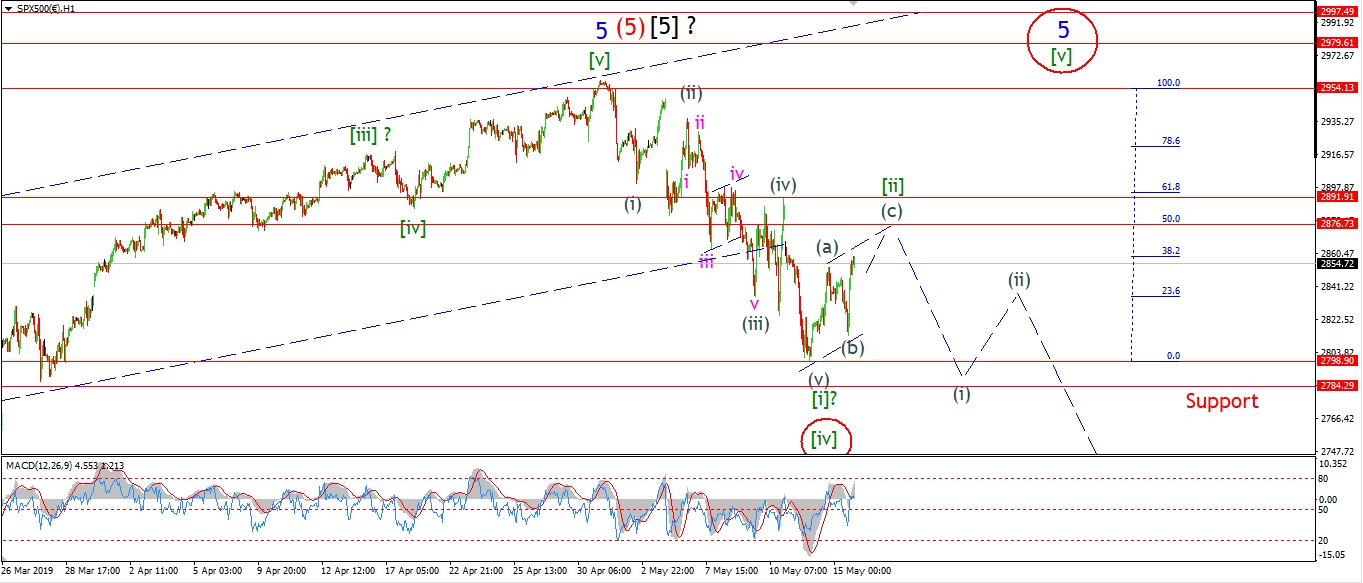 [/vc_column_text][/vc_column][vc_column width=”1/3″][vc_custom_heading text=”4 Hours” use_theme_fonts=”yes”][vc_column_text]
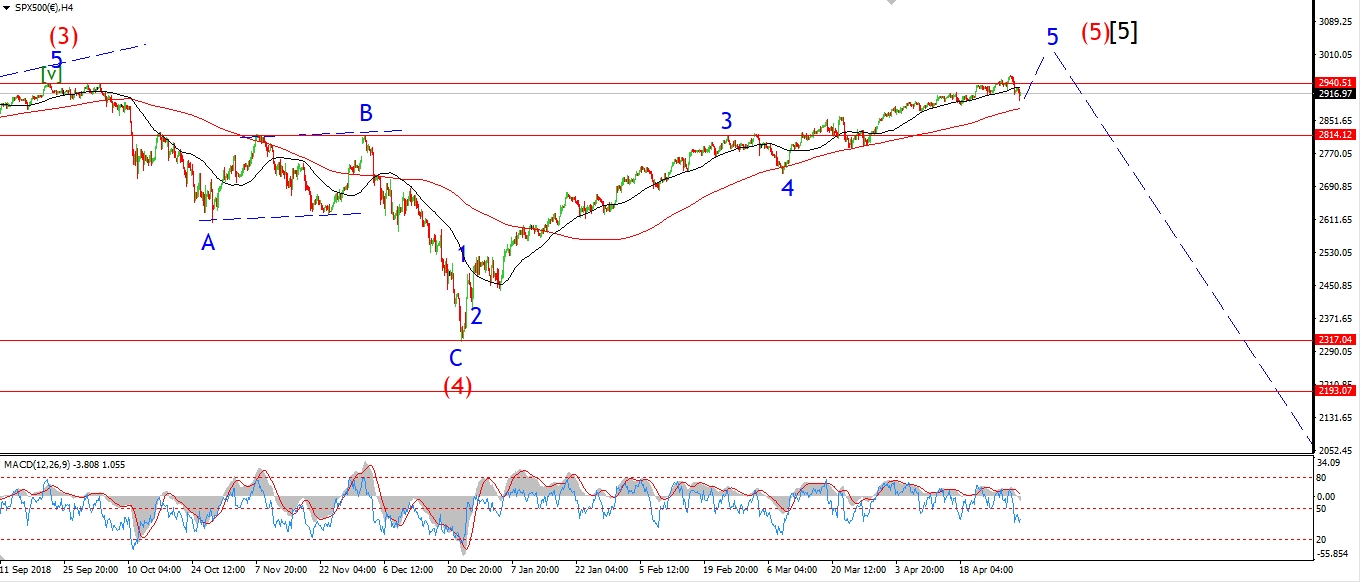 [/vc_column_text][vc_custom_heading text=”Daily” use_theme_fonts=”yes”][vc_column_text]
 [/vc_column_text][/vc_column][/vc_row]
[vc_row][vc_column][vc_column_text]
The S&P has traced out a three wave recovery also at todays highs,
breaking out above the wave (a) high this evening in wave (c) of [ii].
The price is hitting the upper trend channel line again this evening,
which suggests that this correction is nearing the end.
The 50% retracement level at 2876 is close at hand,
so this level remains the target for wave [ii].
When the market completes wave [ii],
we will be perfectly setup to fall in wave [iii].
Ad that should begin with another impulsive move lower as shown in waves (i) and (ii).
A break of 2798 will signal that wave [iii] has begun.
Tomorrow;
Watch for wave (c) of [ii] to complete at or near the 50% retracement level at 2876.
[/vc_column_text][/vc_column][/vc_row]
[vc_row][vc_column][vc_column_text]
[/vc_column_text][/vc_column][/vc_row]
[vc_row][vc_column][vc_separator border_width=”5″][/vc_column][/vc_row]