
[vc_row][vc_column][vc_separator border_width=”5″][/vc_column][/vc_row]
[vc_row][vc_column][vc_column_text]
Good evening friends.
[/vc_column_text][/vc_column][/vc_row]
[vc_row][vc_column][vc_separator border_width=”5″][/vc_column][/vc_row]
[vc_row][vc_column][vc_column_text]
EURUSD
[/vc_column_text][/vc_column][/vc_row]
[vc_row][vc_column][vc_separator border_width=”5″][/vc_column][/vc_row][vc_row][vc_column width=”2/3″][vc_custom_heading text=”1 hr” use_theme_fonts=”yes”][vc_column_text]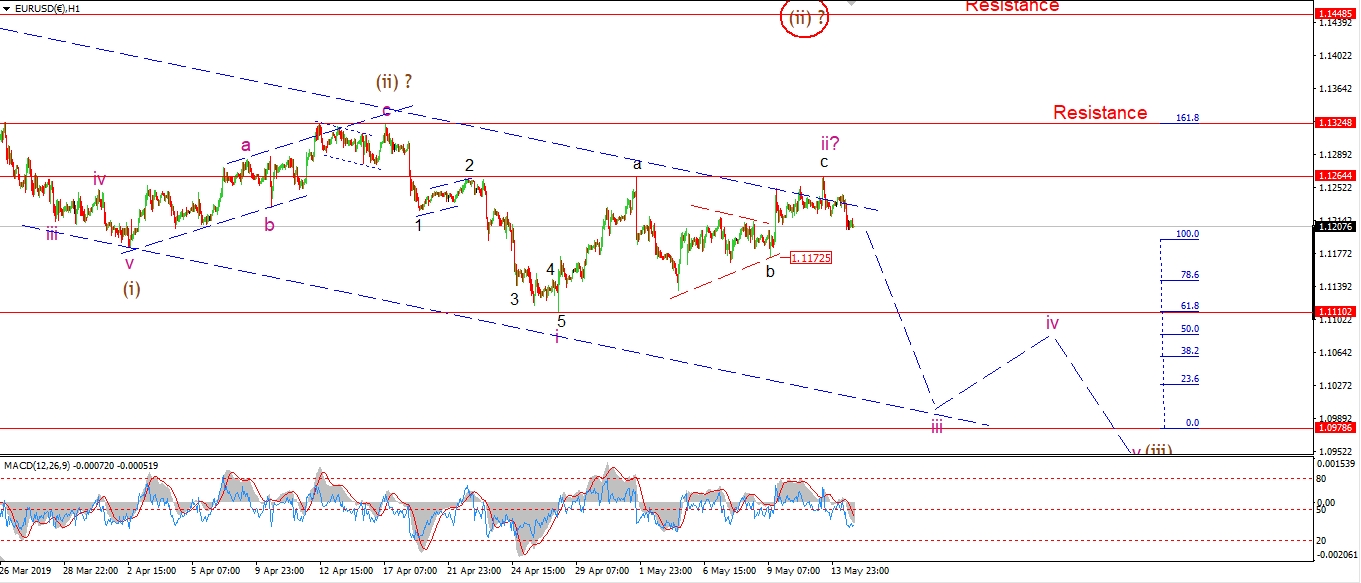 [/vc_column_text][/vc_column][vc_column width=”1/3″][vc_custom_heading text=”4 Hours” use_theme_fonts=”yes”][vc_column_text]
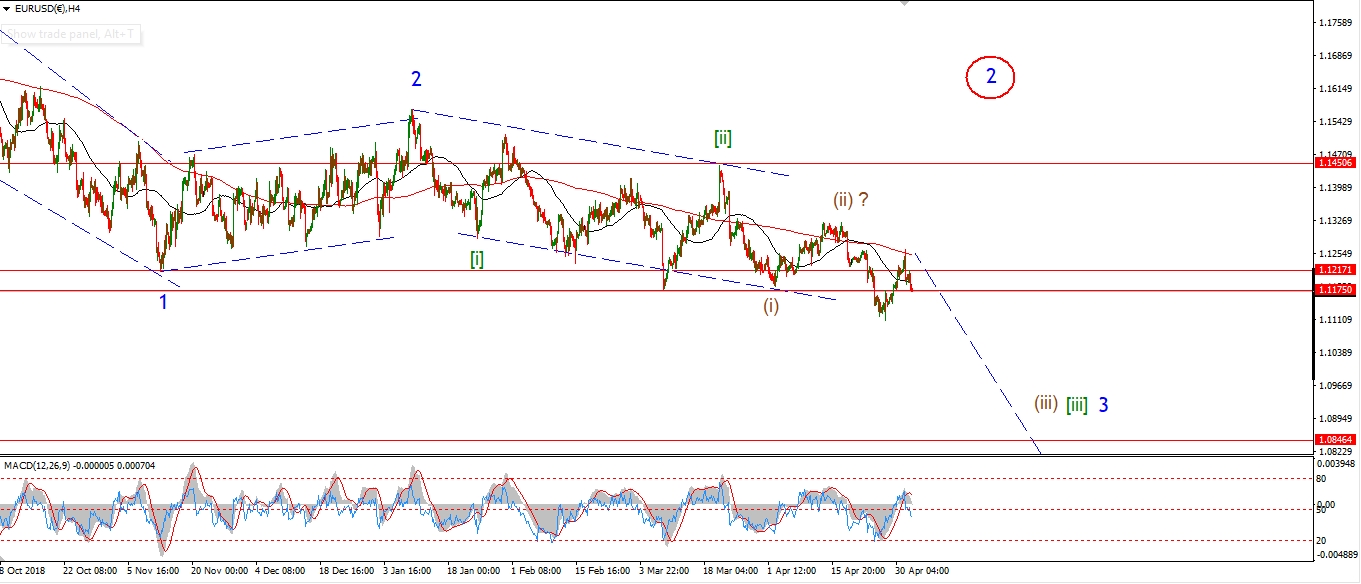 [/vc_column_text][vc_custom_heading text=”Daily” use_theme_fonts=”yes”][vc_column_text]
 [/vc_column_text][/vc_column][/vc_row]
[vc_row][vc_column][vc_column_text]
It’s a slow day again in EURUSD!
We have seen a decline off the wave ‘c’ high at 1.1264.
This decline off the high is in three waves so far,
and prices have held above the previous ‘b’ wave triangle at 1.1172.
So we don not have confirmation of wave ‘iii’ yet.
Tomorrow;
this decline must continue and develop into a five wave structure.
Watch for 1.1264 to hold and a decline below 1.1172 to begin wave ‘iii’ down.
[/vc_column_text][/vc_column][/vc_row]
[vc_row][vc_column][vc_separator border_width=”5″][/vc_column][/vc_row][vc_row][vc_column][vc_column_text]
GBPUSD
[/vc_column_text][/vc_column][/vc_row][vc_row][vc_column][vc_separator border_width=”5″][/vc_column][/vc_row][vc_row][vc_column width=”2/3″][vc_custom_heading text=”1 hr” use_theme_fonts=”yes”][vc_column_text]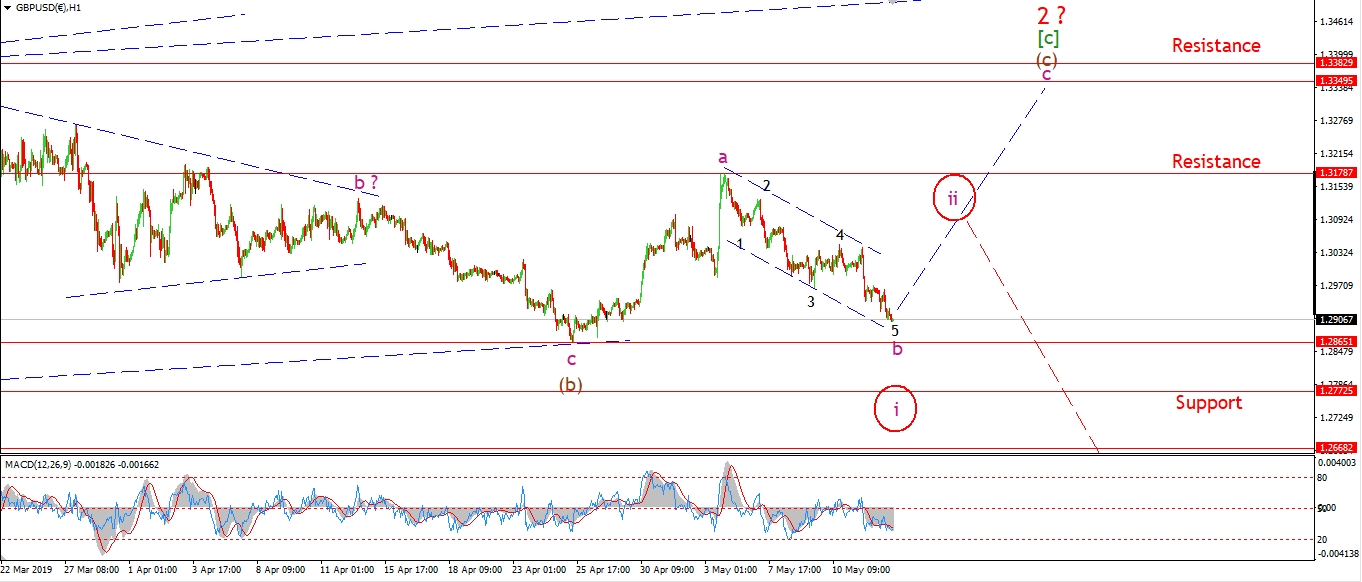 [/vc_column_text][/vc_column][vc_column width=”1/3″][vc_custom_heading text=”4 Hours” use_theme_fonts=”yes”][vc_column_text]
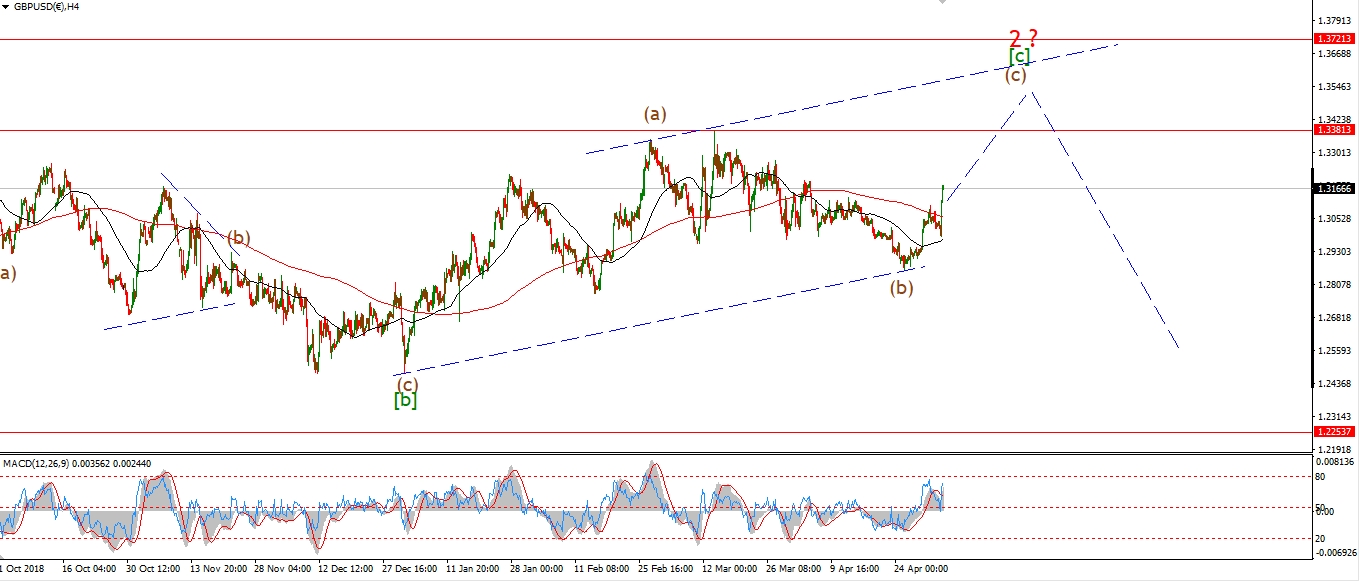 [/vc_column_text][vc_custom_heading text=”Daily” use_theme_fonts=”yes”][vc_column_text]
 [/vc_column_text][/vc_column][/vc_row]
[vc_row][vc_column][vc_column_text]
Cable has traced out an almost perfect five wave decline off 1.3178 over the last week.
I have shown the labeling for that five wave structure in black.
Right now,
the price structure is developing in line with the more bearish alternate count.
But I cannot dump the current count just yet.
If we get a three wave recovery off these lows,
then we can switch to a firmly bearish outlook in the short term.
Tomorrow;
Both wave counts call for a rise off the current levels.
If it is a corrective rise,
that will favor the alternate count.
[/vc_column_text][/vc_column][/vc_row]
[vc_row][vc_column][vc_separator border_width=”5″][/vc_column][/vc_row][vc_row][vc_column][vc_column_text]
USDJPY
[/vc_column_text][/vc_column][/vc_row][vc_row][vc_column][vc_separator border_width=”5″][/vc_column][/vc_row][vc_row][vc_column width=”2/3″][vc_custom_heading text=”1 hr” use_theme_fonts=”yes”][vc_column_text]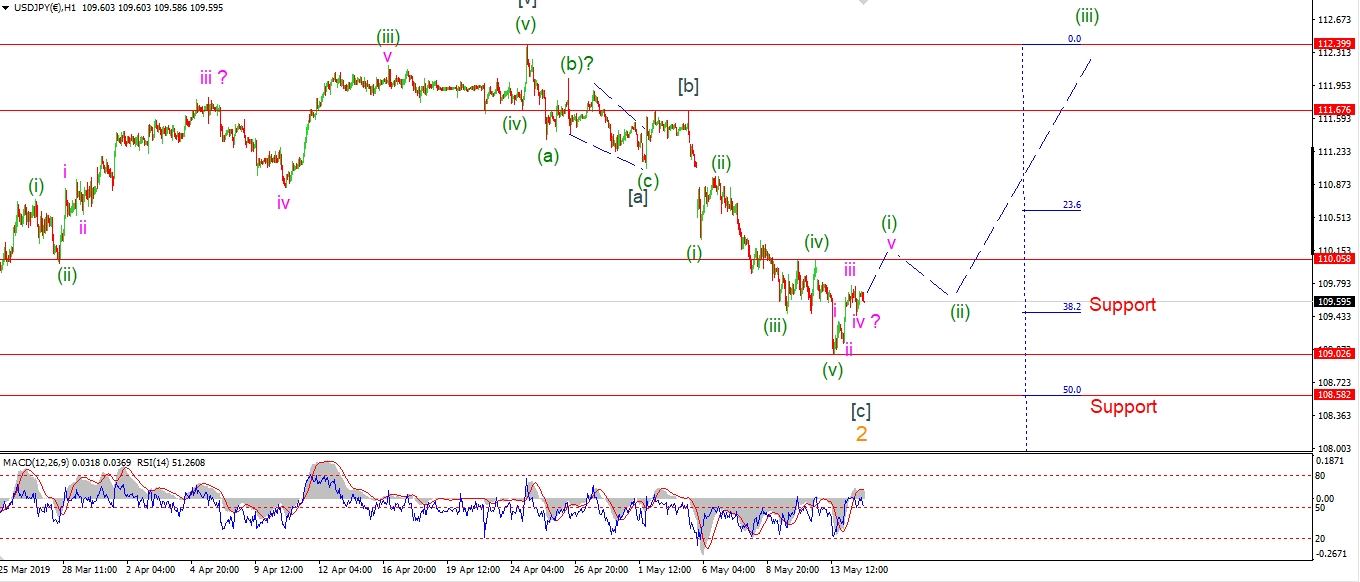 [/vc_column_text][/vc_column][vc_column width=”1/3″][vc_custom_heading text=”4 Hours” use_theme_fonts=”yes”][vc_column_text]
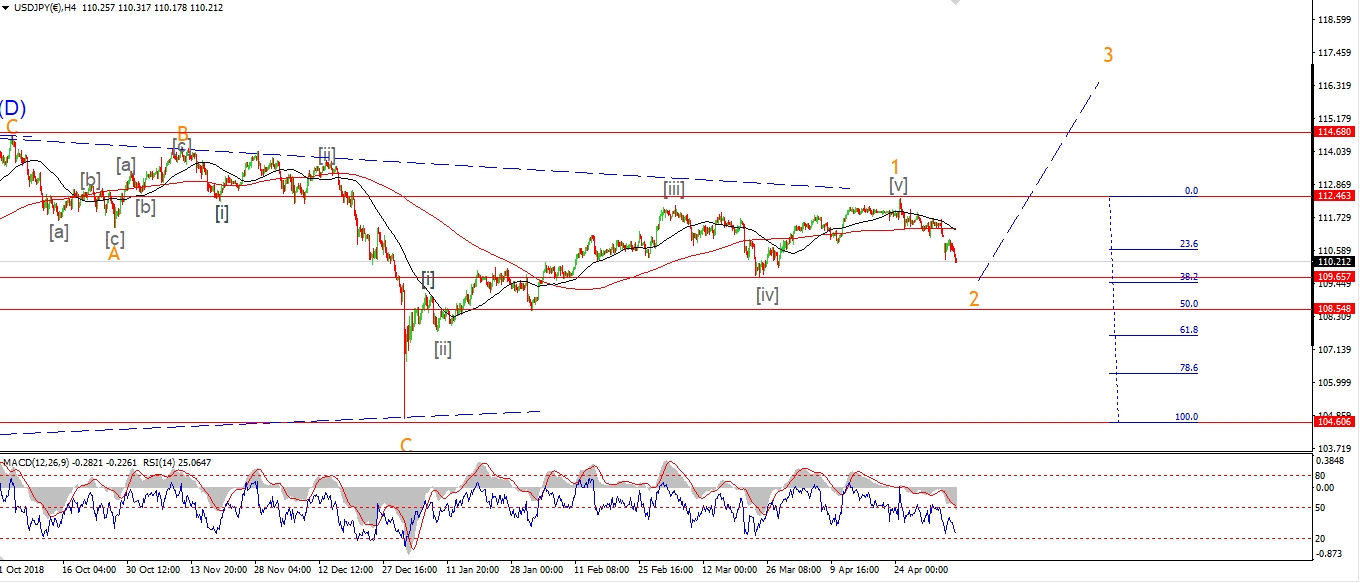 [/vc_column_text][vc_custom_heading text=”Daily” use_theme_fonts=”yes”][vc_column_text]
 [/vc_column_text][/vc_column][/vc_row]
[vc_row][vc_column][vc_column_text]
The rally off Mondays lows is developing in a five wave form so far.
This bullish price action is hinting that the correction in wave ‘2’ is now over.
So we may be looking at the beginning of a larger run up in wave ‘3’ just beginning.
If the price continues higher to break 110.05 at the previous fourth wave,
and then corrects in a three waves to a higher low,
that will be a clear signal that wave [i] of ‘3’ is in play.
Tomorrow;
Lets see if price pushes higher again to break the 110.05 level.
If the turn is here we should have a bullish impulse wave complete by Thursday evening.
[/vc_column_text][/vc_column][/vc_row]
[vc_row][vc_column][vc_separator border_width=”5″][/vc_column][/vc_row][vc_row][vc_column][vc_column_text]
DOW JONES INDUSTRIALS
[/vc_column_text][/vc_column][/vc_row][vc_row][vc_column][vc_separator border_width=”5″][/vc_column][/vc_row][vc_row][vc_column width=”2/3″][vc_custom_heading text=”1 hr” use_theme_fonts=”yes”][vc_column_text]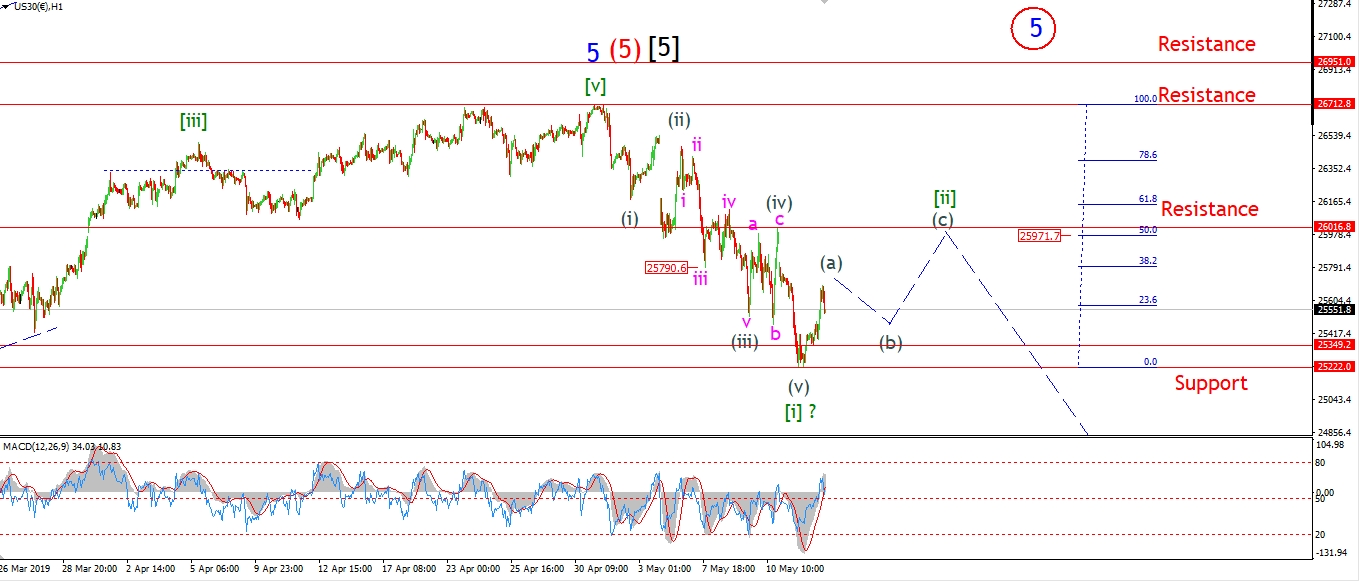 [/vc_column_text][/vc_column][vc_column width=”1/3″][vc_custom_heading text=”4 Hours” use_theme_fonts=”yes”][vc_column_text]
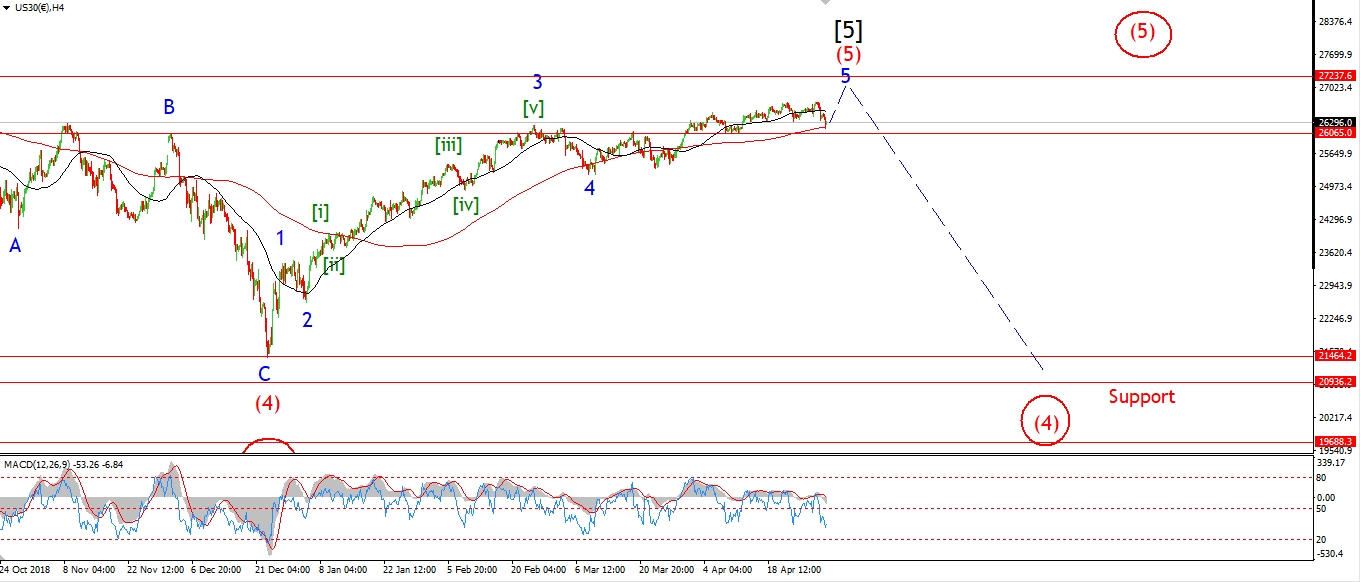 [/vc_column_text][vc_custom_heading text=”Daily” use_theme_fonts=”yes”][vc_column_text]
 [/vc_column_text][/vc_column][/vc_row]
[vc_row][vc_column][vc_column_text]
The market rebounded today after completing a five wave decline in wave [i] as shown.
Todays rally should begin a three wave corrective recovery in wave [ii] green.
And if that happens,
We will have a clear impulse wave lower completed,
and the market will be set to fall rapidly in a third wave.
The initial target for wave [ii] lies at the previous fourth wave at 26016.
Which lines up nicely with the 50% retracement level at 25971.
That area does not have to be hit,
but it is fairly typical for a second wave to retrace into that territory.
Tomorrow;
It’s impossible to know what type of correction wave [ii] will create,
short of saying that wave [ii] should be in three waves.
Watch for wave (a) of [ii] to complete,
And then wave (b) should create a higher low.
[/vc_column_text][/vc_column][/vc_row]
[vc_row][vc_column][vc_separator border_width=”5″][/vc_column][/vc_row][vc_row][vc_column][vc_column_text]
GOLD
[/vc_column_text][/vc_column][/vc_row][vc_row][vc_column][vc_separator border_width=”5″][/vc_column][/vc_row][vc_row][vc_column width=”2/3″][vc_custom_heading text=”1 hr” use_theme_fonts=”yes”][vc_column_text]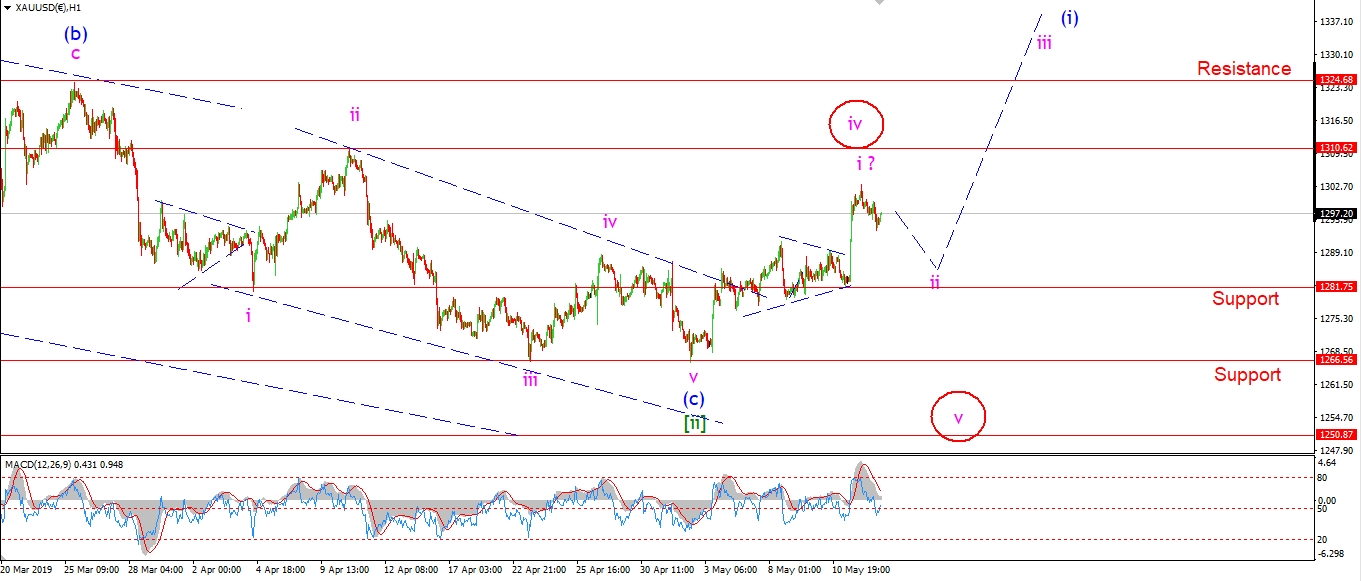 [/vc_column_text][/vc_column][vc_column width=”1/3″][vc_custom_heading text=”4 Hours” use_theme_fonts=”yes”][vc_column_text]
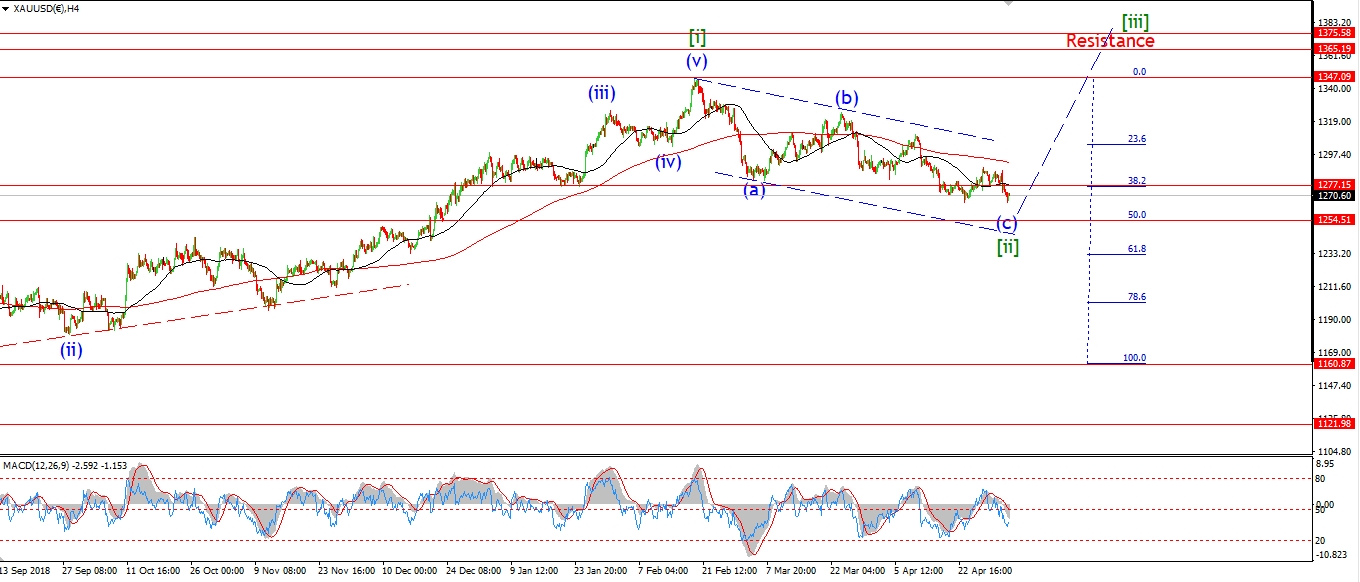 [/vc_column_text][vc_custom_heading text=”Daily” use_theme_fonts=”yes”][vc_column_text]
 [/vc_column_text][/vc_column][/vc_row]
[vc_row][vc_column][vc_column_text]
Gold is dropping off the wave ‘i’ high in a corrective manner today.
Wave ‘ii’ is expected to find support at the level of the triangle that completed on Monday morning at 1281.96.
So I suspect that this decline will continue tomorrow
and trace out a larger three wave structure.
Once the corrective higher low is in place at 1281 or so,
that will signal wave ‘iii’ up is about to begin.
wave ‘iii’ should carry us back above 1324 again with relative ease.
Tomorrow;
Watch for wave ‘ii’ to continue to correct lower in three waves and complete in the area of 1281.
[/vc_column_text][/vc_column][/vc_row]
[vc_row][vc_column][vc_separator border_width=”5″][/vc_column][/vc_row][vc_row][vc_column][vc_column_text]
U.S CRUDE OIL
[/vc_column_text][/vc_column][/vc_row][vc_row][vc_column][vc_separator border_width=”5″][/vc_column][/vc_row][vc_row][vc_column width=”2/3″][vc_custom_heading text=”1 hr” use_theme_fonts=”yes”][vc_column_text]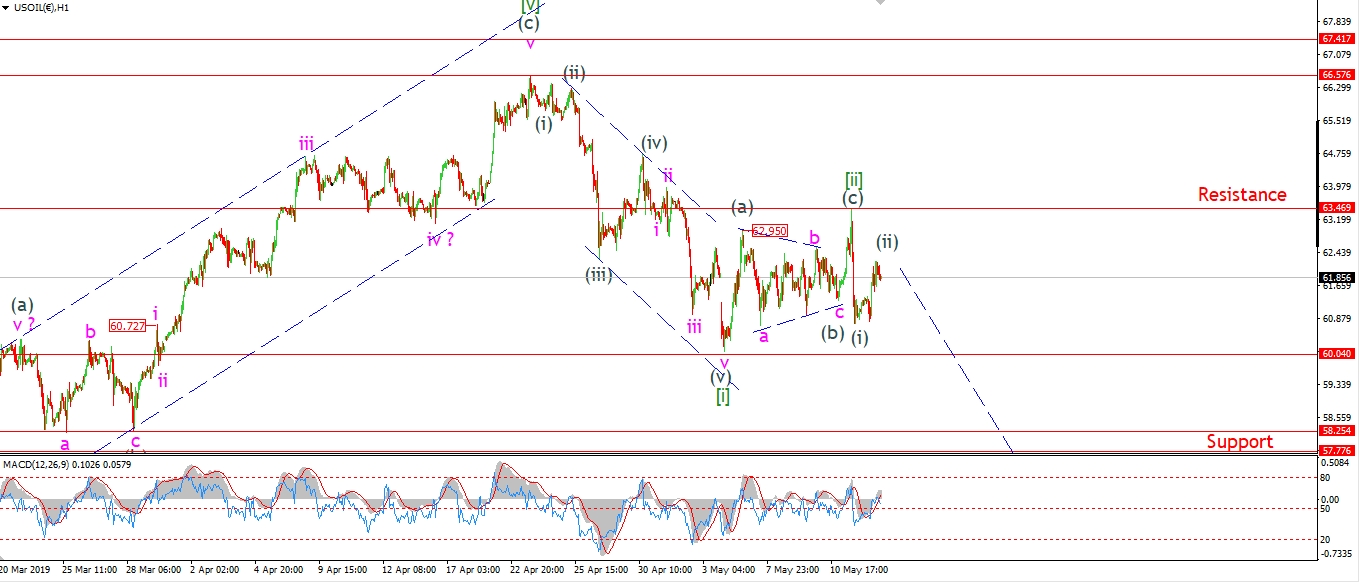 [/vc_column_text][/vc_column][vc_column width=”1/3″][vc_custom_heading text=”4 Hours” use_theme_fonts=”yes”][vc_column_text]
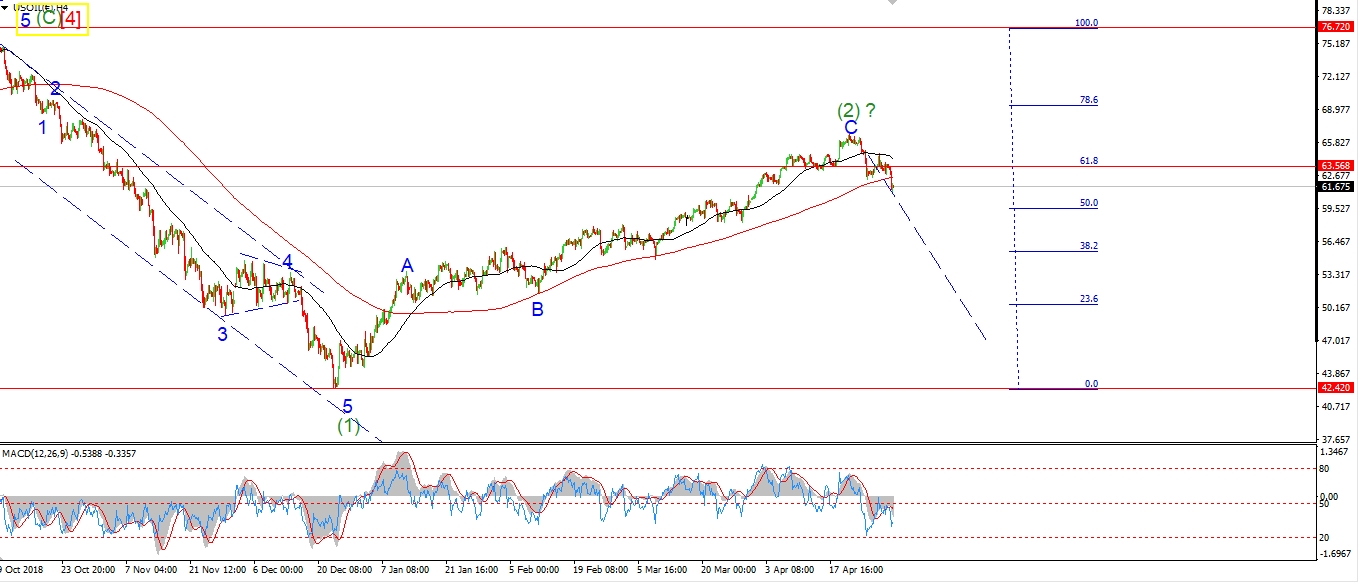 [/vc_column_text][vc_custom_heading text=”Daily” use_theme_fonts=”yes”][vc_column_text]
 [/vc_column_text][/vc_column][/vc_row]
[vc_row][vc_column][vc_column_text]
Crude bounced off Mondays low also,
but the rise is in three waves at this point,
which suggests that todays move is a correction higher.
The wave count calls for a three wave corrective rise in wave (ii) grey.
Wave (ii) could develop into a larger three wave structure of course.
But for now,
we have a series of 1,2 waves off the high in place,
with wave (iii) down expected to carry the price lower for the rest of the week.
Tomorrow;
Wave (ii) grey must hold below 63.46 at wave [ii] green.
Watch for a decline to begin tomorrow in wave (iii) of [iii].
A break of 60.04 will signal confirm wave [iii] down.
[/vc_column_text][/vc_column][/vc_row]
[vc_row][vc_column][vc_separator border_width=”5″][/vc_column][/vc_row][vc_row][vc_column][vc_column_text]
US 10 yr Treasuries.
[/vc_column_text][/vc_column][/vc_row][vc_row][vc_column][vc_separator border_width=”5″][/vc_column][/vc_row][vc_row][vc_column width=”2/3″][vc_custom_heading text=”1 hr” use_theme_fonts=”yes”][vc_column_text]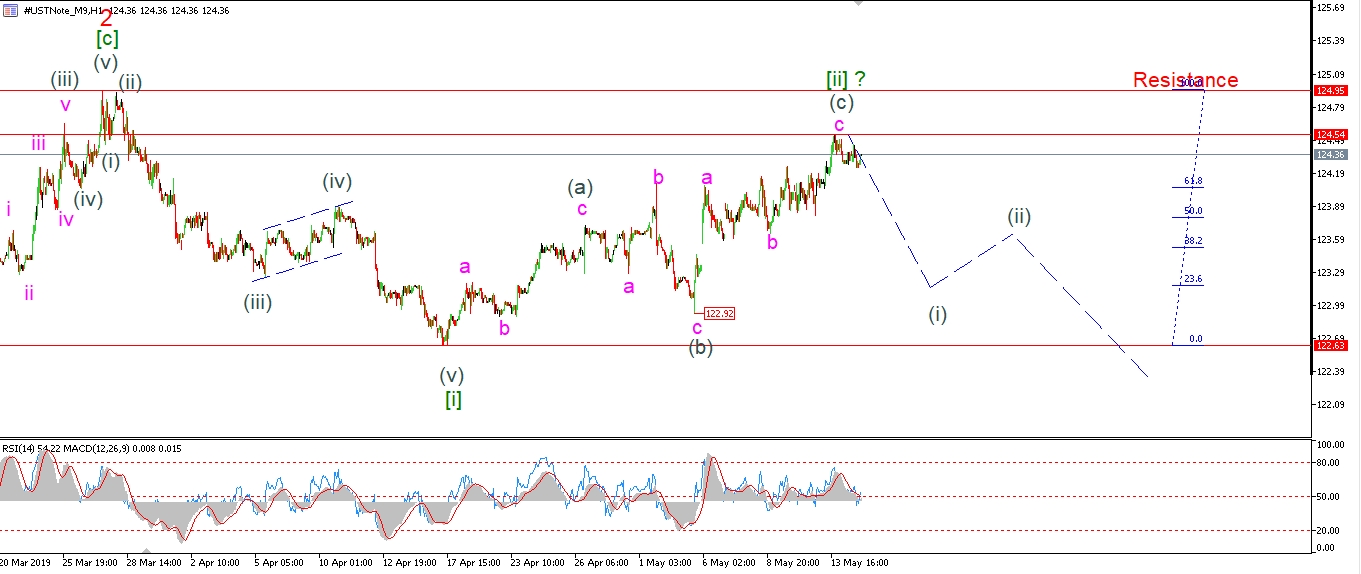 [/vc_column_text][/vc_column][vc_column width=”1/3″][vc_custom_heading text=”4 Hours” use_theme_fonts=”yes”][vc_column_text]
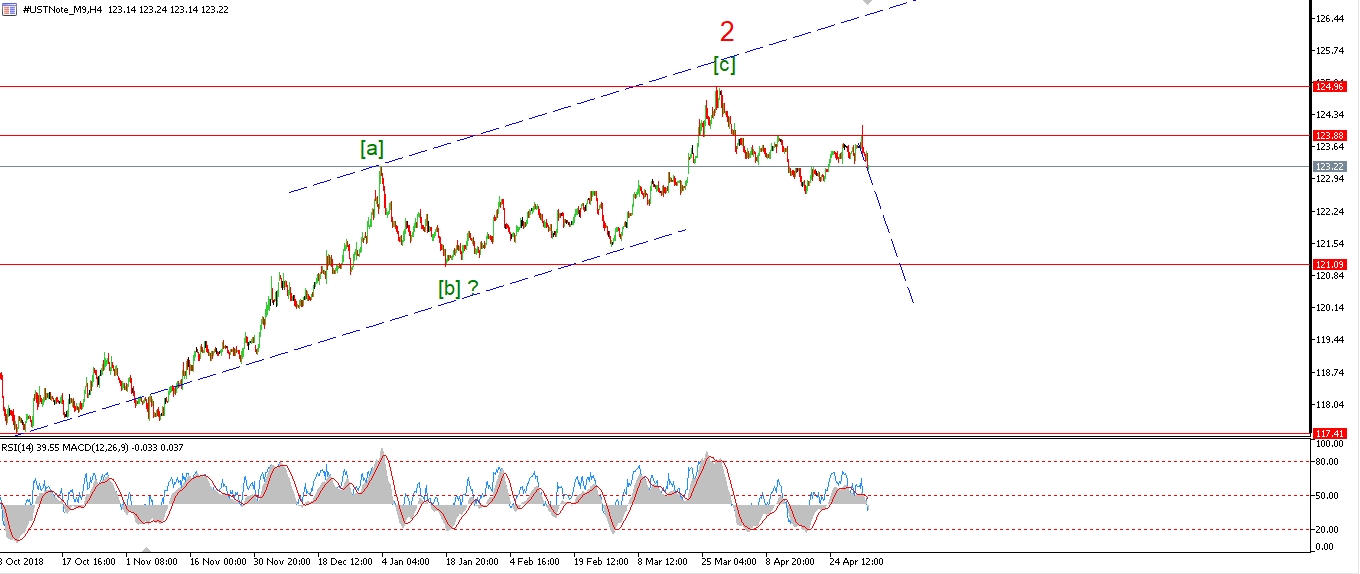 [/vc_column_text][vc_custom_heading text=”Daily” use_theme_fonts=”yes”][vc_column_text]
 [/vc_column_text][/vc_column][/vc_row]
[vc_row][vc_column][vc_column_text]
The 10YR is lower off the recent high labelled wave [ii].
The decline is too shallow yet to be sure what is happening.
the bottom line remains,
Price must hold below 124.95 and continue to drop in five waves.
This will indicate a reversal to the downside in wave [iii] has begun.
Tomorrow;
Watch for 124.54 to hold and for wave (i) to continue lower.
[/vc_column_text][/vc_column][/vc_row]
[vc_row][vc_column][vc_separator border_width=”5″][/vc_column][/vc_row][vc_row][vc_column][vc_column_text]
SILVER
[/vc_column_text][/vc_column][/vc_row][vc_row][vc_column][vc_separator border_width=”5″][/vc_column][/vc_row][vc_row][vc_column width=”2/3″][vc_custom_heading text=”1 hr” use_theme_fonts=”yes”][vc_column_text]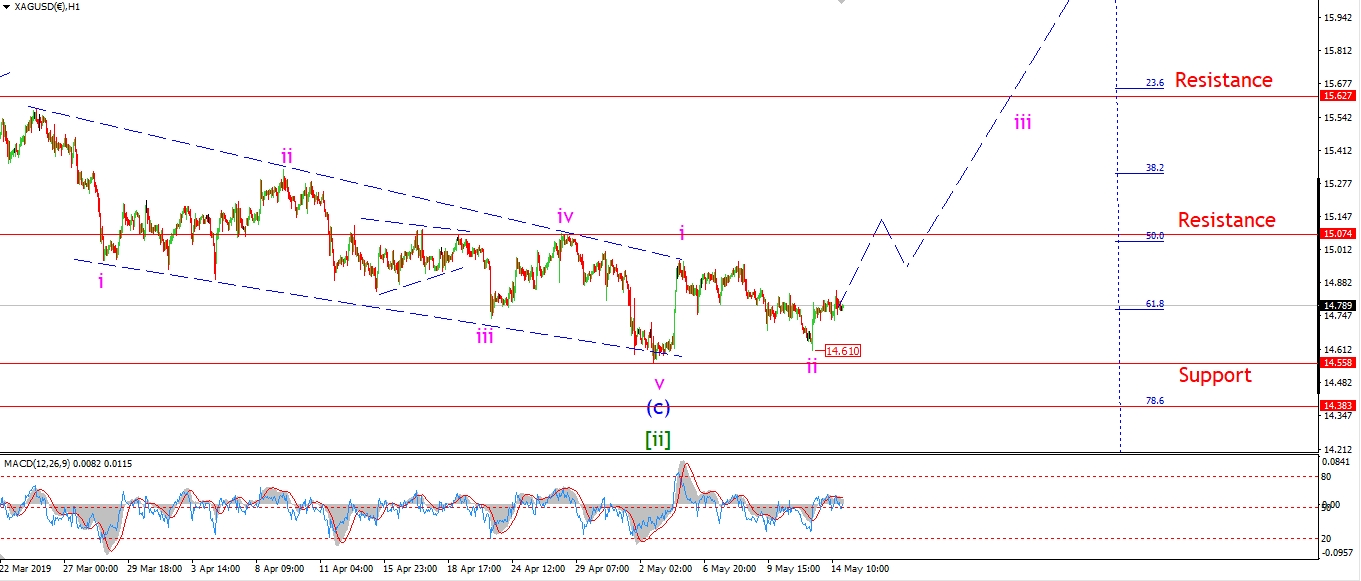 [/vc_column_text][/vc_column][vc_column width=”1/3″][vc_custom_heading text=”4 Hours” use_theme_fonts=”yes”][vc_column_text]
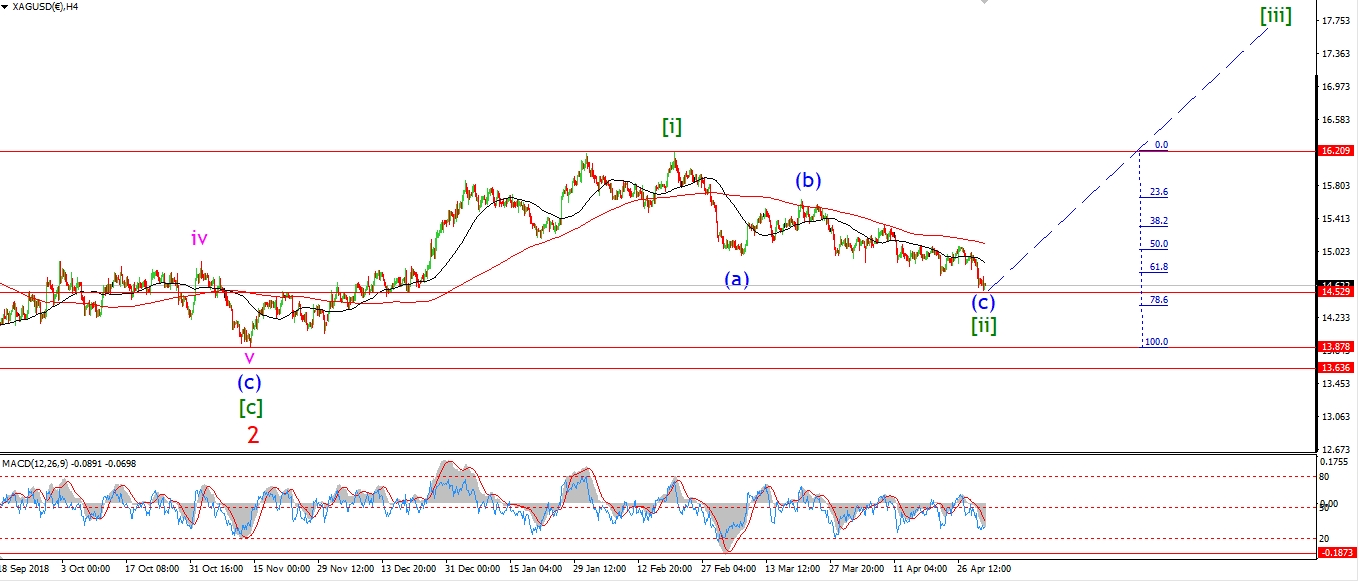 [/vc_column_text][vc_custom_heading text=”Daily” use_theme_fonts=”yes”][vc_column_text]
 [/vc_column_text][/vc_column][/vc_row]
[vc_row][vc_column][vc_column_text]
Silver is holding up above that 1461 level labelled wave ‘ii’.
Wave ‘iii’ must now continue to push higher,
and break above 15.07 again in order to strengthen the bullish case.
In the bigger picture technical setup,
Daily momentum has flat-lined in negative territory for over a year now.
4hr momentum is trending positive off an extreme oversold position.
And the net positions of futures traders on the COT,
shows a market that is positioned at a bearish extreme,
which is very similar to the setup in 2016.
This all points to a longer term bullish setup.
Tomorrow;
watch for 14.61 to hold and a rally above 15.07 to begin wave ‘iii’ up.
[/vc_column_text][/vc_column][/vc_row]
[vc_row][vc_column][vc_separator border_width=”5″][/vc_column][/vc_row][vc_row][vc_column][vc_column_text]
S&P 500.
[/vc_column_text][/vc_column][/vc_row][vc_row][vc_column][vc_separator border_width=”5″][/vc_column][/vc_row][vc_row][vc_column width=”2/3″][vc_custom_heading text=”1 hr” use_theme_fonts=”yes”][vc_column_text]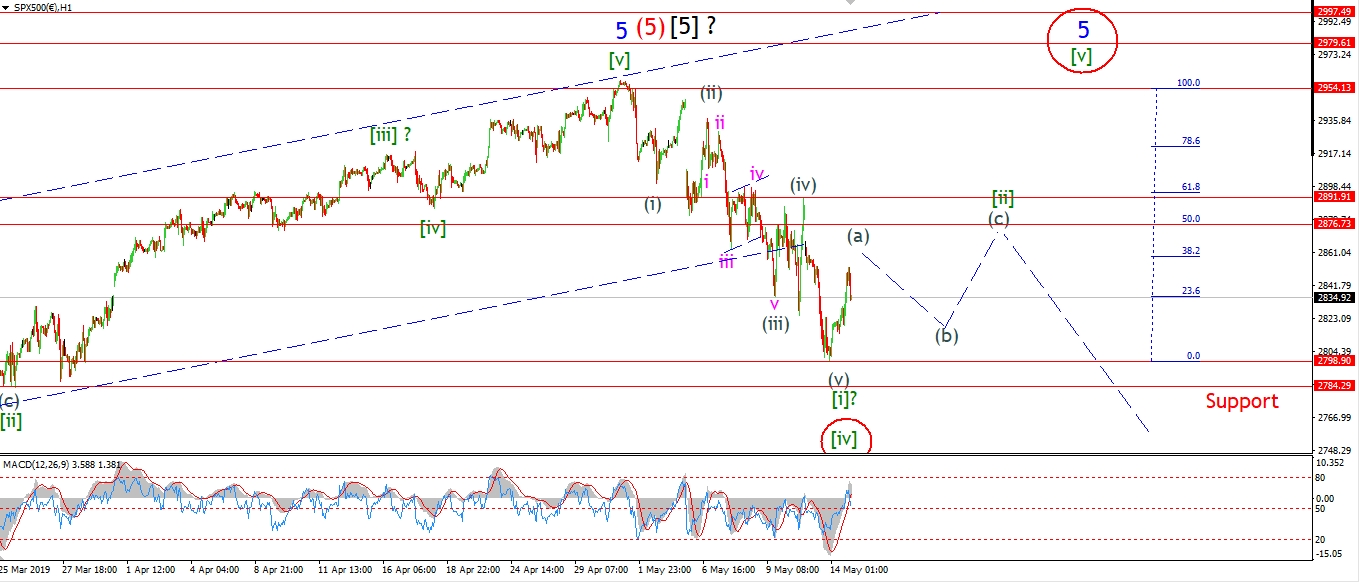 [/vc_column_text][/vc_column][vc_column width=”1/3″][vc_custom_heading text=”4 Hours” use_theme_fonts=”yes”][vc_column_text]
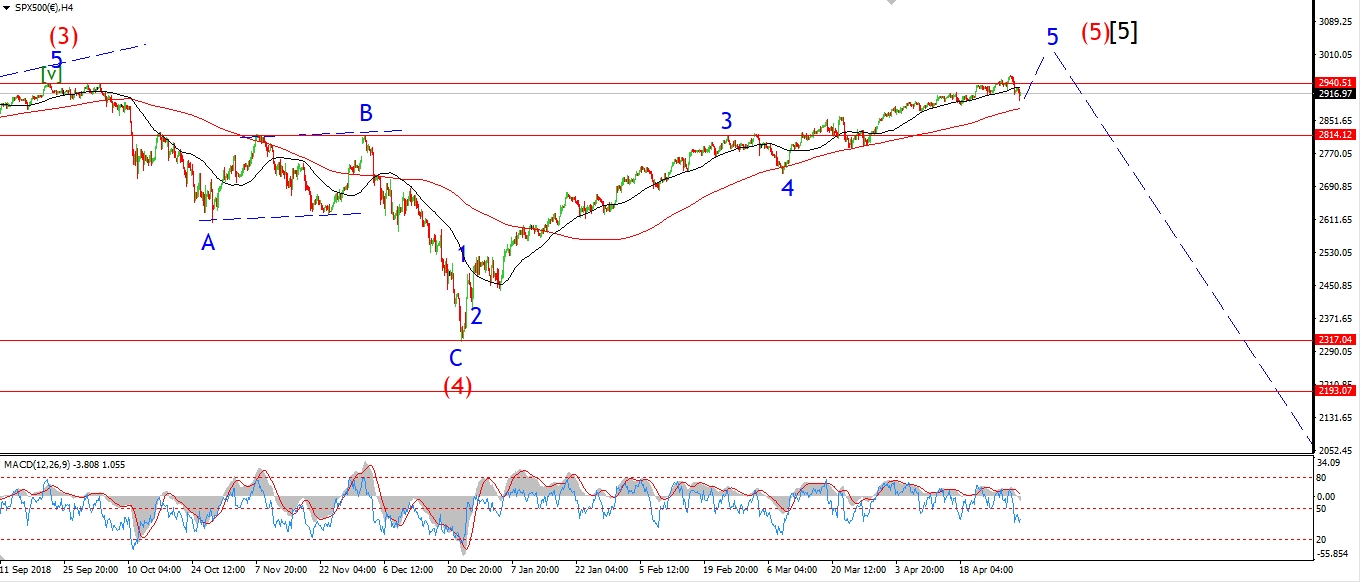 [/vc_column_text][vc_custom_heading text=”Daily” use_theme_fonts=”yes”][vc_column_text]
 [/vc_column_text][/vc_column][/vc_row]
[vc_row][vc_column][vc_column_text]
The S&P has completed five waves down off the all time high at 2954 on May 1st.
This is labelled wave [i] on the short term chart.
The market had a solid rally today which is labelled wave (a) of [ii].
Wave (a) looks like a three wave rise,
so the larger wave [ii] should trace out a flat correction with a 3,3,5 internal structure.
Wave (b) is now expected to decline in three waves to a higher low above 2798.
The market is selling again as we approach the close this evening,
This may be the beginning for that wave (b).
And then wave (c) should rally towards the end of the week
to complete the larger three wave correction.
The target for wave [ii] lies between 2876 at the 50% retracement level,
and 2891 at the previous fourth wave.
Tomorrow;
Watch for wave (b) of [ii] to fall back towards 2820 again in three waves.
[/vc_column_text][/vc_column][/vc_row]
[vc_row][vc_column][vc_column_text]
[/vc_column_text][/vc_column][/vc_row]
[vc_row][vc_column][vc_separator border_width=”5″][/vc_column][/vc_row]