
[vc_row][vc_column][vc_separator border_width=”5″][/vc_column][/vc_row]
[vc_row][vc_column][vc_column_text]
Good evening friends.
Things are really starting to look interesting in the stock market again!
The DOW seems to have topped in a failed fifth wave recently.
And off that top we are moving lower in five waves.
The big question is,
does this sell-off turn into a crash.
We should know soon enough when a corrective lower high forms.
But for now,
I can say that there is ever potential this is the beginning of the end for the 10yr old bull market!
Down to it.
[/vc_column_text][/vc_column][/vc_row]
[vc_row][vc_column][vc_separator border_width=”5″][/vc_column][/vc_row]
[vc_row][vc_column][vc_column_text]
EURUSD
[/vc_column_text][/vc_column][/vc_row]
[vc_row][vc_column][vc_separator border_width=”5″][/vc_column][/vc_row][vc_row][vc_column width=”2/3″][vc_custom_heading text=”1 hr” use_theme_fonts=”yes”][vc_column_text]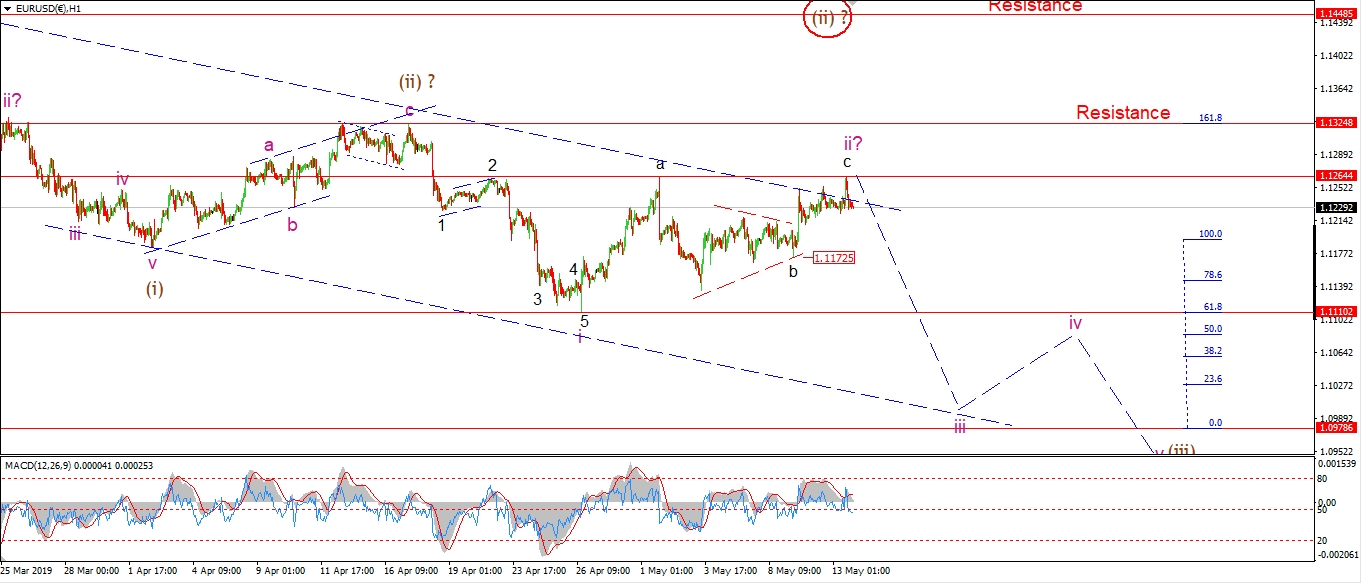 [/vc_column_text][/vc_column][vc_column width=”1/3″][vc_custom_heading text=”4 Hours” use_theme_fonts=”yes”][vc_column_text]
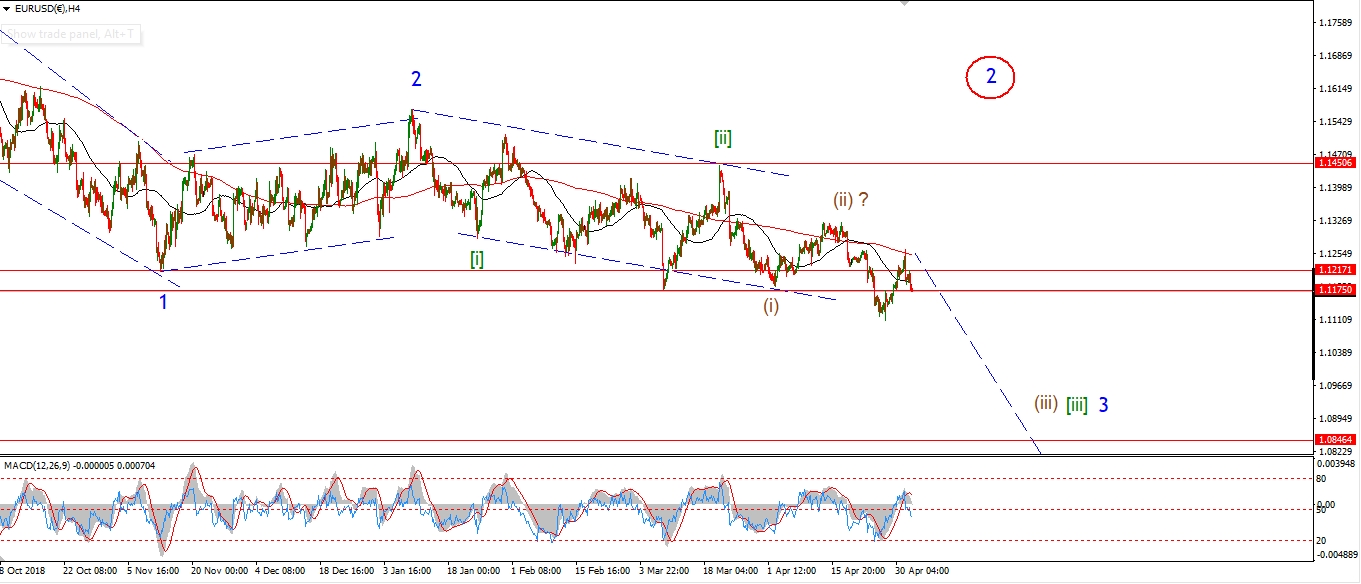 [/vc_column_text][vc_custom_heading text=”Daily” use_theme_fonts=”yes”][vc_column_text]
 [/vc_column_text][/vc_column][/vc_row]
[vc_row][vc_column][vc_column_text]
EURUSD hit the minimum target at 1.1264 today
to complete a possible wave ‘c’ of ‘ii’.
The price has reversed lower off that level again this evening.
If wave ‘iii’ down is now underway,
then we should see a sharp drop off this level to break below 1.1172 at wave ‘b’ of ‘ii’.
That action sill signal wave ‘iii’ has begun.
Tomorrow;
watch for wave ‘iii’ down to begin with a break of 1.1172.
A break of the wave ‘i’ low at 1.1110 will confirm wave ‘iii’.
[/vc_column_text][/vc_column][/vc_row]
[vc_row][vc_column][vc_separator border_width=”5″][/vc_column][/vc_row][vc_row][vc_column][vc_column_text]
GBPUSD
[/vc_column_text][/vc_column][/vc_row][vc_row][vc_column][vc_separator border_width=”5″][/vc_column][/vc_row][vc_row][vc_column width=”2/3″][vc_custom_heading text=”1 hr” use_theme_fonts=”yes”][vc_column_text]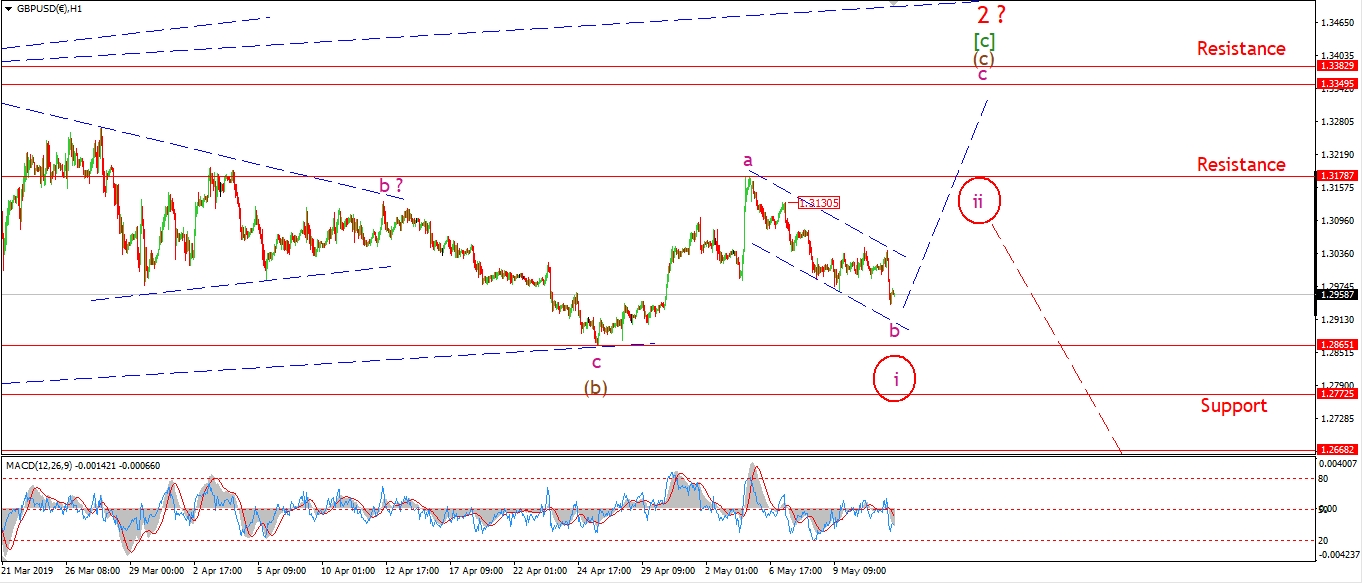 [/vc_column_text][/vc_column][vc_column width=”1/3″][vc_custom_heading text=”4 Hours” use_theme_fonts=”yes”][vc_column_text]
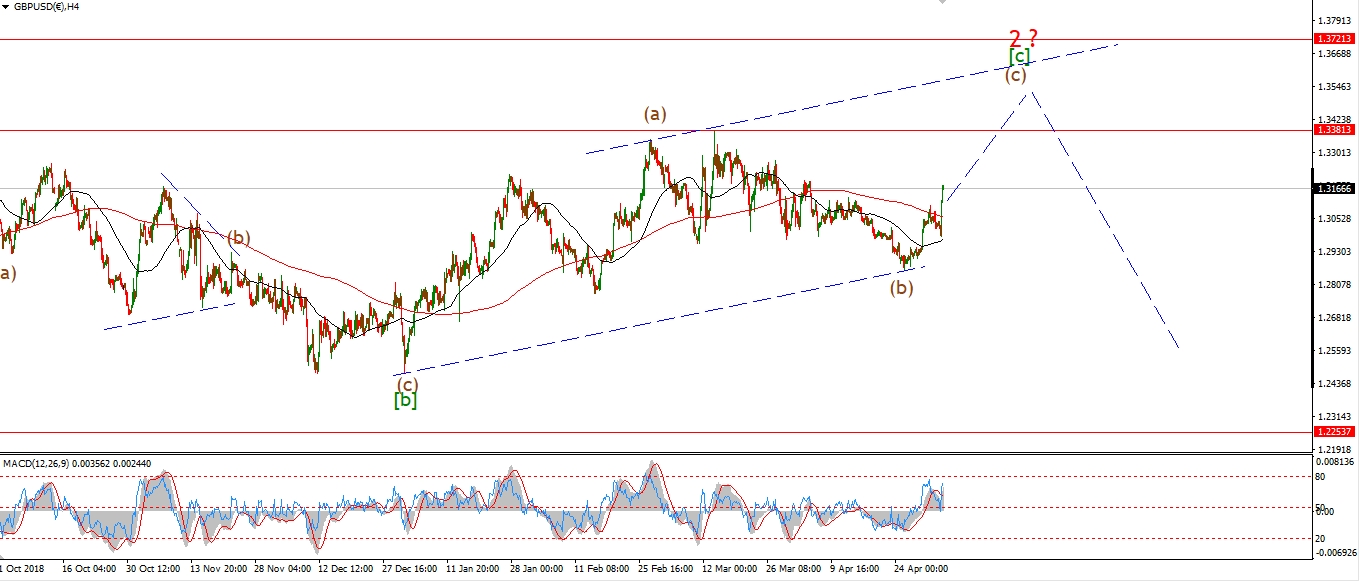 [/vc_column_text][vc_custom_heading text=”Daily” use_theme_fonts=”yes”][vc_column_text]
 [/vc_column_text][/vc_column][/vc_row]
[vc_row][vc_column][vc_column_text]
I have shown the alternate count this evening for cable.
The drop off 1.3176 can be counted in five waves.
So there is a reasonable chance that this is the beginning
of another impulsive move lower in cable after a long period of corrective action.
If we see a small lower high form in three waves below 1.3178,
that will favor the alternate count.
And then we should prepare for another long run don in cable in a large degree third wave.
Tomorrow;
There is still an equal chance that this drop is wave ‘b’ coming to a close.
Watch the action off this low to confirm or rule out the alternate count.
[/vc_column_text][/vc_column][/vc_row]
[vc_row][vc_column][vc_separator border_width=”5″][/vc_column][/vc_row][vc_row][vc_column][vc_column_text]
USDJPY
[/vc_column_text][/vc_column][/vc_row][vc_row][vc_column][vc_separator border_width=”5″][/vc_column][/vc_row][vc_row][vc_column width=”2/3″][vc_custom_heading text=”1 hr” use_theme_fonts=”yes”][vc_column_text]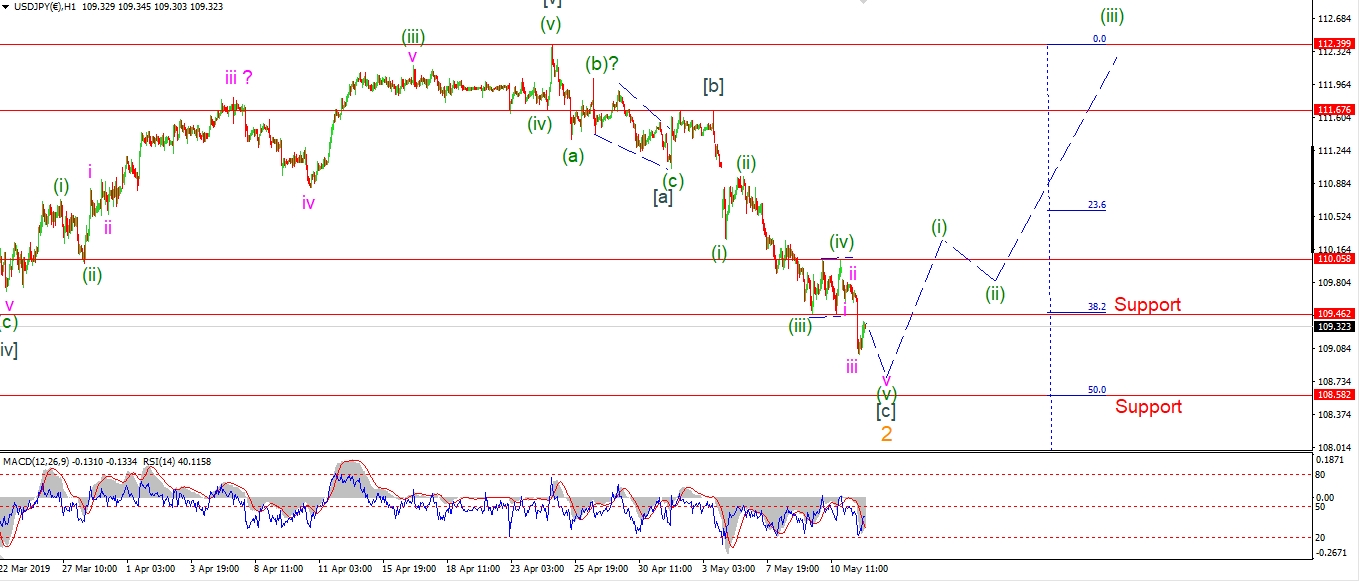 [/vc_column_text][/vc_column][vc_column width=”1/3″][vc_custom_heading text=”4 Hours” use_theme_fonts=”yes”][vc_column_text]
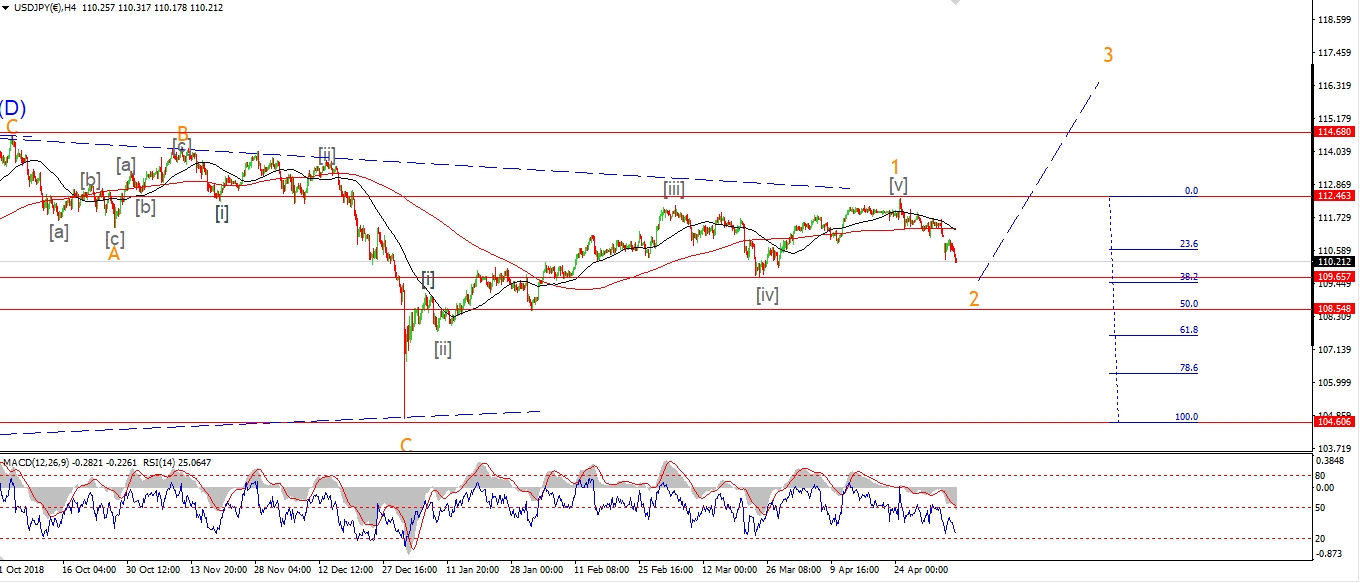 [/vc_column_text][vc_custom_heading text=”Daily” use_theme_fonts=”yes”][vc_column_text]
 [/vc_column_text][/vc_column][/vc_row]
[vc_row][vc_column][vc_column_text]
USDJPY dropped also today in wave (v) of [c].
This action brings us very close to the end of wave ‘2’.
The 50% retracement level of wave ‘1’ lies at 108.58,
and todays low hit 109.00 flat.
So we are right in the area for a reversal to occur.
Wave (v) itself might have one more subdivision lower to create five waves internally.
Tomorrow;
Watch for wave ‘v’ of (v) to break 109.00 once more and finish this correction.
I am now on the lookout for an impulse wave higher to begin this week in wave (i) of [i].
[/vc_column_text][/vc_column][/vc_row]
[vc_row][vc_column][vc_separator border_width=”5″][/vc_column][/vc_row][vc_row][vc_column][vc_column_text]
DOW JONES INDUSTRIALS
[/vc_column_text][/vc_column][/vc_row][vc_row][vc_column][vc_separator border_width=”5″][/vc_column][/vc_row][vc_row][vc_column width=”2/3″][vc_custom_heading text=”1 hr” use_theme_fonts=”yes”][vc_column_text]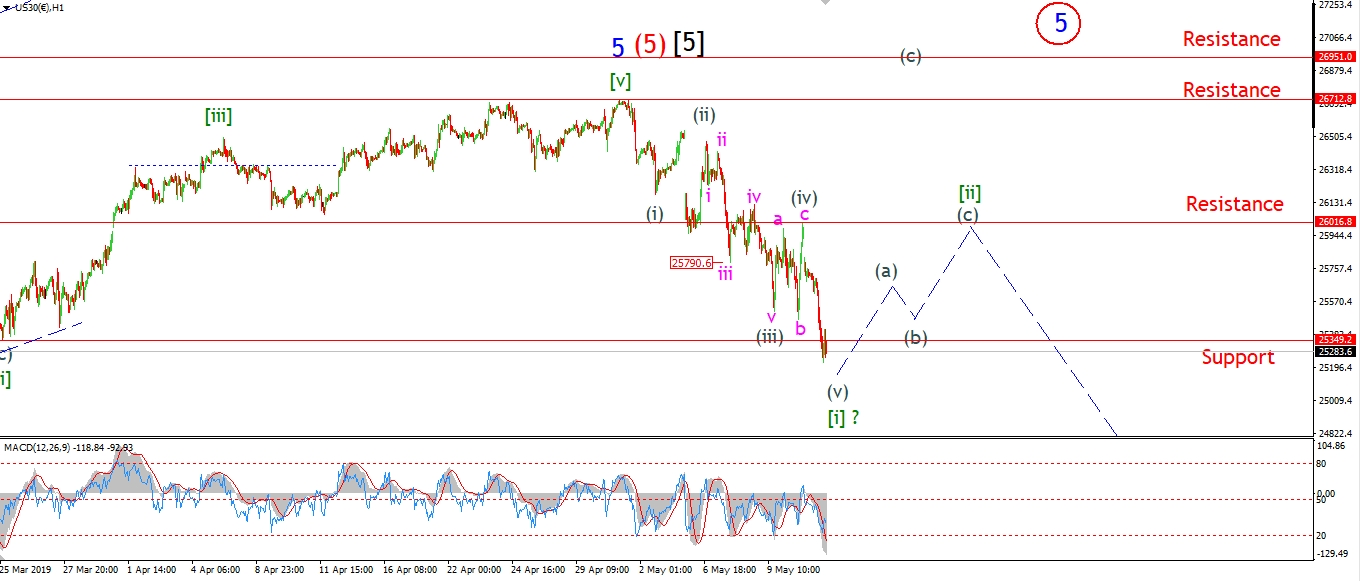 [/vc_column_text][/vc_column][vc_column width=”1/3″][vc_custom_heading text=”4 Hours” use_theme_fonts=”yes”][vc_column_text]
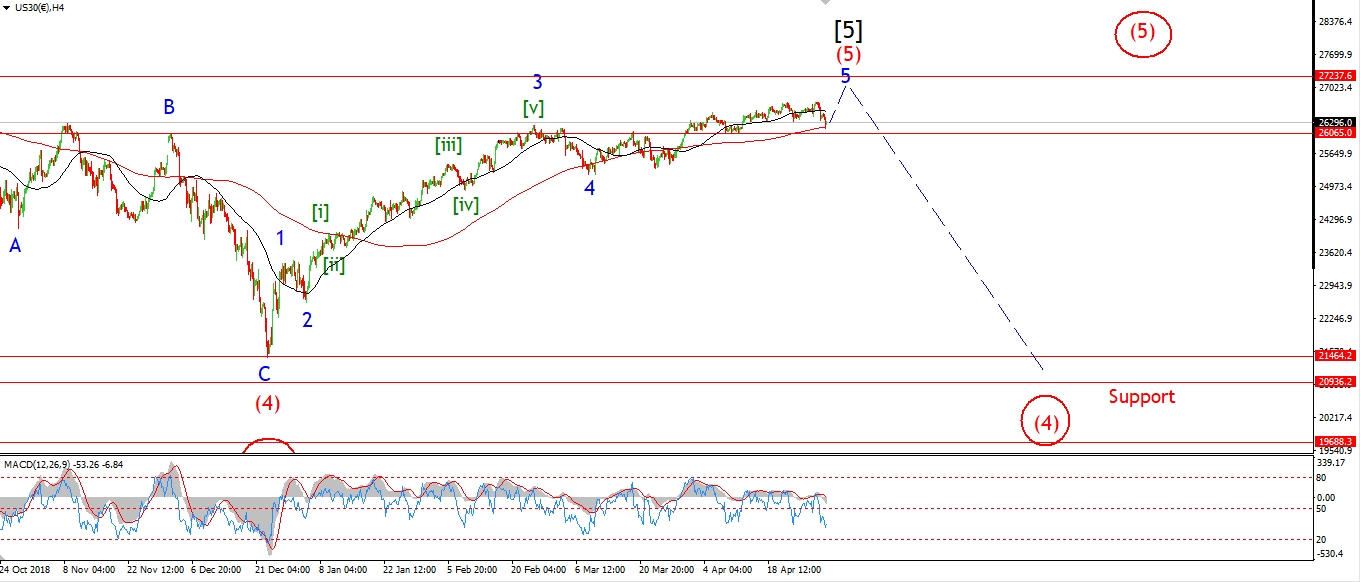 [/vc_column_text][vc_custom_heading text=”Daily” use_theme_fonts=”yes”][vc_column_text]
 [/vc_column_text][/vc_column][/vc_row]
[vc_row][vc_column][vc_column_text]
The DOW is well on it’s way to creating a five wave move lower off the recent highs.
This is shown in the short term count as the most likely option now.
the market broke through support at 25349 today.
This level marks the low of the previous wave [ii] of ‘5’.
By breaking this low today,
the idea of an ending diagonal wave ‘5’ has now been ruled out.
The main focus from here is to see if we get a clear impulsive structure off the high.
That is five waves down,
and three waves up to a bearish lower high over the coming week or so.
Once that structure is in place,
we are on for a much larger decline.
Tomorrow;
Watch for wave [i] down to complete soon and wave (a) of [ii] to begin.
Wave [ii] should target the previous fourth wave high at 26016 again.
[/vc_column_text][/vc_column][/vc_row]
[vc_row][vc_column][vc_separator border_width=”5″][/vc_column][/vc_row][vc_row][vc_column][vc_column_text]
GOLD
[/vc_column_text][/vc_column][/vc_row][vc_row][vc_column][vc_separator border_width=”5″][/vc_column][/vc_row][vc_row][vc_column width=”2/3″][vc_custom_heading text=”1 hr” use_theme_fonts=”yes”][vc_column_text]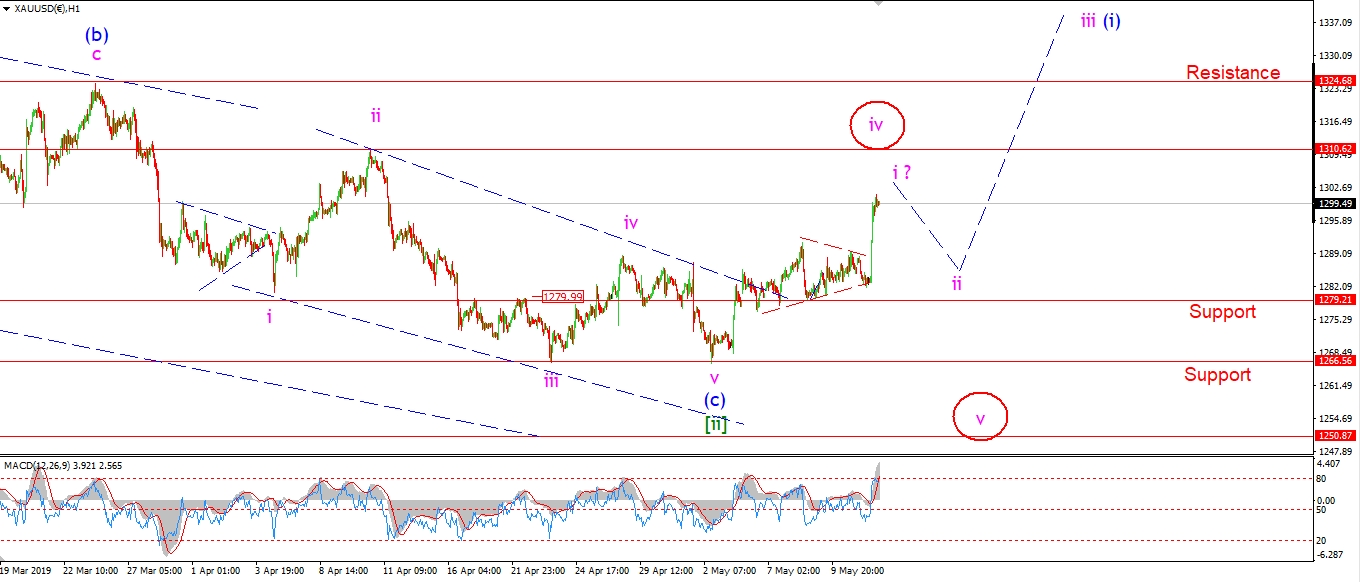 [/vc_column_text][/vc_column][vc_column width=”1/3″][vc_custom_heading text=”4 Hours” use_theme_fonts=”yes”][vc_column_text]
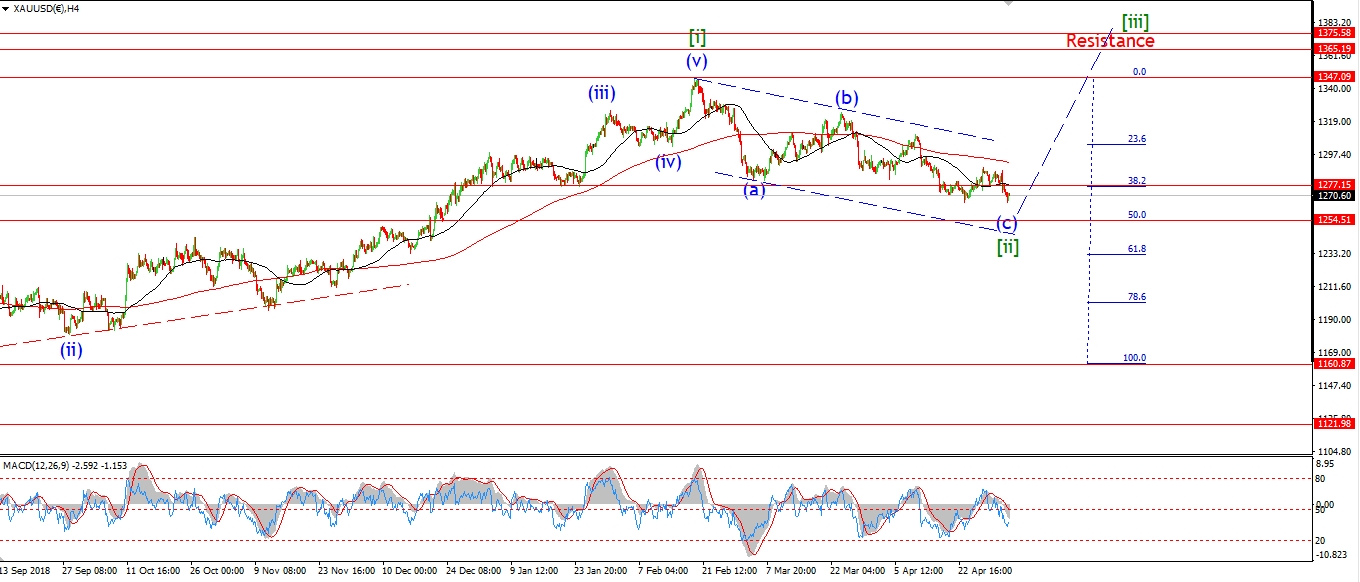 [/vc_column_text][vc_custom_heading text=”Daily” use_theme_fonts=”yes”][vc_column_text]
 [/vc_column_text][/vc_column][/vc_row]
[vc_row][vc_column][vc_column_text]
I have shown a slightly different view of the short term action this evening.
The price has created a possible contracting triangle at this mornings lows.
This could be a small fourth wave within wave ‘i’ up.
It definitely makes sense of the corrective looking action thats for sure.
If wave ‘i’ up is now complete,
Then we should look for a correction in wave ‘ii’ early this week to complete a bullish impulse wave higher.
And this action should set us up nicely for a run higher in wave ‘iii’ of (i).
Tomorrow;
Watch for wave ‘i’ to complete soon.
A break of 1310 would really favor the bullish outlook,
although it does not need to happen in wave ‘i’.
Wave ‘ii’ should begin soon.
[/vc_column_text][/vc_column][/vc_row]
[vc_row][vc_column][vc_separator border_width=”5″][/vc_column][/vc_row][vc_row][vc_column][vc_column_text]
U.S CRUDE OIL
[/vc_column_text][/vc_column][/vc_row][vc_row][vc_column][vc_separator border_width=”5″][/vc_column][/vc_row][vc_row][vc_column width=”2/3″][vc_custom_heading text=”1 hr” use_theme_fonts=”yes”][vc_column_text]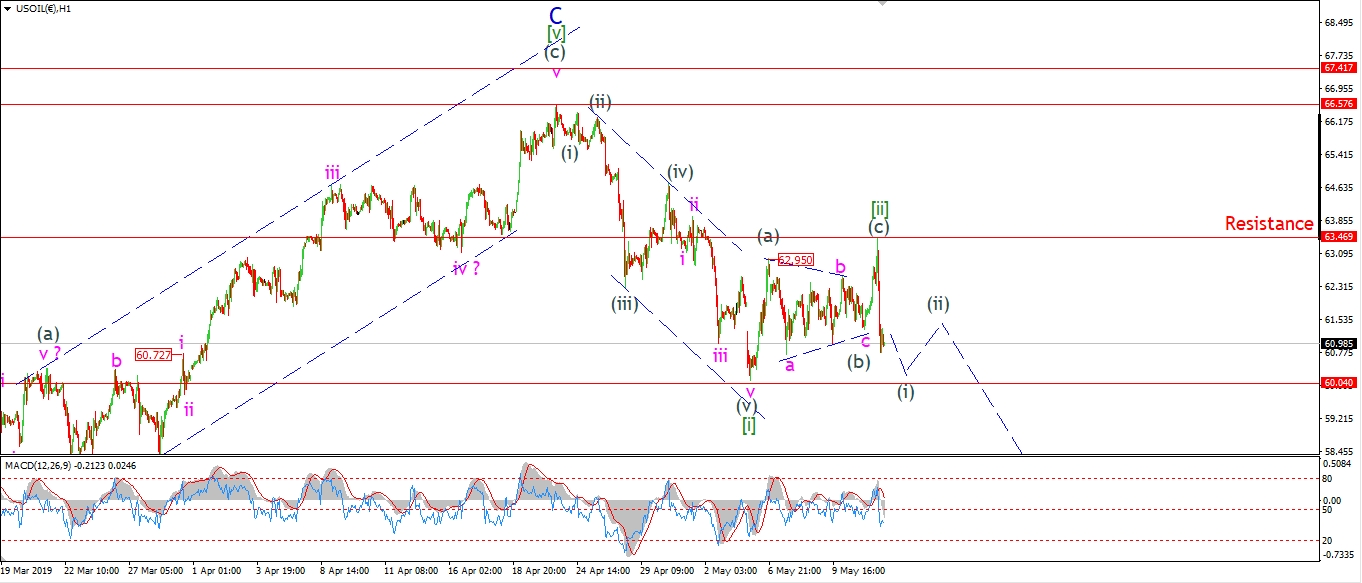 [/vc_column_text][/vc_column][vc_column width=”1/3″][vc_custom_heading text=”4 Hours” use_theme_fonts=”yes”][vc_column_text]
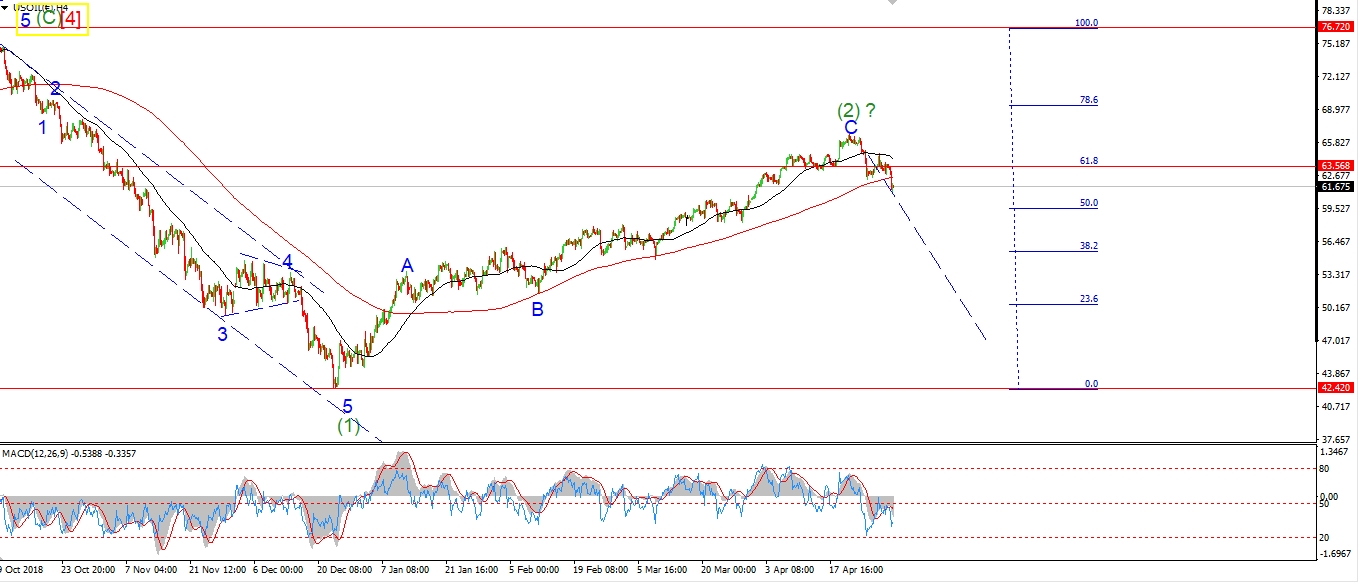 [/vc_column_text][vc_custom_heading text=”Daily” use_theme_fonts=”yes”][vc_column_text]
 [/vc_column_text][/vc_column][/vc_row]
[vc_row][vc_column][vc_column_text]
Crude hit the target area for wave (c) at 63.40 this afternoon.
And the price dropped sharply off that high.
Wave [ii] seems to have traced out a running flat wave (b) at the overnight lows.
And wave (c) rallied in five waves off that low.
We now have a 5,3,5 correction in place.
So this action is looking promising for a decline into wave [iii] to begin this week.
Tomorrow;
watch for wave (i) of [iii] to complete,
A break of 60.04 will confirm wave (i) of [iii] has begun.
we can then expect a lower high in wave (ii) by Wednesday.
[/vc_column_text][/vc_column][/vc_row]
[vc_row][vc_column][vc_separator border_width=”5″][/vc_column][/vc_row][vc_row][vc_column][vc_column_text]
US 10 yr Treasuries.
[/vc_column_text][/vc_column][/vc_row][vc_row][vc_column][vc_separator border_width=”5″][/vc_column][/vc_row][vc_row][vc_column width=”2/3″][vc_custom_heading text=”1 hr” use_theme_fonts=”yes”][vc_column_text]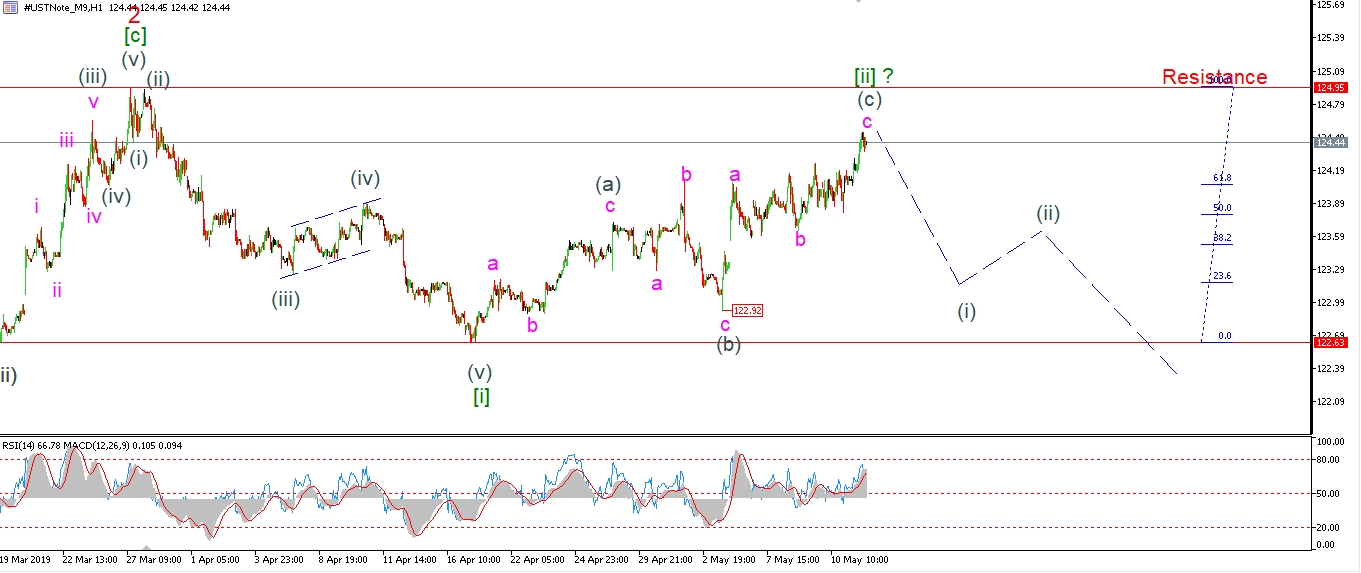 [/vc_column_text][/vc_column][vc_column width=”1/3″][vc_custom_heading text=”4 Hours” use_theme_fonts=”yes”][vc_column_text]
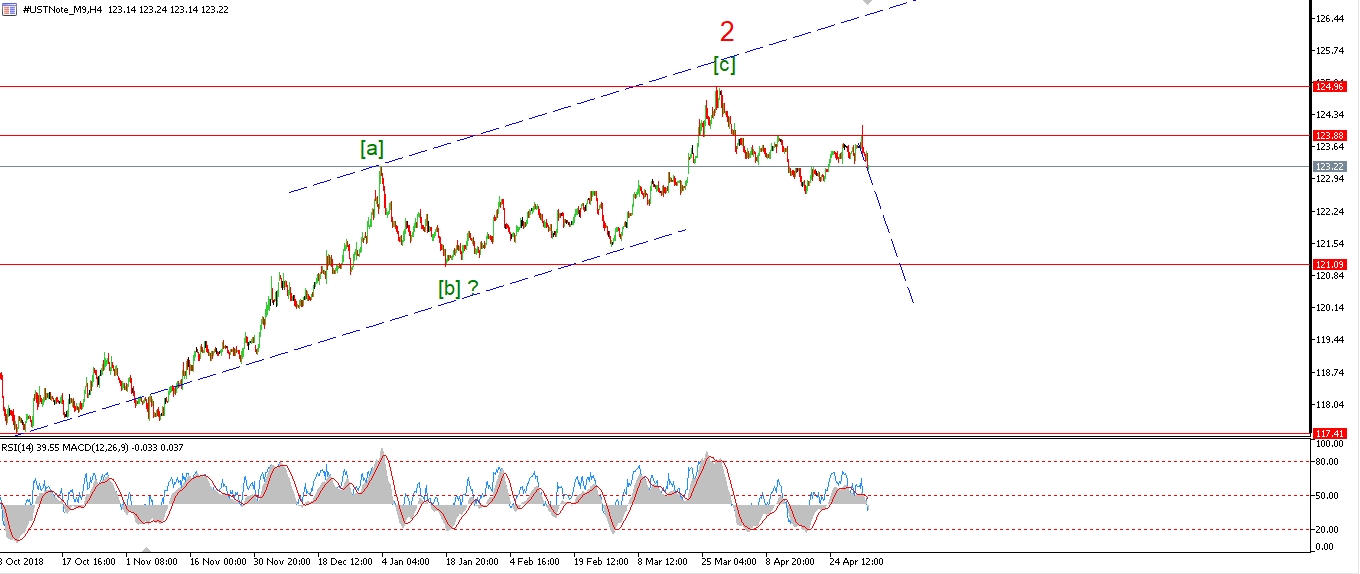 [/vc_column_text][vc_custom_heading text=”Daily” use_theme_fonts=”yes”][vc_column_text]
 [/vc_column_text][/vc_column][/vc_row]
[vc_row][vc_column][vc_column_text]
Even though the price is now back up near resistance at 124.95 this evening.
The rise off wave [i] at 122.63 still counts best as a three wave structure.
And therefore it should be retraced fully in wave [iii] down.
Wave [iii] must now begin to pull the market lower over the coming days.
And wave (i) of [iii] should break 122.92 before completing.
A break of that level will signal that the larger wave [iii] has begun.
Tomorrow;
Watch for 124.95 to hold,
and wave [iii] down to begin.
[/vc_column_text][/vc_column][/vc_row]
[vc_row][vc_column][vc_separator border_width=”5″][/vc_column][/vc_row][vc_row][vc_column][vc_column_text]
SILVER
[/vc_column_text][/vc_column][/vc_row][vc_row][vc_column][vc_separator border_width=”5″][/vc_column][/vc_row][vc_row][vc_column width=”2/3″][vc_custom_heading text=”1 hr” use_theme_fonts=”yes”][vc_column_text]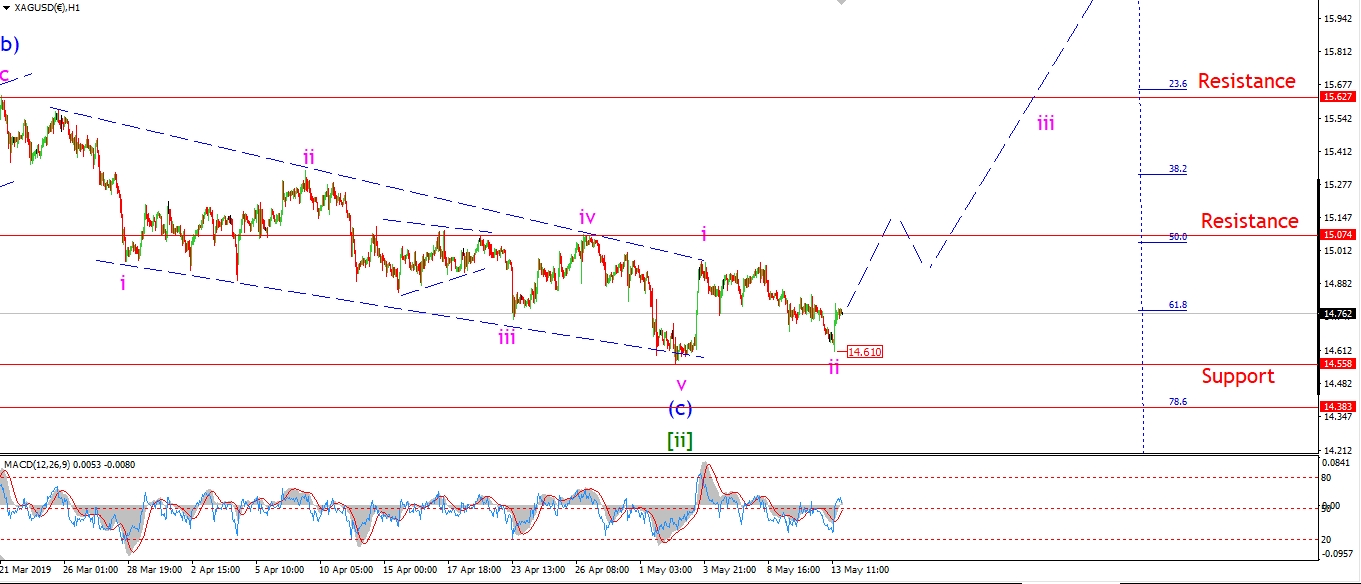 [/vc_column_text][/vc_column][vc_column width=”1/3″][vc_custom_heading text=”4 Hours” use_theme_fonts=”yes”][vc_column_text]
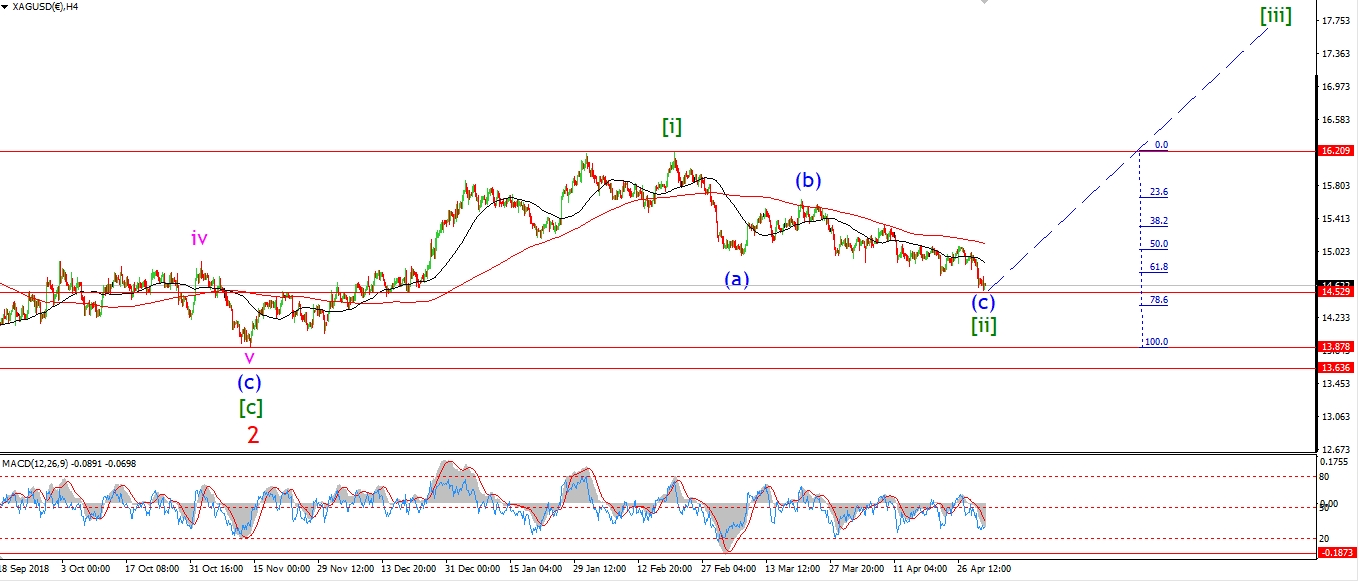 [/vc_column_text][vc_custom_heading text=”Daily” use_theme_fonts=”yes”][vc_column_text]
 [/vc_column_text][/vc_column][/vc_row]
[vc_row][vc_column][vc_column_text]
Todays low in Silver stopped just short of invalidating the bullish count.
The price must not break 14.55 for wave ‘i’ and ‘ii’ up to remain valid.
Todays low hit 14.61,
The price simply must rally off this low to begin wave ‘iii’ up now.
A break of 15.07 from here will favor the bullish count.
Tomorrow;
Watch for 14.55 to hold and wave ‘iii’ up to begin with a break of initial resistance.
[/vc_column_text][/vc_column][/vc_row]
[vc_row][vc_column][vc_separator border_width=”5″][/vc_column][/vc_row][vc_row][vc_column][vc_column_text]
S&P 500.
[/vc_column_text][/vc_column][/vc_row][vc_row][vc_column][vc_separator border_width=”5″][/vc_column][/vc_row][vc_row][vc_column width=”2/3″][vc_custom_heading text=”1 hr” use_theme_fonts=”yes”][vc_column_text]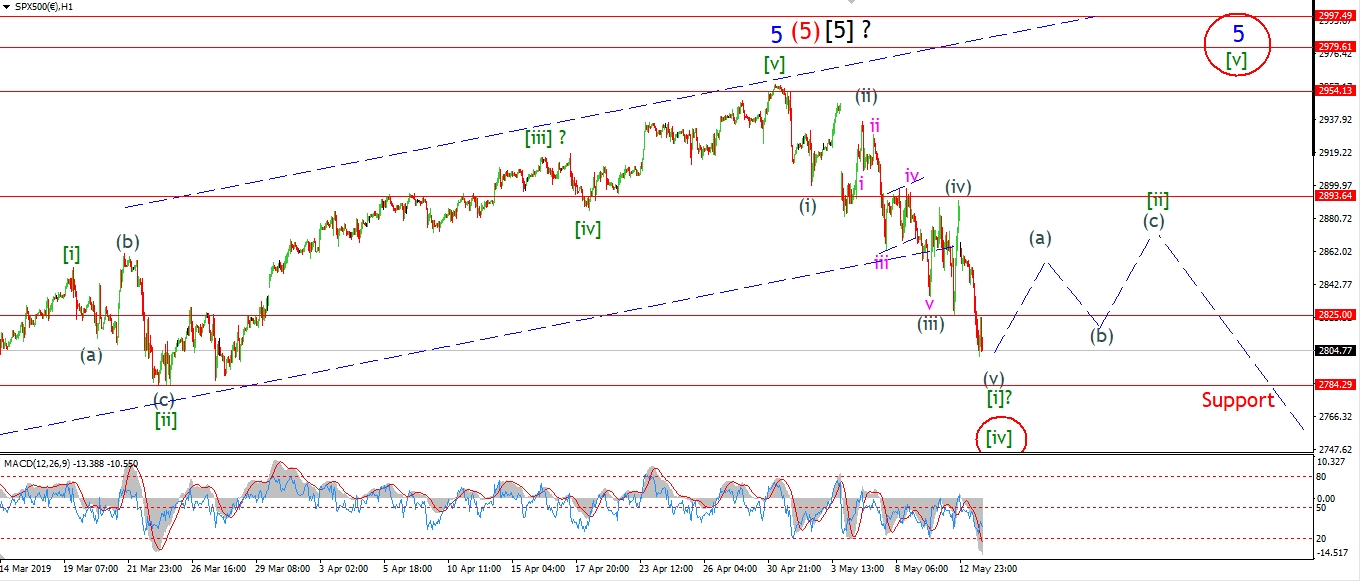 [/vc_column_text][/vc_column][vc_column width=”1/3″][vc_custom_heading text=”4 Hours” use_theme_fonts=”yes”][vc_column_text]
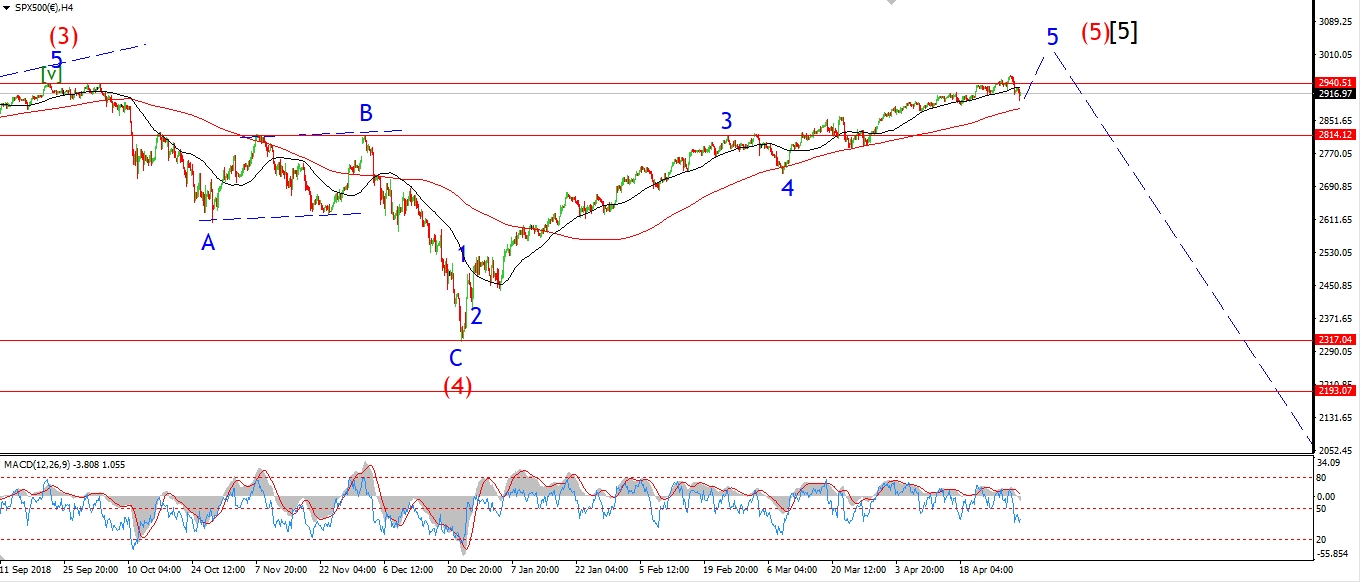 [/vc_column_text][vc_custom_heading text=”Daily” use_theme_fonts=”yes”][vc_column_text]
 [/vc_column_text][/vc_column][/vc_row]
[vc_row][vc_column][vc_column_text]
The S&P has ended the session near the lows of the day,
after another sharp drop in a possible wave (v) of [i].
Wave (v) is close to completing now,
one further break to a new low would complete a visible five wave pattern in wave (v).
And that will complete a larger five wave pattern in the overall structure off the high.
Once wave [i] completes,
we should then see a three wave rally begin in wave [ii].
The previous fourth wave high at 2893 is the obvious target for that wave to complete.
The S&P is on target to herald in the new bear-market this month!
Five waves down off a new all time high suggests that this is only the beginning of something much bigger.
Tomorrow;
Watch for a short term low in wave [i] to form and then the correction in wave [ii] to begin.
[/vc_column_text][/vc_column][/vc_row]
[vc_row][vc_column][vc_column_text]
[/vc_column_text][/vc_column][/vc_row]
[vc_row][vc_column][vc_separator border_width=”5″][/vc_column][/vc_row]