
Good evening to one and all.
The Lord’s Blessing’s to you all again tonight.
https://twitter.com/bullwavesreal
EURUSD.
EURUSD 1hr.
EURUSD 4hr.

EURUSD daily.
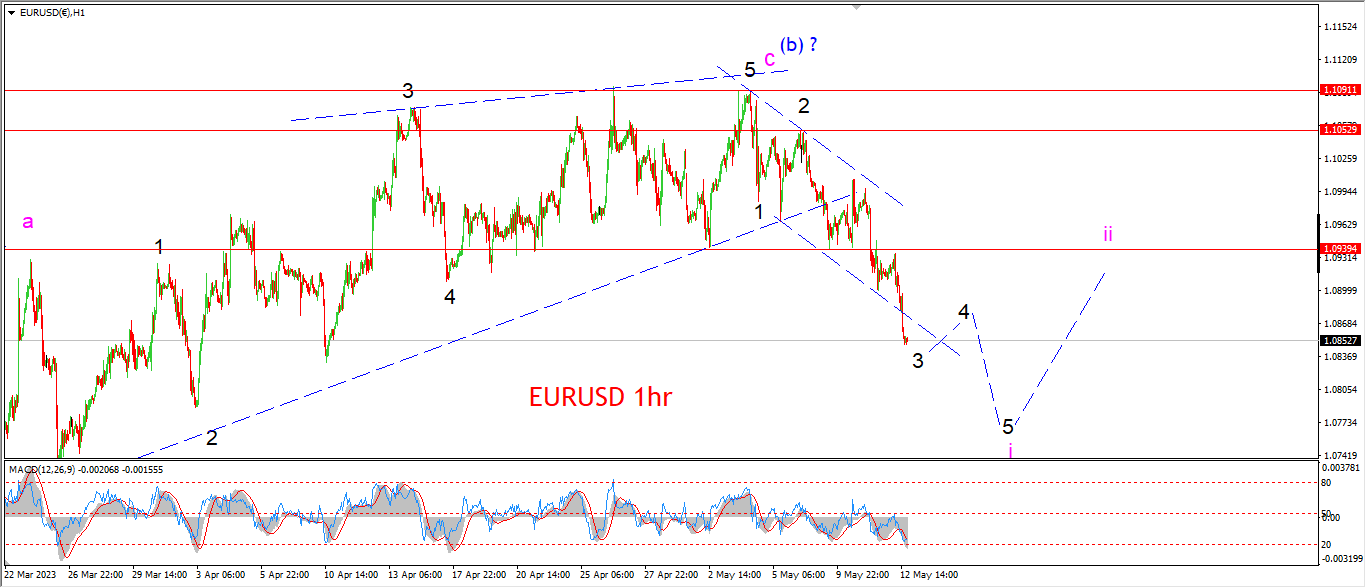
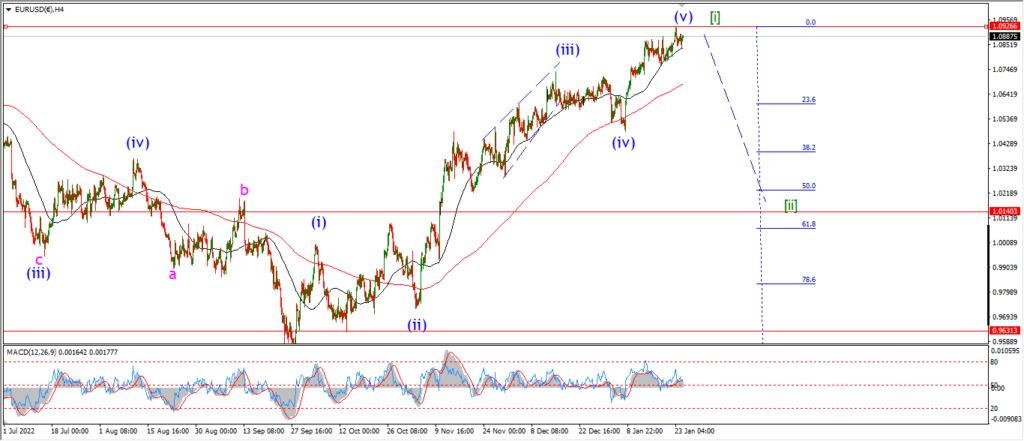
EURUSD has made it’s way lower again this evening in line with a possible third wave extension.
the price has dropped out of the trend channel also today and that is another vote in favor of a third wave down.
The decline off the wave ‘2’ high has traced out a five wave pattern into this evenings lows.
So I can say that the pattern is starting to come together for wave ‘i’ pink now.
All we need is one more step lower in wave ‘4’ and ‘5’ to complete a full impulse wave off that wave (b) high.
Monday;
Watch for wave ‘4’ and ‘5’ to complete a full pattern off the high in wave ‘i’ pink.
We can think about wave ‘ii’ later in the week once wave ‘i’ is done.
GBPUSD
GBPUSD 1hr.
GBPUSD 4hr.

GBPUSD daily.
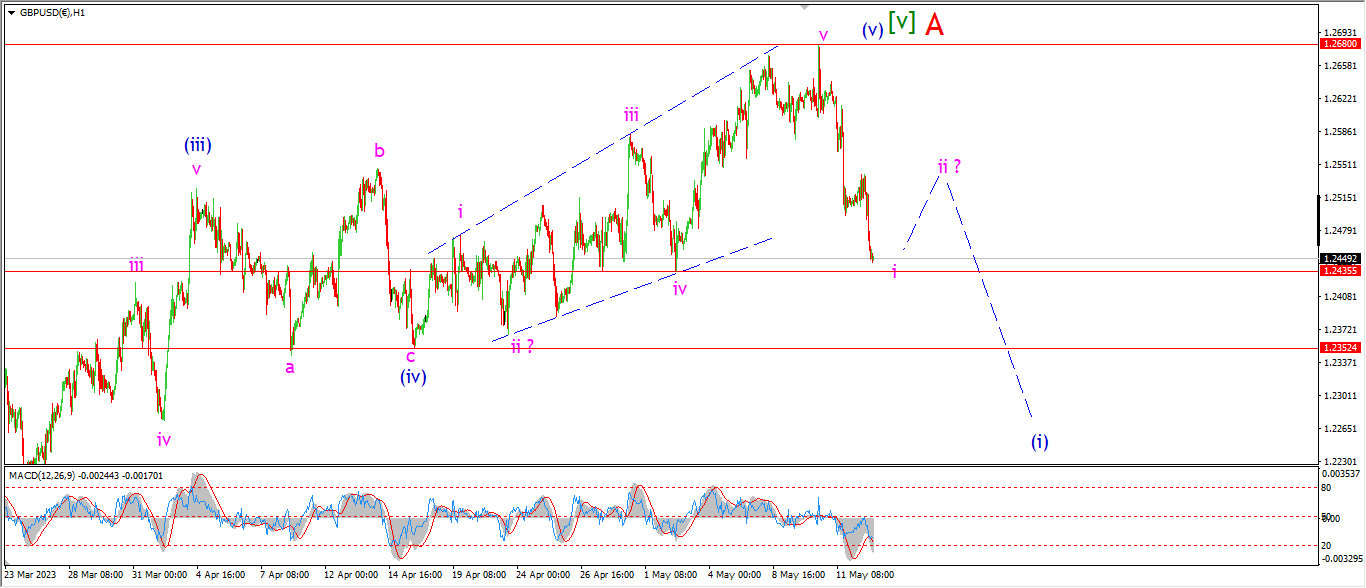
the target that we were looking at for wave ‘i’ pink is pretty much in the bag tonight.
The price has now fallen in five waves off the top at wave ‘A’,
and wave ‘i’ has retraced most of the wave ‘v’ rally now.
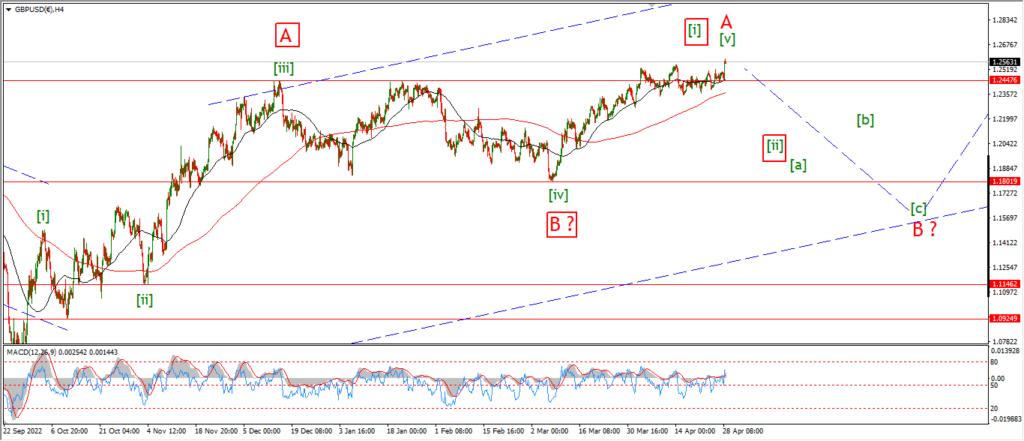
So I think this action is really favoring the idea that wave ‘A’ is complete at the recent highs,
and we should be looking lower for a month at least in wave ‘B’.
You can see on the 4hr chart that we are looking at a possible target for wave ‘B’ in the 1.1600 area again.
Monday;
Watch for wave ‘i’ and ‘ii’ to complete a lower high off the top.
Wave (i) blue is set to continue lower also next week with a minimum target in the area of 1.2250.
Wave (i) should retrace all of the previous wave (v) when complete.
USDJPY.
USDJPY 1hr.
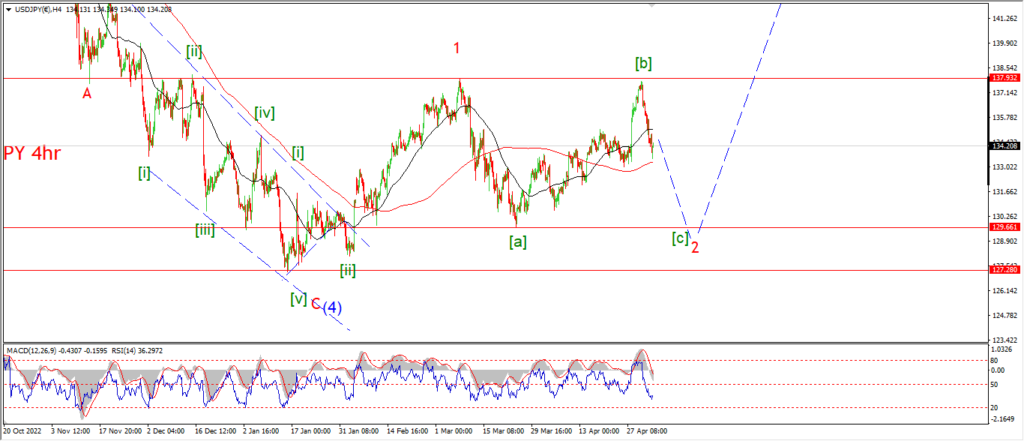
USDJPY 4hr.

USDJPY daily.
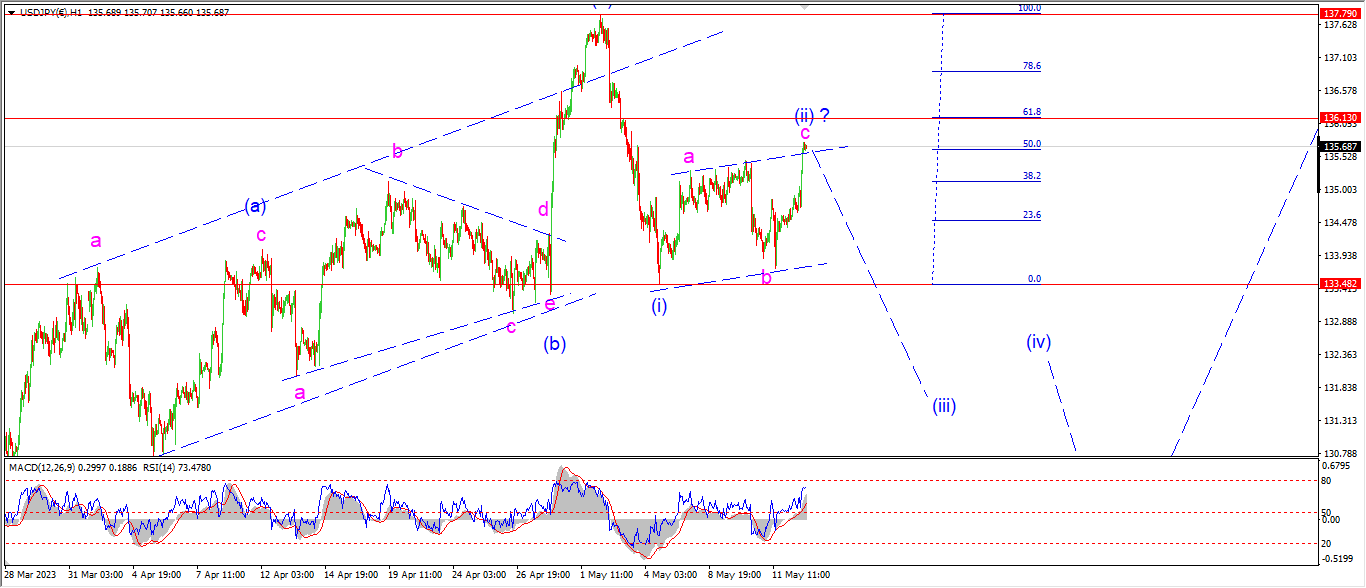
USDJPY managed to break above the initial resistance at the wave ‘a’ high,
That has invalidated last nights count,
and now we are working on a larger wave (ii) pattern as shown.
The rally today has also traced out three waves up off three wave (i) low.
And the pattern has filled the channel again.
So this pattern is complete as far as I can see.
Now,
as I mentioned in the video above,
if the price continues higher and early next and the price challenges the highs at 137.00 again,
then I will have to revisit the previous bullish pattern again.
But that is a problem for another day.
Monday;
Watch for this second wave to complete very soon.
the 62% retracement level lies at 136.13.
That seems like a solid target level to close out this corrective rally.
A break below the wave (i) low again will signal wave (iii) is underway.
DOW JONES.
DOW 1hr.
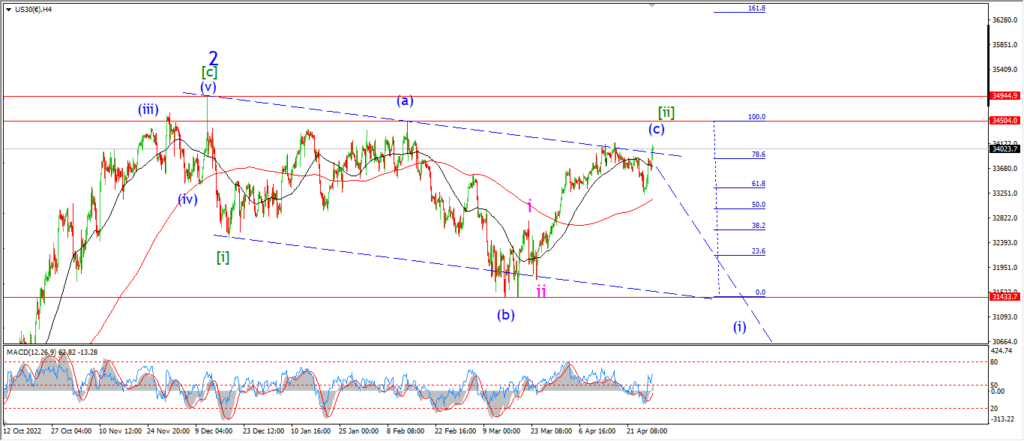
DOW 4hr
DOW daily.
I gotta say,
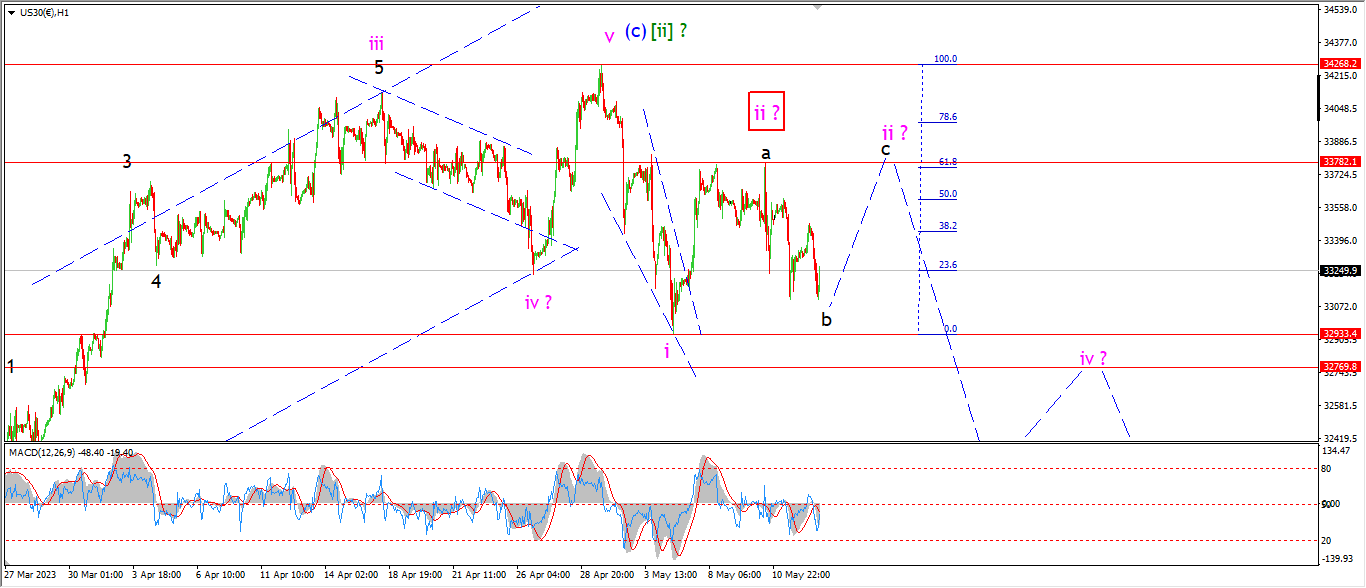
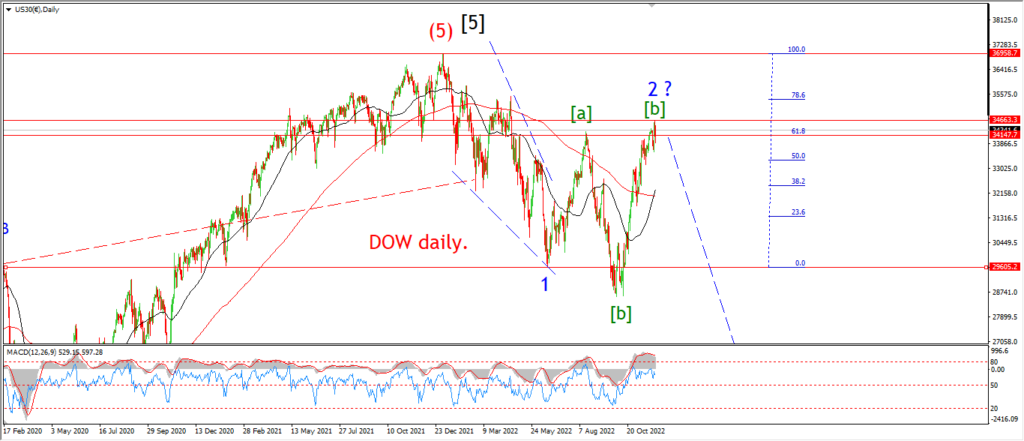
I am now even doubting the main count for wave ‘ii’ after this evenings reversal.
The action can be interpreted as a series of steps into wave ‘iii’ down also.
And that does put the main wave count in doubt again.
If the market continues lower to break the wave ‘i’ low again early next week,
well that will seal the deal here,
and we can then concentrate on the larger wave ‘iii’ of (i).
The patterns are finely balanced here,
I can’t rule out that larger wave ‘ii’ idea yet.
But the alternate count has not been validated yet either.
Monday;
Watch for a possible wave ‘c’ rally to top out above 33780 again as shown.
The alternate count for wave ‘ii’ and ‘iii’ will be triggered if we see a break to a new low below wave ‘i’ again.
Monday can change a lot in this market,
so Things are getting very interesting here.
GOLD
GOLD 1hr.
GOLD 4hr.

GOLD daily.
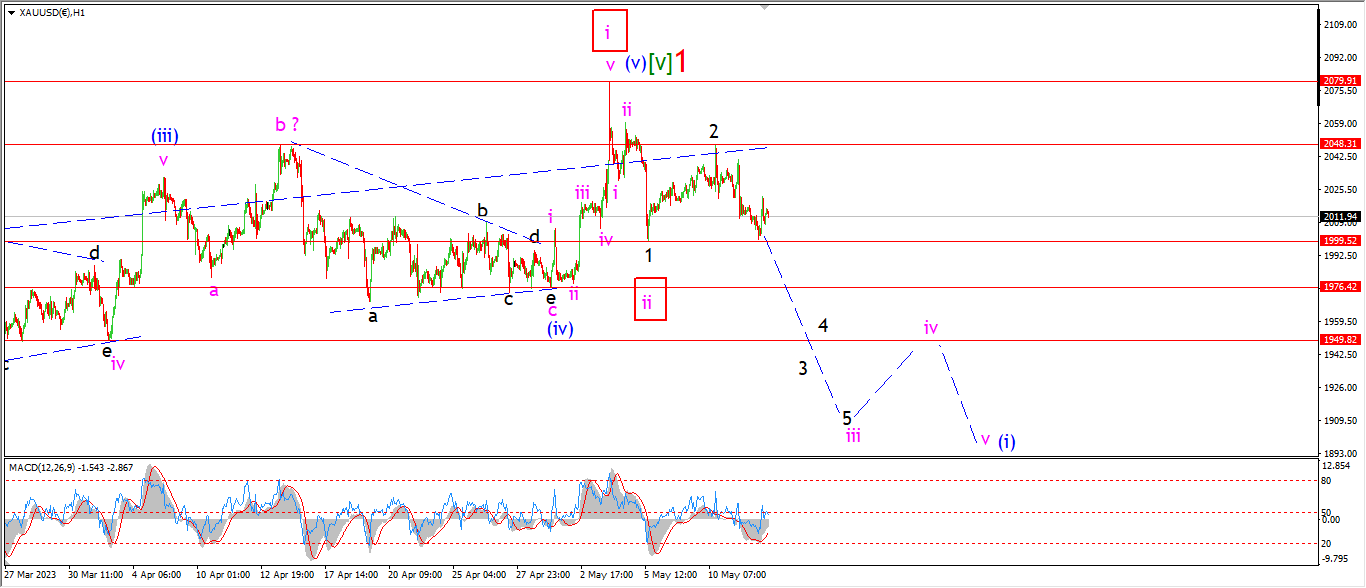
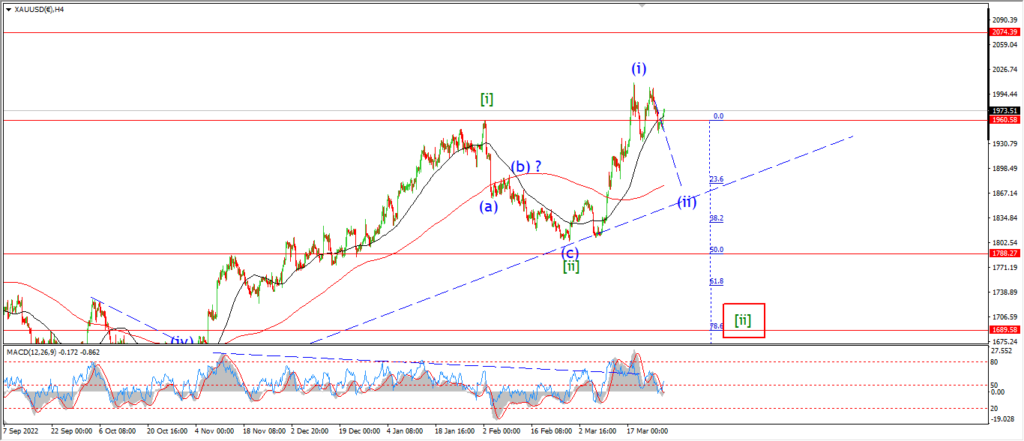
Gold fell to a double bottom with the previous low at 1999.50 again.
This action fits with the wave count but it fails to confirm the pattern in wave ‘iii’ yet.
If Mondays trade turns lower to break support at 1976 again,
that will go a long way towards confirming the top at wave ‘1’.
There are 2 solid support level below now at wave (iv) and wave ‘iv’.
A break of the upper level at 1976 will go a long way to confirming the larger idea for wave ‘iii’ of (i) here.
But until that happens I really don’t have much to go on here.
It is a game of patience again I’m afraid.
Monday;
Watch for wave ‘3’ of ‘iii’ to continue lower to break support and confirm the pattern.
CRUDE OIL.
CRUDE OIL 1hr.
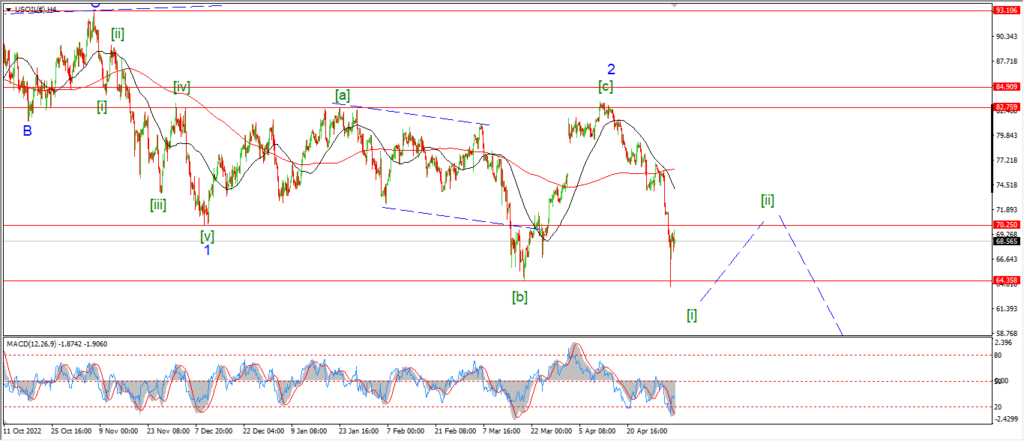
CRUDE OIL 4hr.
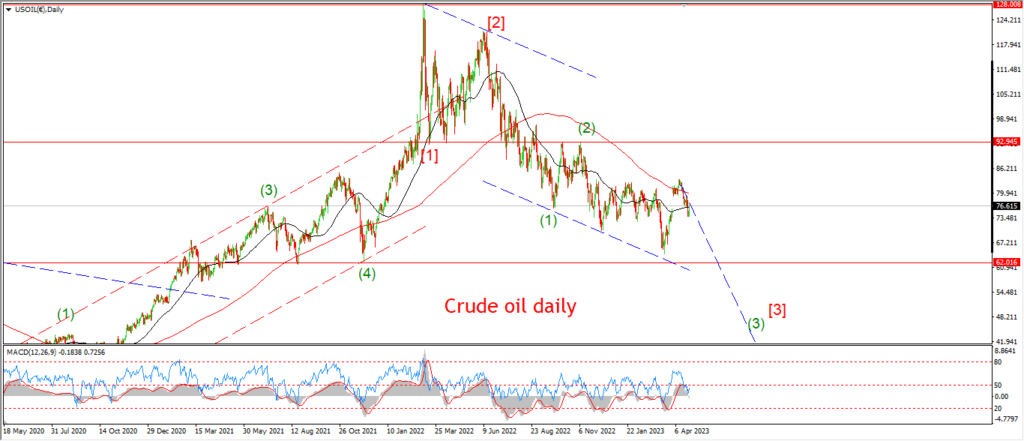
CRUDE OIL daily.
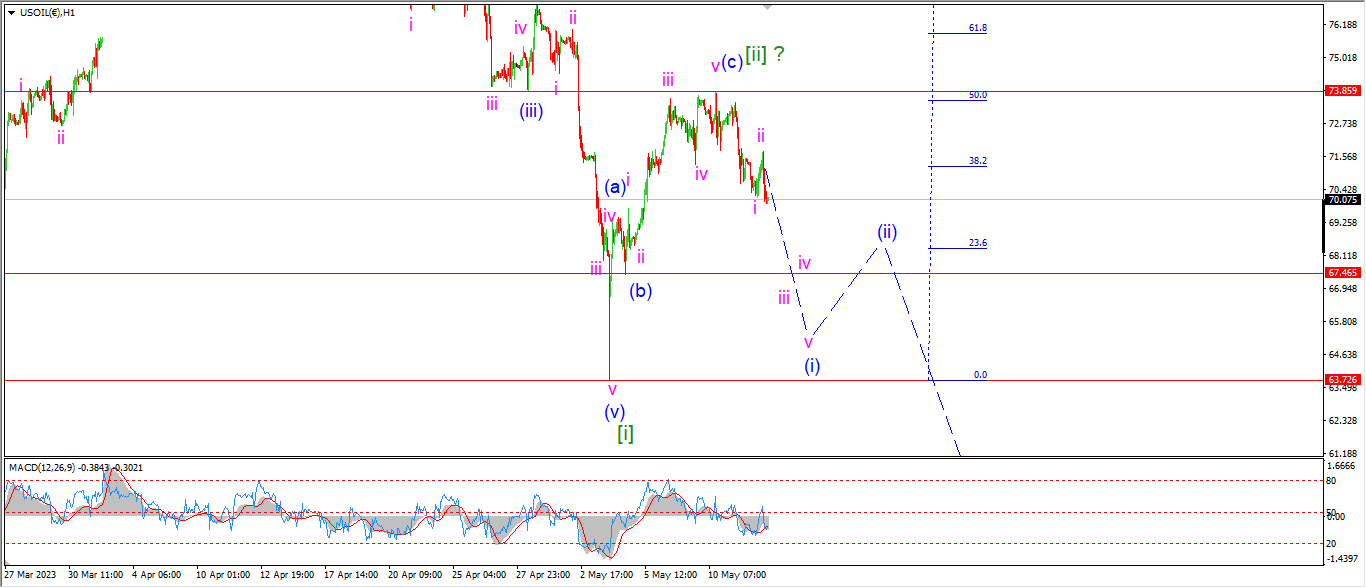
The market is one step closer to moving into wave [iii] down tonight.
Crude fell again to hit the low of the week at the close tonight.
There is a possible wave ‘i’ and ‘ii’ complete at todays lower high.
and if this pattern is correct,
then wave ‘iii’ of (i) should continue lower on Monday to break that wave (b) low at 67.46 again.
This decline in wave (i) has a lot of work to do before we can confirm the larger wave [iii] is underway.
Wave [iii] has the potential to carry the price down towards the 50.00 area again so there is a lot at stake here.
So lets see how the next few days trade goes to see if wave (i) and (ii) can complete another lower high pattern.
Monday;
Watch for wave ‘iii’ of (i) to continue lower to the wave (b) low at 67.46 again.
S&P 500.
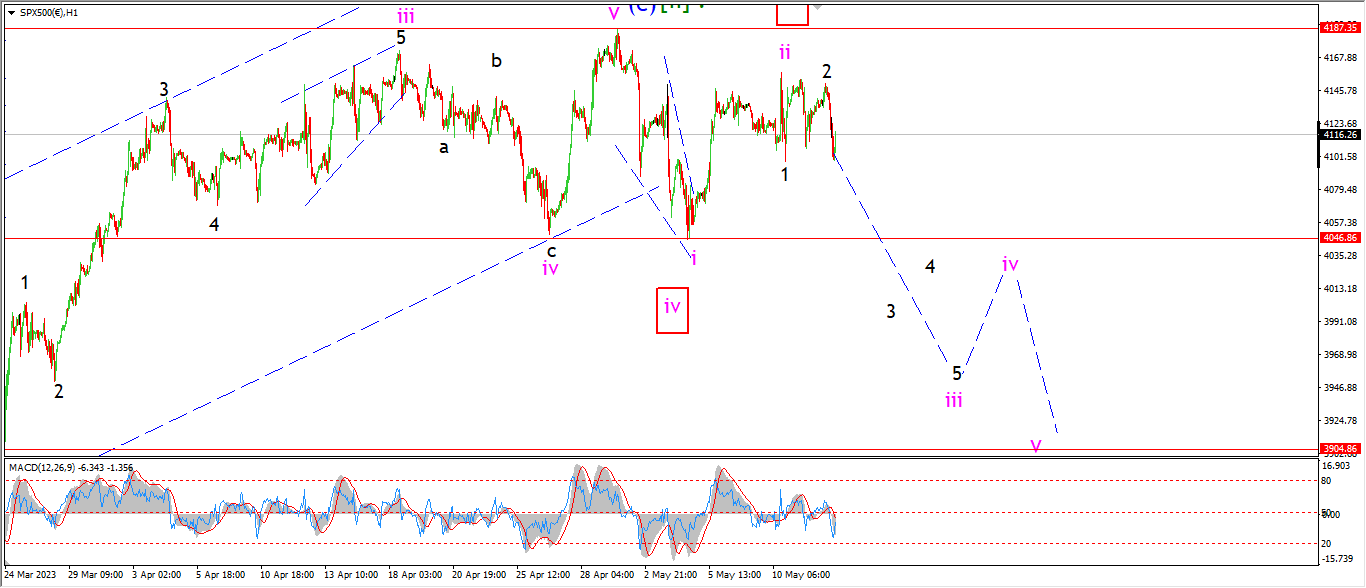
S&P 500 1hr
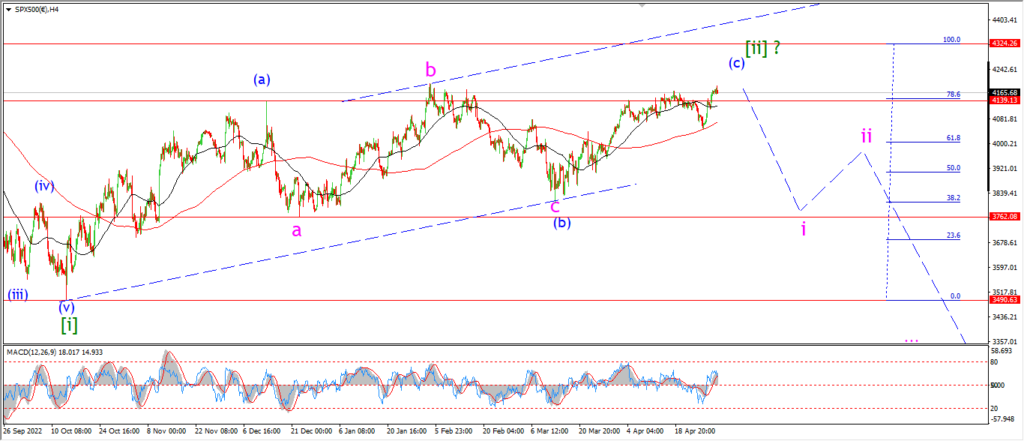
S&P 500 4hr
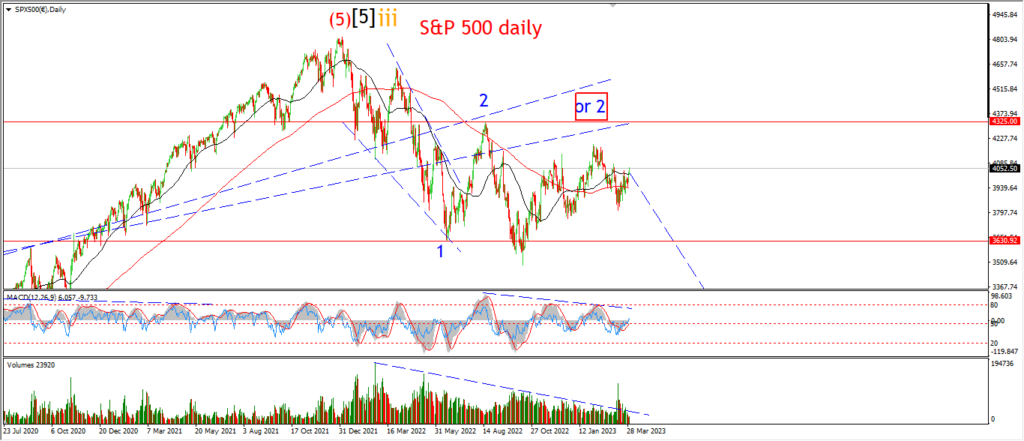
S&P 500 daily.
The S&P is ending the session with a nice spike lower off the intraday high again.
And much like the other markets I follow,
that move is in line with the pattern,
but its not enough yet to confirm anything.
I am looking at a possible wave ‘1’ and ‘2’ pattern off the wave ‘ii’ high.
and if this is correct here,
we should see a sharp move lower into wave ‘3’ of ‘iii’ early next week.
Monday;
4046 marks the wave ‘i’ low.
That is the key level in this short term pattern.
A break of that level will signal wave ‘iii’ is underway.
And the target area for wave ‘iii’ to complete lies at about 3950 again.
watch for wave ‘3’ of ‘iii’ to fall and break the wave ‘i’ low at 4046.
SILVER.
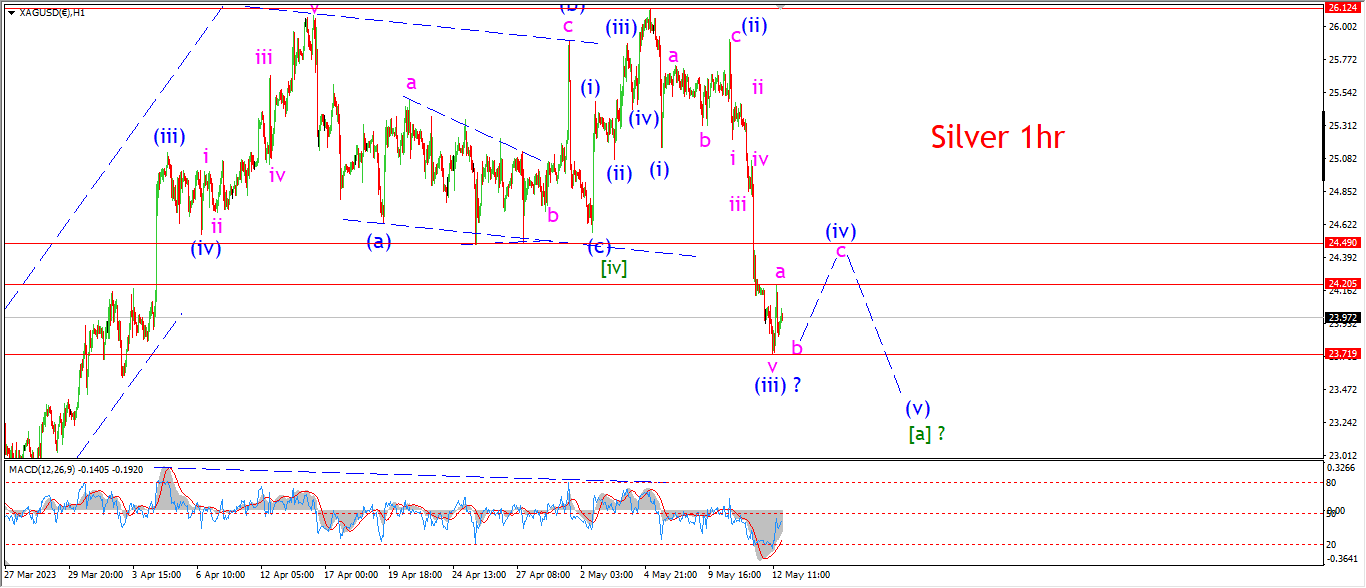
SILVER 1hr
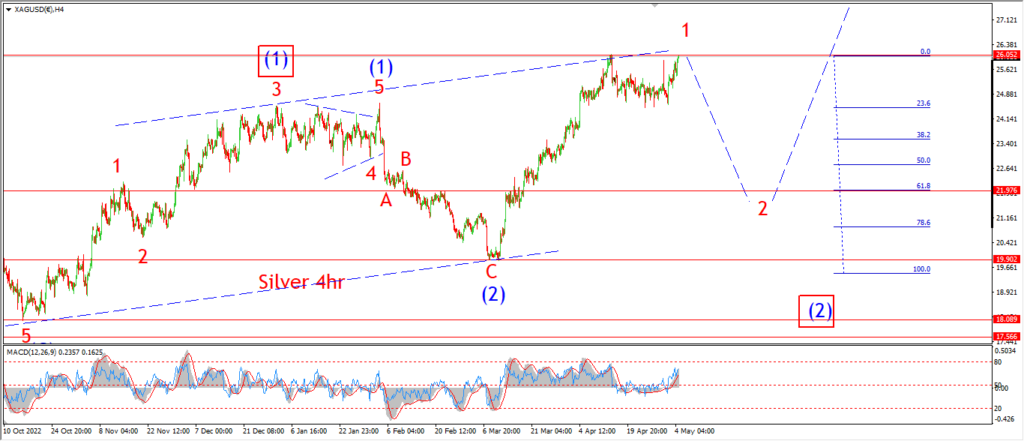
SILVER 4hr.
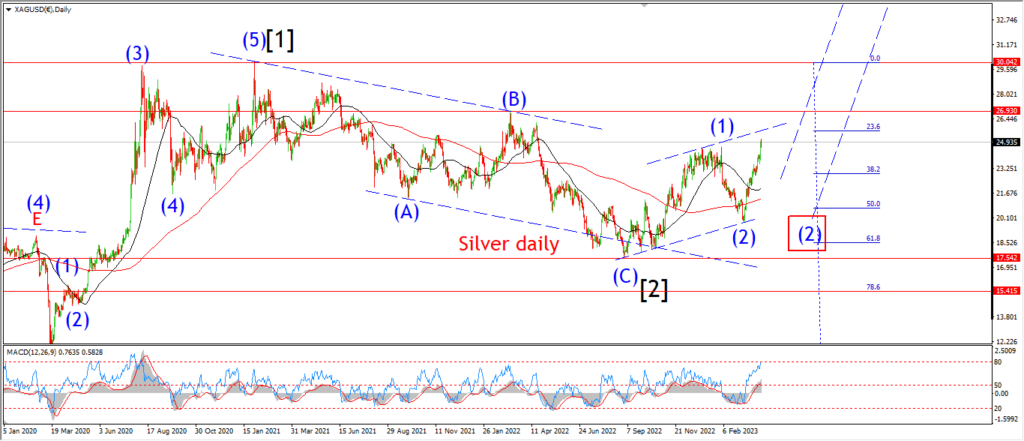
SILVER daily.
Silver has hit a possible low for wave (iii) at 23.71 today.
And now the price has bounced off that low to signal wave (iv) has begun.
I have labelled wave ‘a’ and ‘b’ as complete off wave (iii).
Wave ‘c’ is left to complete this pattern.
And the price should complete three waves up in a simple correction near 24.40 again.
Monday;
Watch for wave ‘b’ to complete a higher low above 23.71.
Wave ‘c’ should complete between 24.20 and 24.49 as shown.
BITCOIN
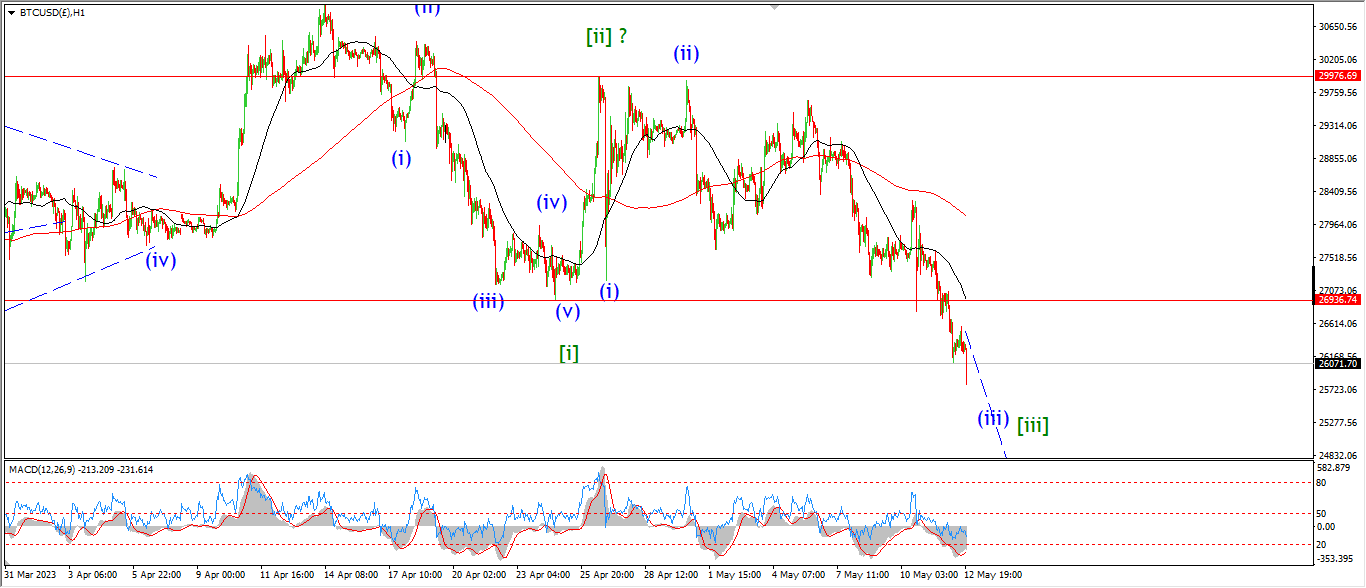
BITCOIN 1hr.

BITCOIN 4hr.
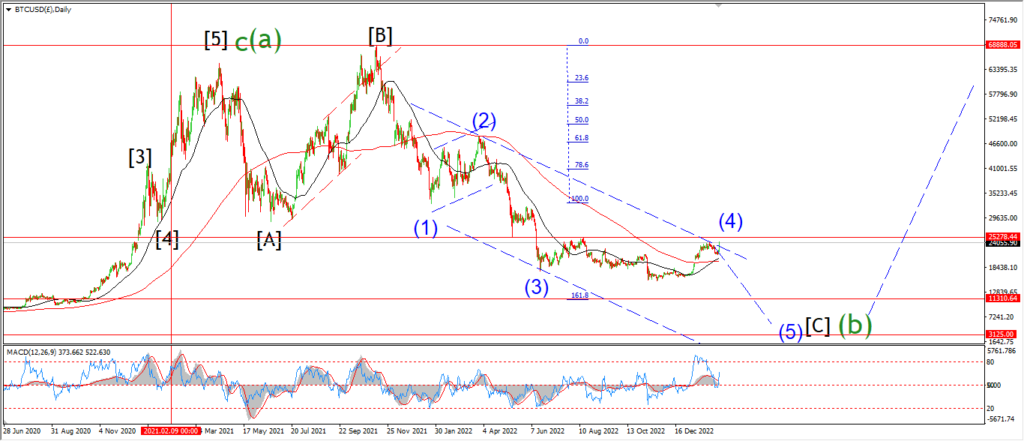
BITCOIN daily.
….
FTSE 100.
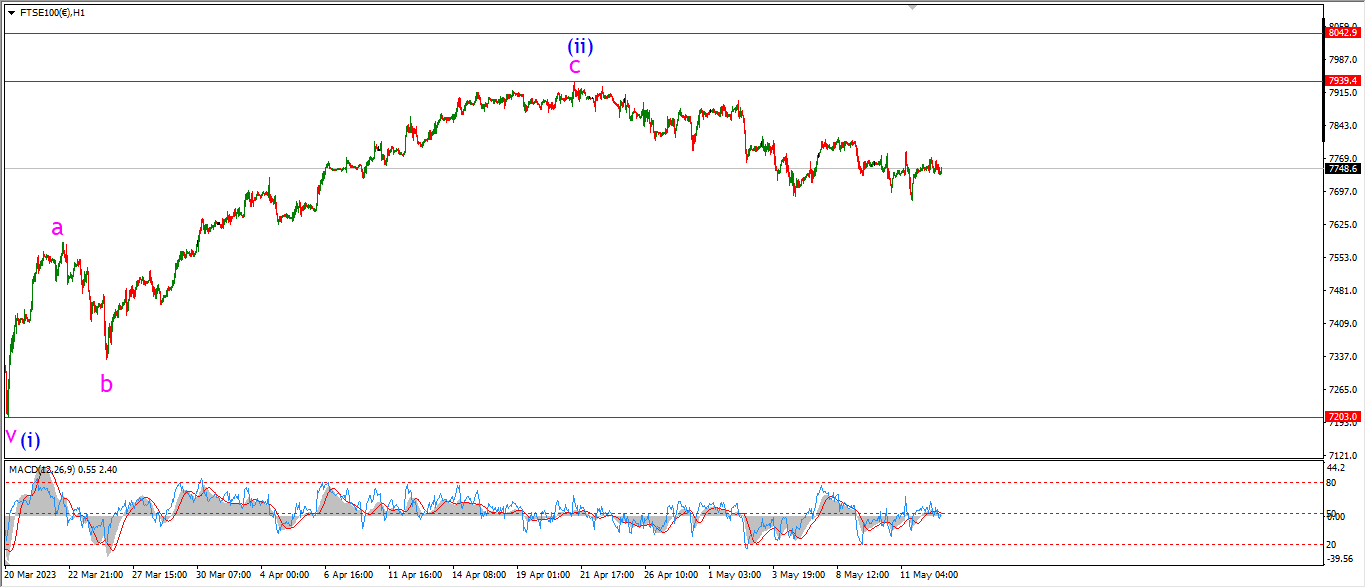
FTSE 100 1hr.
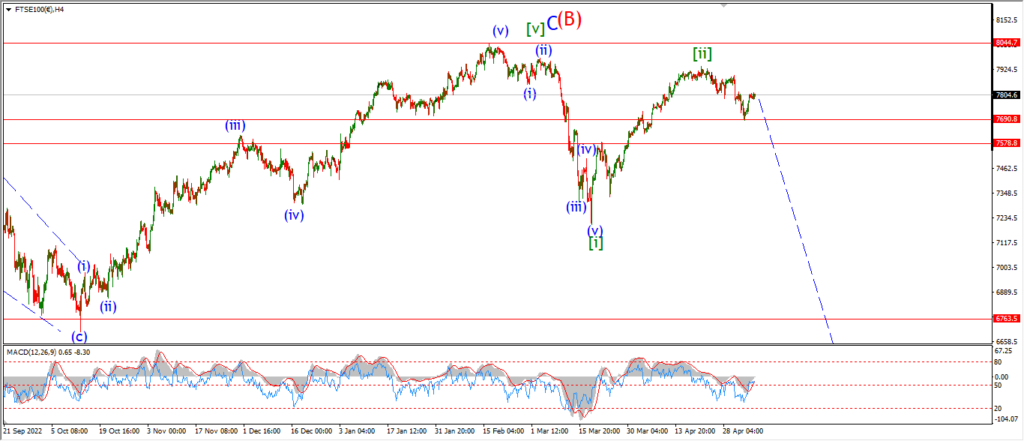
FTSE 100 4hr.
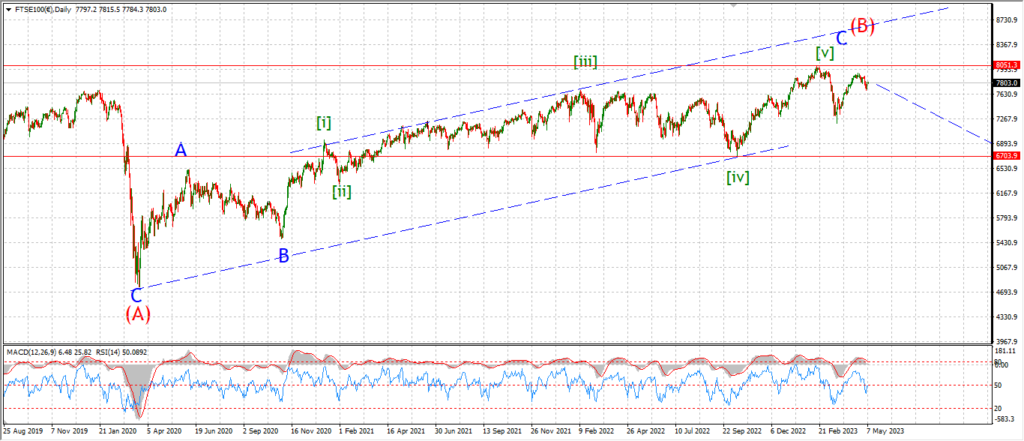
FTSE 100 daily.
….
DAX.
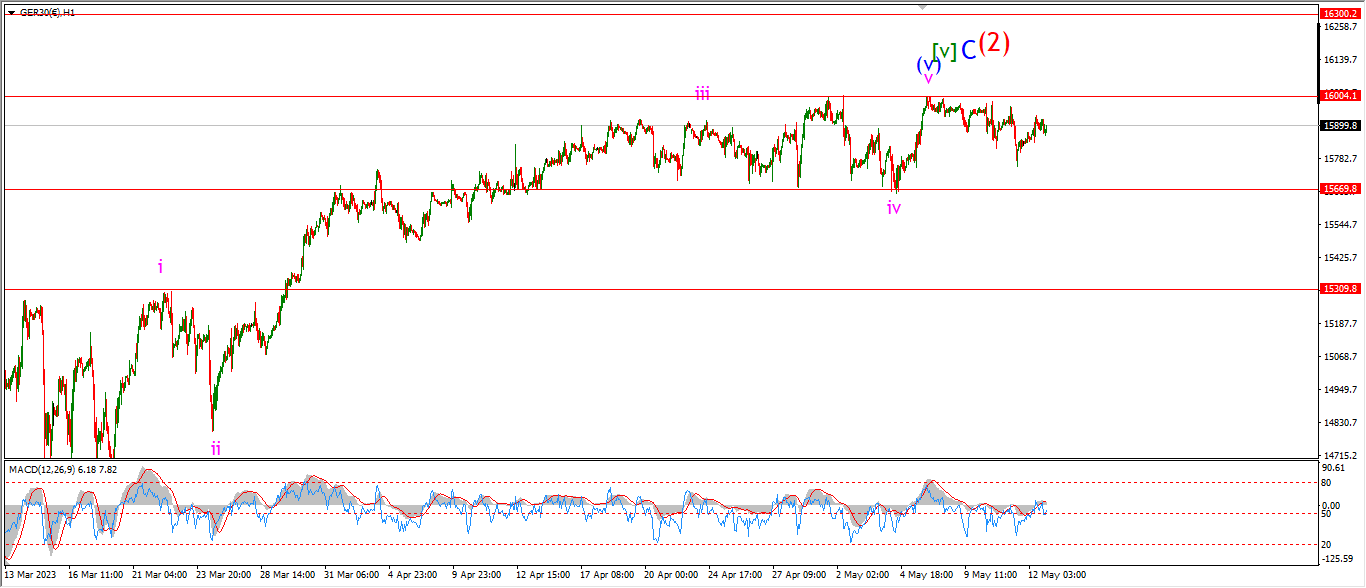
DAX 1hr
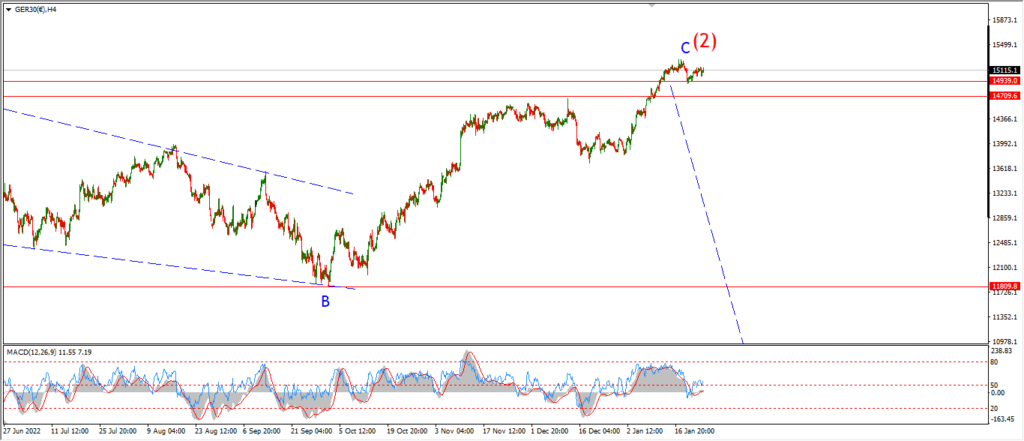
DAX 4hr

DAX daily.
….
NASDAQ 100.
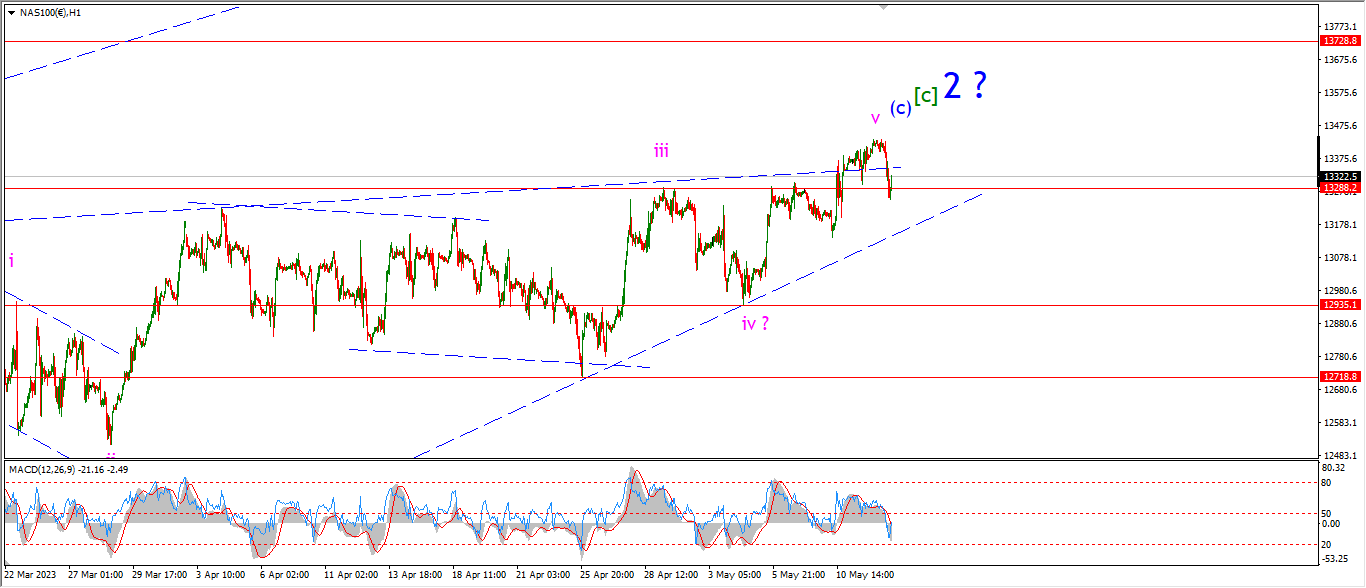
NASDAQ 1hr
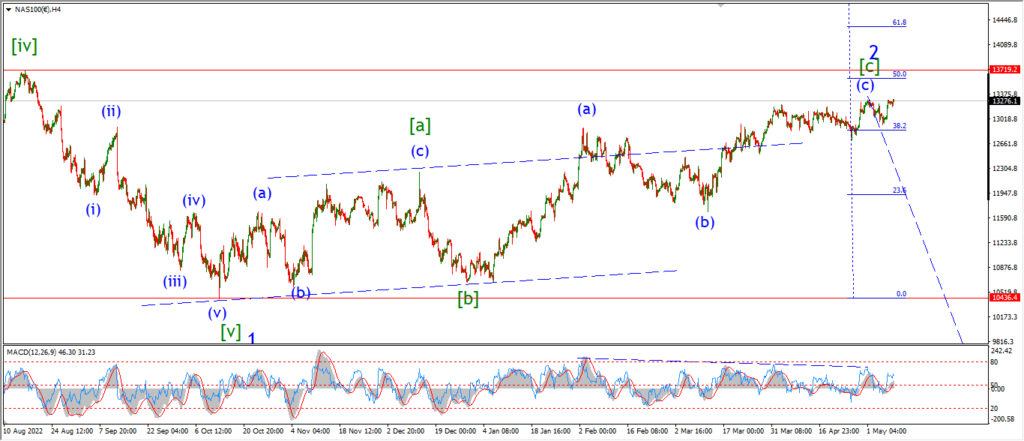
NASDAQ 4hr.

NASDAQ daily.
….