
[vc_row][vc_column][vc_separator border_width=”5″][/vc_column][/vc_row]
[vc_row][vc_column][vc_column_text]
Hi there everyone.
[/vc_column_text][/vc_column][/vc_row]
[_s2If current_user_can(access_s2member_ccap_eurusd)]
[vc_row][vc_column][vc_separator border_width=”5″][/vc_column][/vc_row]
[vc_row][vc_column][vc_column_text]
EURUSD
[/vc_column_text][/vc_column][/vc_row]
[vc_row][vc_column][vc_separator border_width=”5″][/vc_column][/vc_row][vc_row][vc_column width=”2/3″][vc_custom_heading text=”1 hr” use_theme_fonts=”yes”][vc_column_text]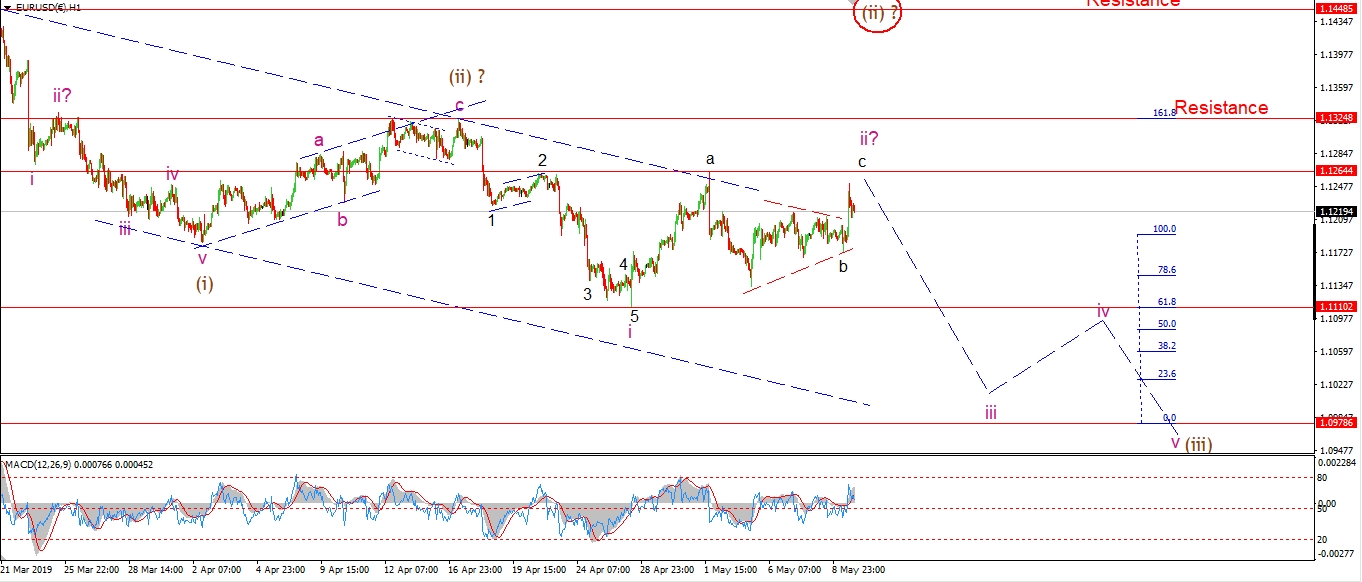 [/vc_column_text][/vc_column][vc_column width=”1/3″][vc_custom_heading text=”4 Hours” use_theme_fonts=”yes”][vc_column_text]
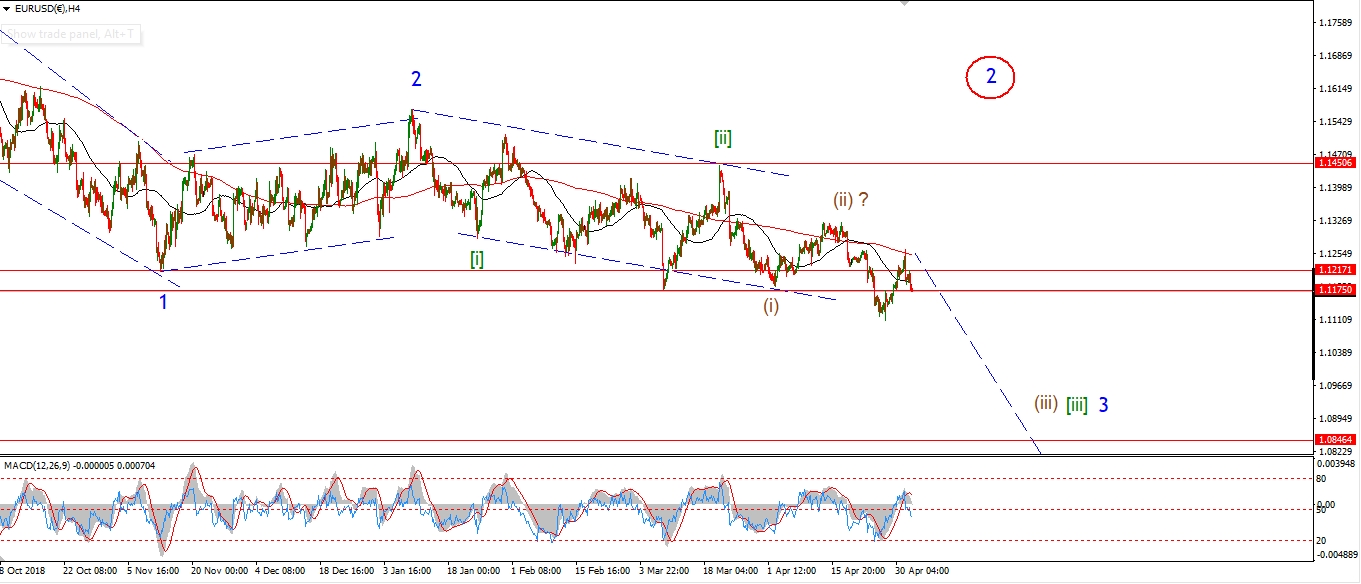 [/vc_column_text][vc_custom_heading text=”Daily” use_theme_fonts=”yes”][vc_column_text]
 [/vc_column_text][/vc_column][/vc_row]
[vc_row][vc_column][vc_column_text]
Today’s spike higher in EURUSD has triggered the alternate wave ‘ii’ pink idea.
The price compression over the last few sessions turned out to be a triangle wave ‘b’ of ‘ii’.
And wave ‘c’ pushed out of that low today.
Wave ‘c’ should break the high of wave ‘a’ at 1.1264 and then turn lower into wave ‘iii’ of (iii).
Once wave ‘ii’ completes,
we should see a five wave decline to signal wave ‘iii’ has begun.
Tomorrow;
Watch for wave ‘c’ of ‘ii’ to complete with a break of 1.1264.
Resistance at 1.1324 must now hold.
[/vc_column_text][/vc_column][/vc_row]
[/_s2If]
[_s2If current_user_can(access_s2member_ccap_gbpusd)]
[vc_row][vc_column][vc_separator border_width=”5″][/vc_column][/vc_row][vc_row][vc_column][vc_column_text]
GBPUSD
[/vc_column_text][/vc_column][/vc_row][vc_row][vc_column][vc_separator border_width=”5″][/vc_column][/vc_row][vc_row][vc_column width=”2/3″][vc_custom_heading text=”1 hr” use_theme_fonts=”yes”][vc_column_text]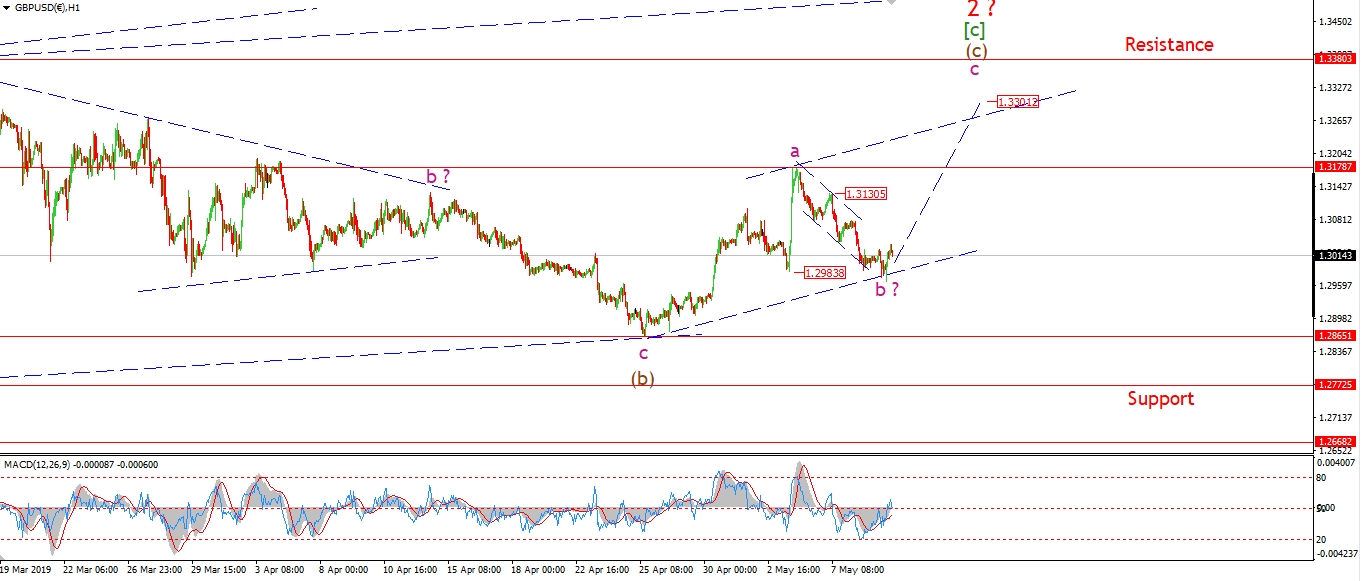 [/vc_column_text][/vc_column][vc_column width=”1/3″][vc_custom_heading text=”4 Hours” use_theme_fonts=”yes”][vc_column_text]
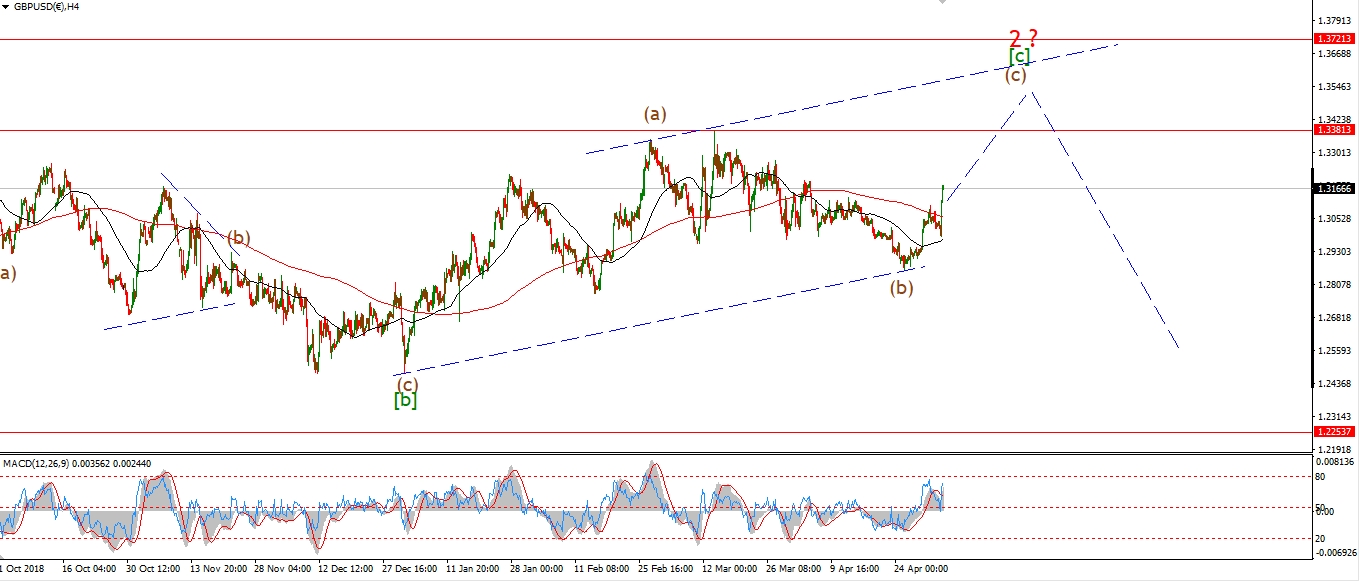 [/vc_column_text][vc_custom_heading text=”Daily” use_theme_fonts=”yes”][vc_column_text]
 [/vc_column_text][/vc_column][/vc_row]
[vc_row][vc_column][vc_column_text]
Cable is rising off the session lows this evening.
This may well mark the end of wave ‘b’ of (c).
Wave ‘c’ should now push higher towards the upper trend line of the trend channel.
A break of 1.3130 will confirm this wave count.
While the trendline suggests a target for wave ‘c’ at 1.3300.
Ideally wave (c) would complete at 1.3380.
Tomorrow;
Watch for wave ‘c’ of (c) to continue higher over the coming days.
If 1.2865 breaks again,
That will suggest that wave ‘2’ has completed as a running flat.
And that wave ‘3’ was underway.
[/vc_column_text][/vc_column][/vc_row]
[/_s2If]
[_s2If current_user_can(access_s2member_ccap_usdjpy)]
[vc_row][vc_column][vc_separator border_width=”5″][/vc_column][/vc_row][vc_row][vc_column][vc_column_text]
USDJPY
[/vc_column_text][/vc_column][/vc_row][vc_row][vc_column][vc_separator border_width=”5″][/vc_column][/vc_row][vc_row][vc_column width=”2/3″][vc_custom_heading text=”1 hr” use_theme_fonts=”yes”][vc_column_text]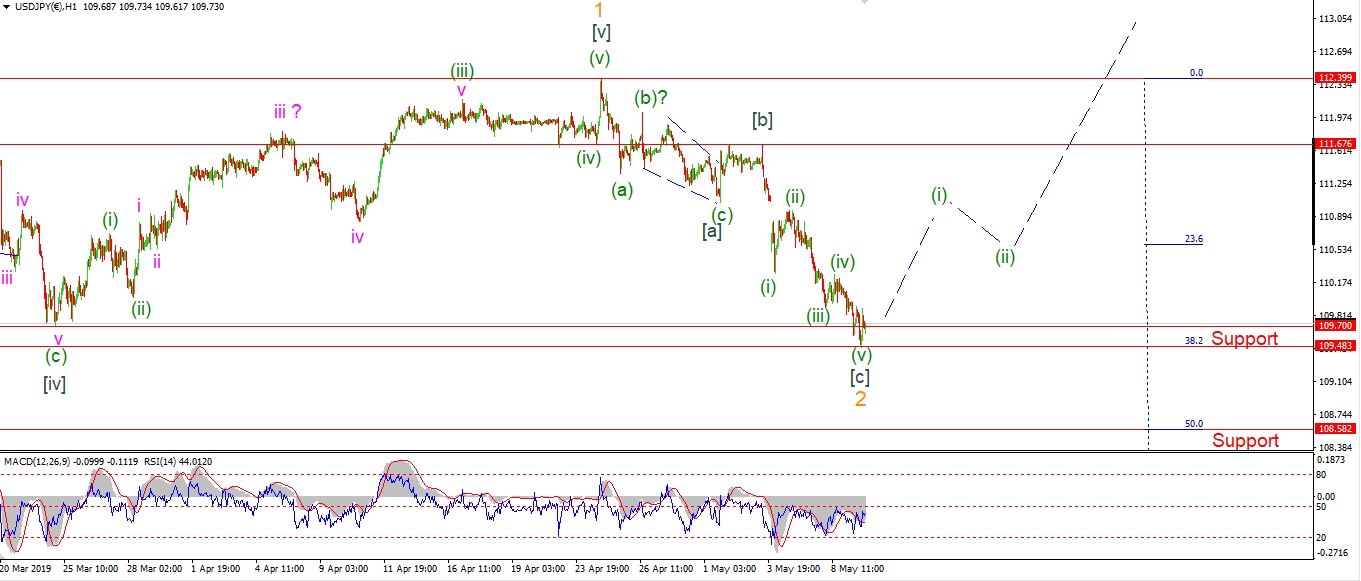 [/vc_column_text][/vc_column][vc_column width=”1/3″][vc_custom_heading text=”4 Hours” use_theme_fonts=”yes”][vc_column_text]
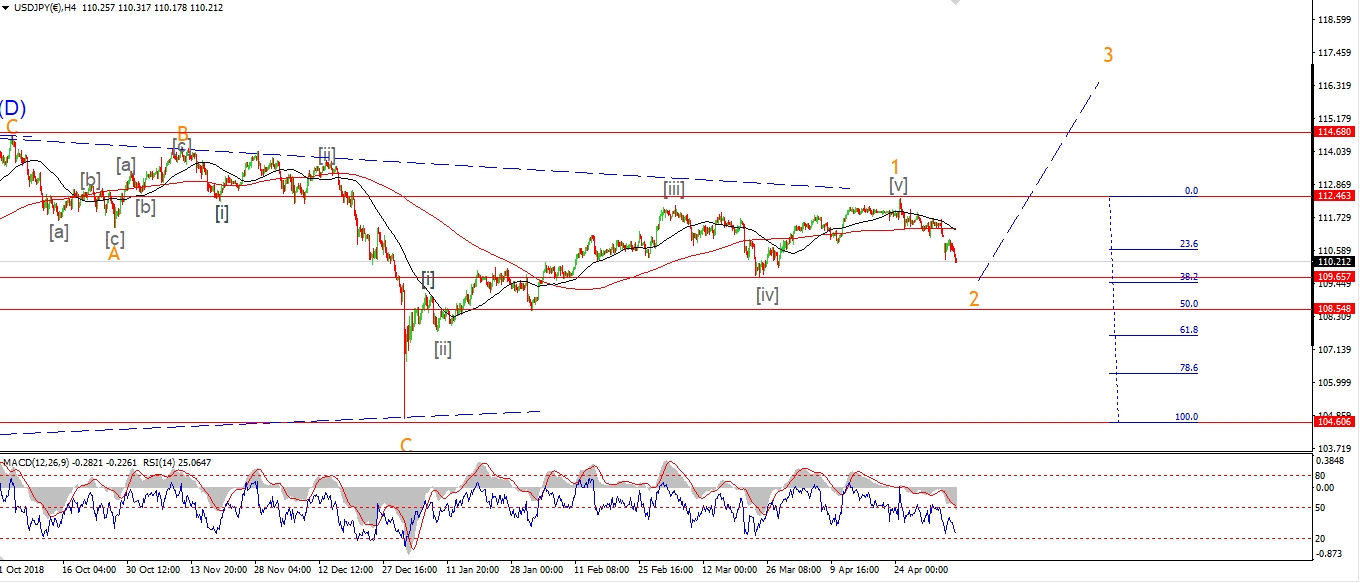 [/vc_column_text][vc_custom_heading text=”Daily” use_theme_fonts=”yes”][vc_column_text]
 [/vc_column_text][/vc_column][/vc_row]
[vc_row][vc_column][vc_column_text]
USDJPY dropped below 109.70 today and triggered the alternate count.
The price hit the 38.2% retracement of wave ‘1’
and then bounced off that level slightly.
It remains to be seen if we have reached the end of this decline in wave ‘2’.
Wave [c] of ‘2’ can be labelled as a five wave decline,
that does suggest the decline is complete.
Tomorrow;
Watch for a new impulsive pattern to begin to the upside in wave (i) and (ii).
Once this is done,
we will have the best indication yet that the market is about to begin a long rally in wave ‘3’.
[/vc_column_text][/vc_column][/vc_row]
[/_s2If]
[_s2If current_user_can(access_s2member_ccap_dow_jones)]
[vc_row][vc_column][vc_separator border_width=”5″][/vc_column][/vc_row][vc_row][vc_column][vc_column_text]
DOW JONES INDUSTRIALS
[/vc_column_text][/vc_column][/vc_row][vc_row][vc_column][vc_separator border_width=”5″][/vc_column][/vc_row][vc_row][vc_column width=”2/3″][vc_custom_heading text=”1 hr” use_theme_fonts=”yes”][vc_column_text]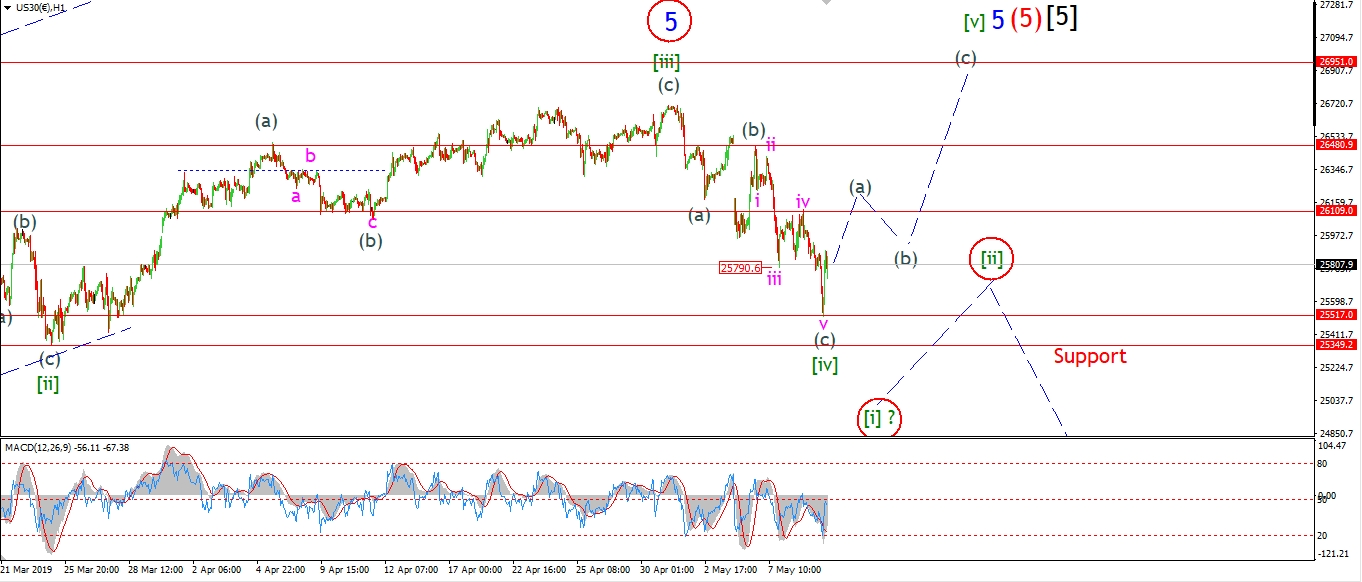 [/vc_column_text][/vc_column][vc_column width=”1/3″][vc_custom_heading text=”4 Hours” use_theme_fonts=”yes”][vc_column_text]
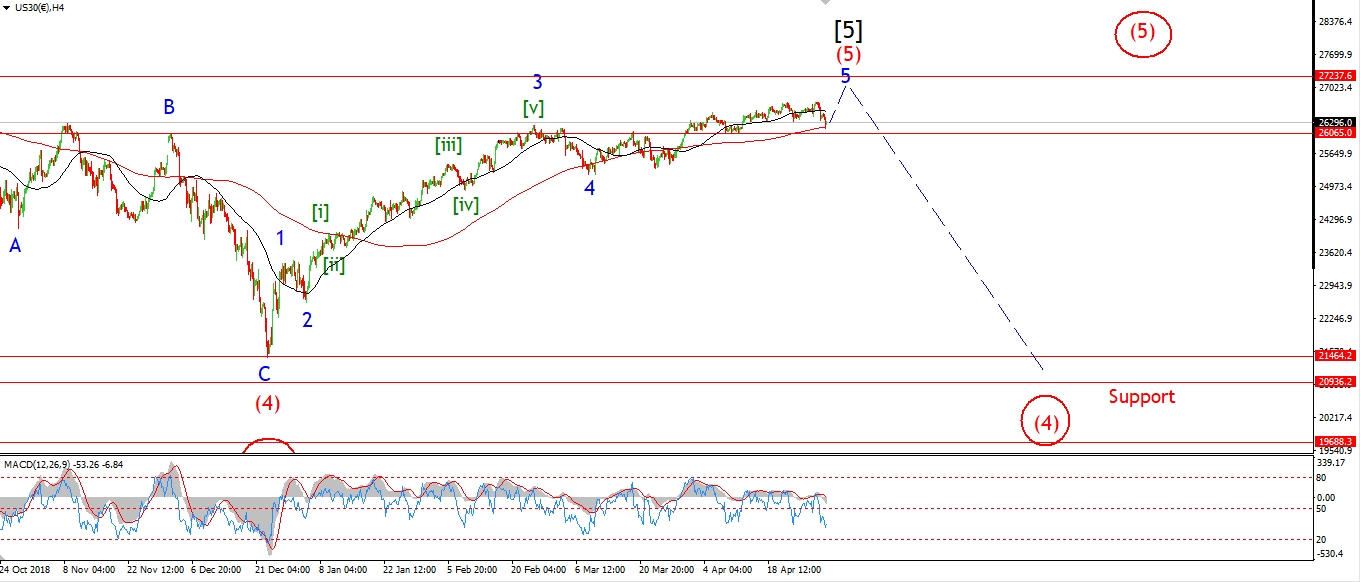 [/vc_column_text][vc_custom_heading text=”Daily” use_theme_fonts=”yes”][vc_column_text]
 [/vc_column_text][/vc_column][/vc_row]
[vc_row][vc_column][vc_column_text]
The market had a viscous sell off today, down 450 points from Wednesdays close at the low.
And then the dip buyers came in!
The market is now off by about 100 points and still climbing.
The flat correction in wave ‘iv’ pink proved correct last night.
the early decline today is viewed as wave ‘v’ of (c).
And this should complete wave [iv] as a 3,3,5 flat correction also.
The rally off the low should now begin a three wave rally
to a new all time high in an ending diagonal wave [v].
Tomorrow;
The low of the day hit 25517.
This level must now hold as wave [v] gets going.
[/vc_column_text][/vc_column][/vc_row]
[/_s2If]
[_s2If current_user_can(access_s2member_ccap_gold)]
[vc_row][vc_column][vc_separator border_width=”5″][/vc_column][/vc_row][vc_row][vc_column][vc_column_text]
GOLD
[/vc_column_text][/vc_column][/vc_row][vc_row][vc_column][vc_separator border_width=”5″][/vc_column][/vc_row][vc_row][vc_column width=”2/3″][vc_custom_heading text=”1 hr” use_theme_fonts=”yes”][vc_column_text] [/vc_column_text][/vc_column][vc_column width=”1/3″][vc_custom_heading text=”4 Hours” use_theme_fonts=”yes”][vc_column_text]
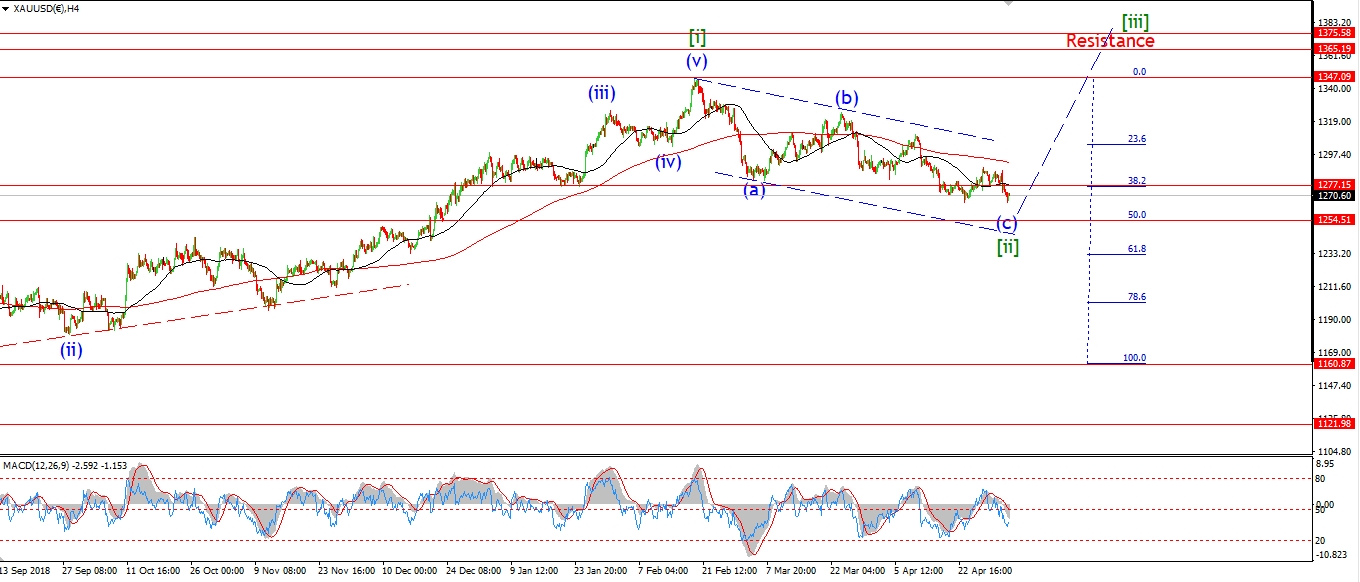 [/vc_column_text][vc_custom_heading text=”Daily” use_theme_fonts=”yes”][vc_column_text]
 [/vc_column_text][/vc_column][/vc_row]
[vc_row][vc_column][vc_column_text]
Gold is up today to create a lower high within wave ‘ii’ pink.
Wave ‘ii’ should trace out a three wave decline,
and complete above 1267 at the recent low.
Wednesdays high hit 1291.50, if the price rallies above that level.
That will signal that wave ‘iii’ of (i) has begun.
Tomorrow;
Watch for wave ‘ii’ to complete above 1267.
[/vc_column_text][/vc_column][/vc_row]
[/_s2If]
[_s2If current_user_can(access_s2member_ccap_crude)]
[vc_row][vc_column][vc_separator border_width=”5″][/vc_column][/vc_row][vc_row][vc_column][vc_column_text]
U.S CRUDE OIL
[/vc_column_text][/vc_column][/vc_row][vc_row][vc_column][vc_separator border_width=”5″][/vc_column][/vc_row][vc_row][vc_column width=”2/3″][vc_custom_heading text=”1 hr” use_theme_fonts=”yes”][vc_column_text]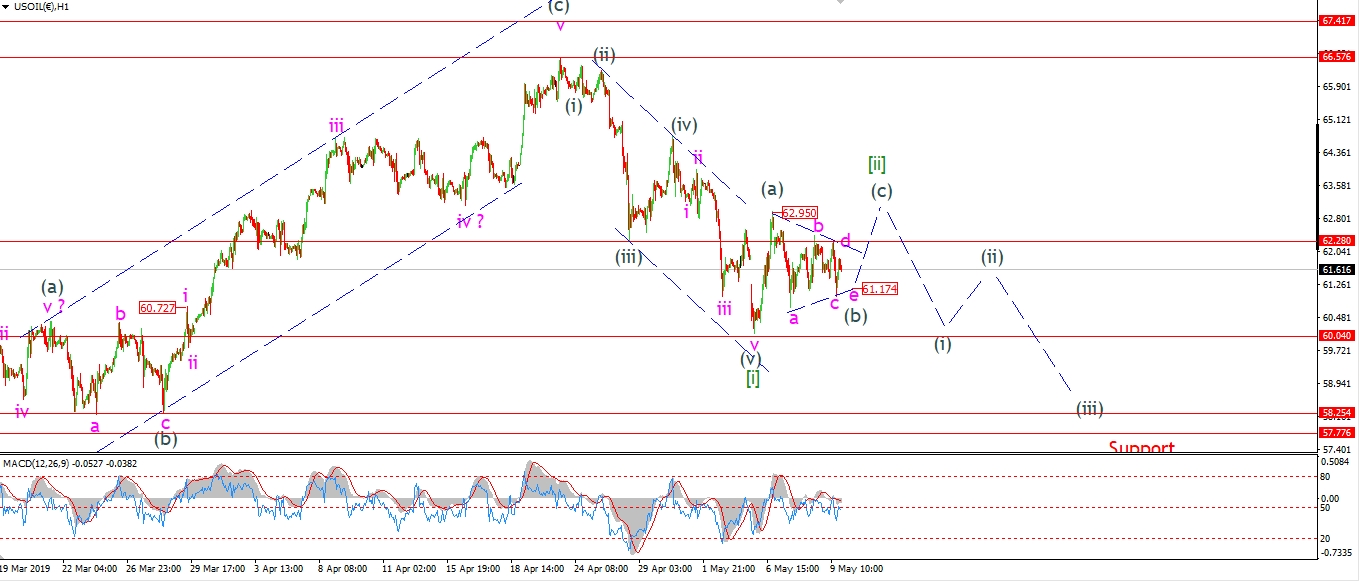 [/vc_column_text][/vc_column][vc_column width=”1/3″][vc_custom_heading text=”4 Hours” use_theme_fonts=”yes”][vc_column_text]
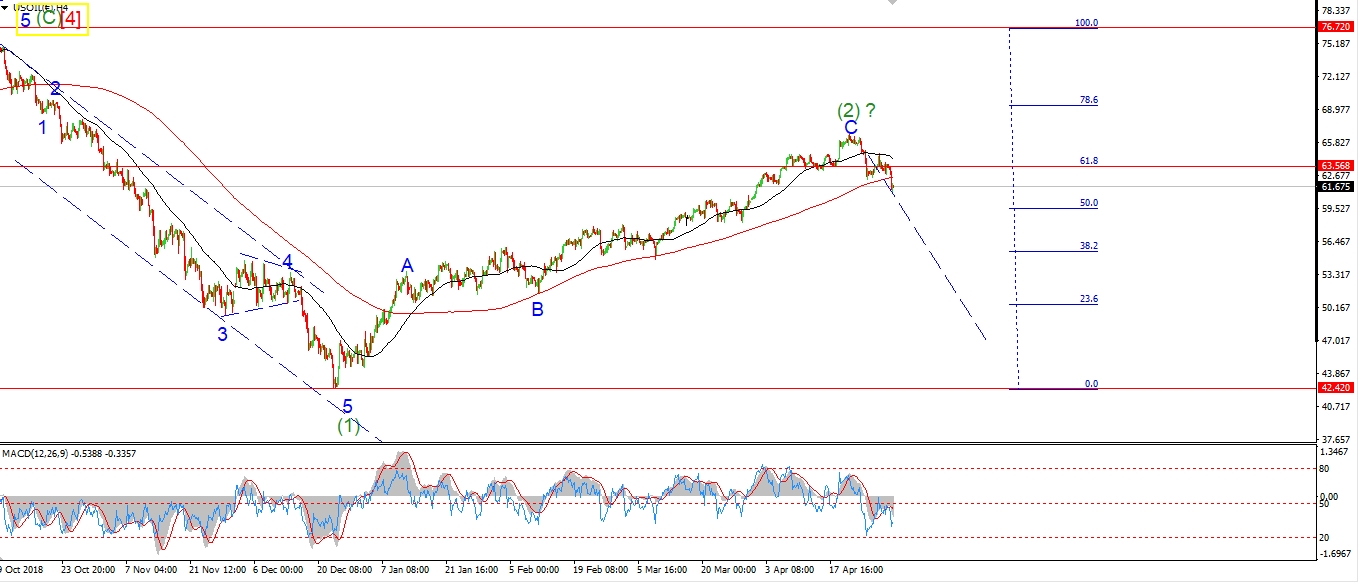 [/vc_column_text][vc_custom_heading text=”Daily” use_theme_fonts=”yes”][vc_column_text]
 [/vc_column_text][/vc_column][/vc_row]
[vc_row][vc_column][vc_column_text]
There are a few ways to view the drop off the recent high.
I have shown another possibility tonight as a five wave decline in wave [i],
and the current correction as wave [ii].
The price has continued to contract today in a possible triangle wave (b) of [ii].
The triangle should complete at the lower trend line at about 61.17.
Wave (c) of [ii] should then rise to break 62.65 again
and complete a three wave correction.
Tomorrow;
Watch for wave (b) to complete in a triangle at 61.17.
Wave (c) should begin from there.
[/vc_column_text][/vc_column][/vc_row]
[/_s2If]
[_s2If current_user_can(access_s2member_ccap_us10yr)]
[vc_row][vc_column][vc_separator border_width=”5″][/vc_column][/vc_row][vc_row][vc_column][vc_column_text]
US 10 yr Treasuries.
[/vc_column_text][/vc_column][/vc_row][vc_row][vc_column][vc_separator border_width=”5″][/vc_column][/vc_row][vc_row][vc_column width=”2/3″][vc_custom_heading text=”1 hr” use_theme_fonts=”yes”][vc_column_text]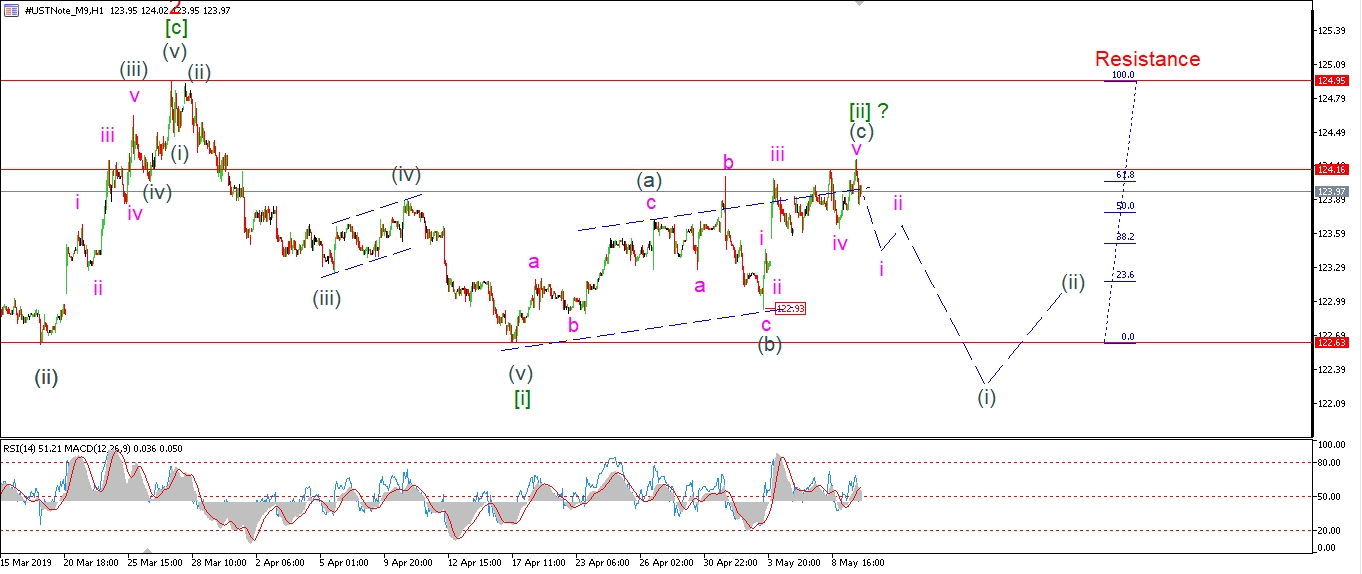 [/vc_column_text][/vc_column][vc_column width=”1/3″][vc_custom_heading text=”4 Hours” use_theme_fonts=”yes”][vc_column_text]
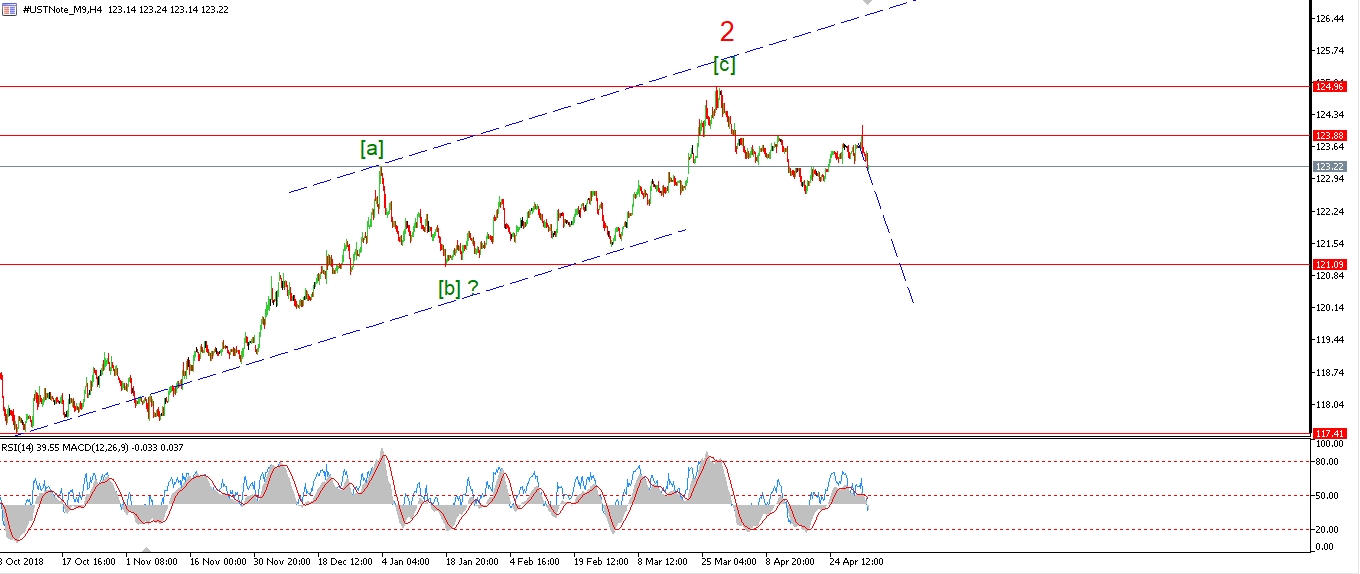 [/vc_column_text][vc_custom_heading text=”Daily” use_theme_fonts=”yes”][vc_column_text]
 [/vc_column_text][/vc_column][/vc_row]
[vc_row][vc_column][vc_column_text]
The 10YR is reluctant to give up the corrective rally just yet!
The price pushed up to create another slight new high today,
before selling off again immediately.
It is possible that wave ‘iv’ traced out a running flat correction at Wednesdays low.
And todays spike higher was wave ‘v’ of (c) now completed.
If we see a push below 122.93 over the coming few days,
that should confirm the top is in for wave [ii].
Tomorrow;
Watch for wave (i) of [iii] to begin with a bearish lower high as shown.
[/vc_column_text][/vc_column][/vc_row]
[/_s2If]
[_s2If current_user_can(access_s2member_ccap_silver)]
[vc_row][vc_column][vc_separator border_width=”5″][/vc_column][/vc_row][vc_row][vc_column][vc_column_text]
SILVER
[/vc_column_text][/vc_column][/vc_row][vc_row][vc_column][vc_separator border_width=”5″][/vc_column][/vc_row][vc_row][vc_column width=”2/3″][vc_custom_heading text=”1 hr” use_theme_fonts=”yes”][vc_column_text]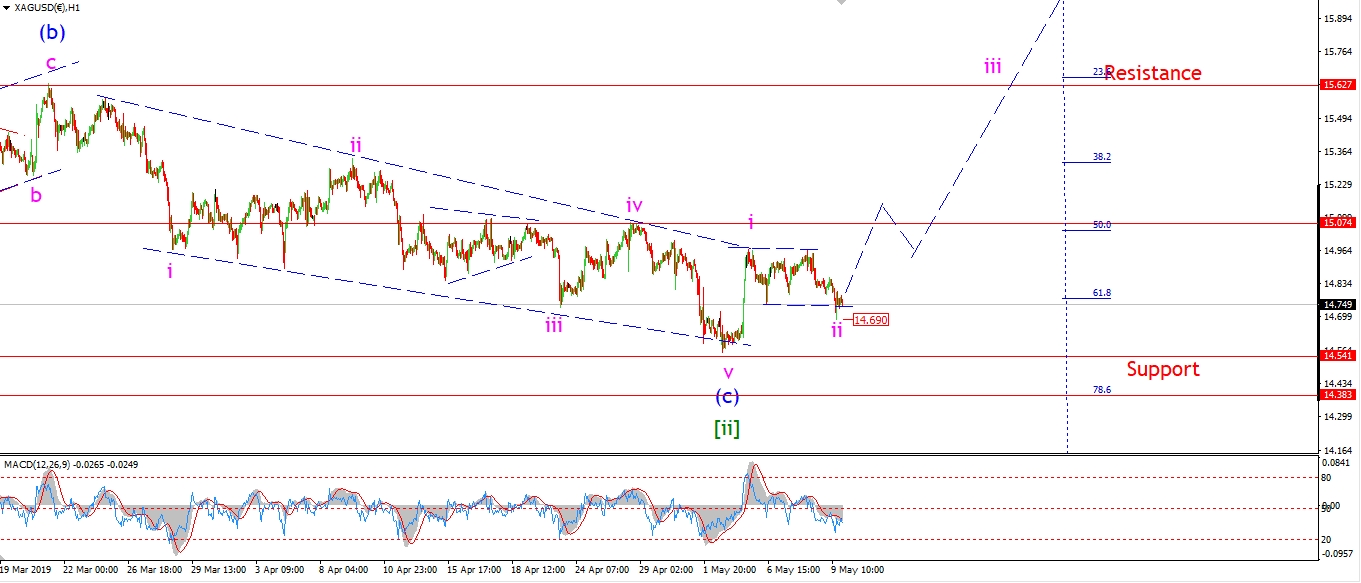 [/vc_column_text][/vc_column][vc_column width=”1/3″][vc_custom_heading text=”4 Hours” use_theme_fonts=”yes”][vc_column_text]
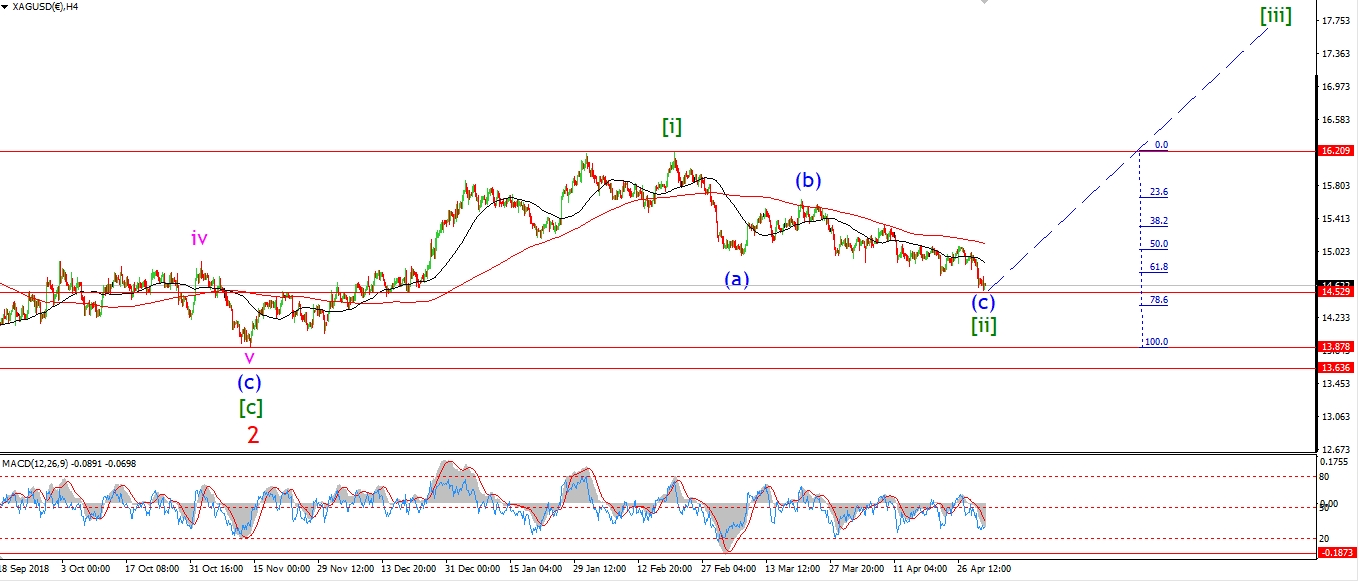 [/vc_column_text][vc_custom_heading text=”Daily” use_theme_fonts=”yes”][vc_column_text]
 [/vc_column_text][/vc_column][/vc_row]
[vc_row][vc_column][vc_column_text]
Silver seems to have completed a three wave correction at todays low of 14.69.
The price is holding above that level now,
And we should see a rally begin tomorrow in wave ‘iii’ of (i) of [iii].
the low at 14.54 must hold from here on.
Tomorrow;
Watch for a small impulsive move back above 15.07 to begin wave ‘iii’ up.
[/vc_column_text][/vc_column][/vc_row]
[/_s2If]
[_s2If current_user_can(access_s2member_ccap_sp500)]
[vc_row][vc_column][vc_separator border_width=”5″][/vc_column][/vc_row][vc_row][vc_column][vc_column_text]
S&P 500.
[/vc_column_text][/vc_column][/vc_row][vc_row][vc_column][vc_separator border_width=”5″][/vc_column][/vc_row][vc_row][vc_column width=”2/3″][vc_custom_heading text=”1 hr” use_theme_fonts=”yes”][vc_column_text] [/vc_column_text][/vc_column][vc_column width=”1/3″][vc_custom_heading text=”4 Hours” use_theme_fonts=”yes”][vc_column_text]
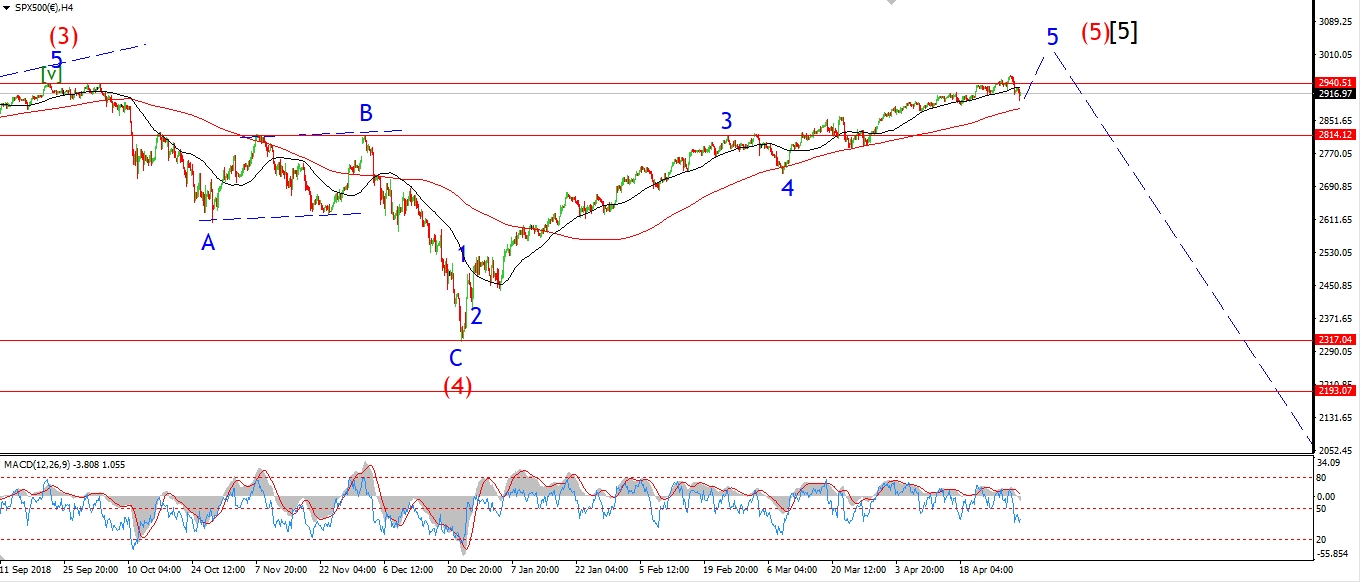 [/vc_column_text][vc_custom_heading text=”Daily” use_theme_fonts=”yes”][vc_column_text]
 [/vc_column_text][/vc_column][/vc_row]
[vc_row][vc_column][vc_column_text]
The S&P also declined today and broke support at 2852, the previous wave [i] high.
This action triggers the alternate count for wave ‘5’.
Wave ‘5’ is now shown as an ending diagonal.
With todays lows labelled as wave [iv] of ‘5’.
I am still allowing for one last high in wave [v] before turning fully bearish on the market.
If wave [v] comes,
it should be short and sweet!
Tomorrow;
Watch for wave (a) of [v] to hold above 2836.
A push above 2900 again will confirm that wave [v] has begun.
[/vc_column_text][/vc_column][/vc_row]
[/_s2If]
[vc_row][vc_column][vc_column_text]
[/vc_column_text][/vc_column][/vc_row]
[vc_row][vc_column][vc_separator border_width=”5″][/vc_column][/vc_row]